| Information |  | |
Derechos | Equipo Nizkor
| ||
| Information | | |
Derechos | Equipo Nizkor
| ||
Mar15
Afghanistan Opium Survey 2014
Socio-economic analysis
Back to ContentsContents
Fact Sheet Afghanistan Opium Survey 2014
3 The opiate economy in Afghanistan: Overview
4 The 2014 opiate economy in Afghanistan
4.1 Opium farm-gate prices
4.2 Farm-gate value of opium production and income from opium
4.3 Potential value of the 2014 opiate economy in Afghanistan6 Reasons for cultivating opium poppy
6.1 Reasons for cultivating opium poppy declared by farmers
6.2 Links between lack of access to development facilities, security and opium cultivation
6.3 Geographical assessment of risk factors for opium cultivation
6.4 Lessons learned from the risk assessment7.1 Village survey methodology
7.2 Average farm-gate price and farm-gate value of opium production
7.3 Estimating the value of the Afghan opiate economy
7.4 Adjusting for inflation
7.5 Assessing the risk of opium poppy cultivation in Afghanistan
7.6 Environmental suitability and socio-economic vulnerability
List of Figures
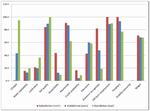
Figure 1: Afghanistan GDP, potential export value of opiates and value of Afghan exports of goods and services (US dollars (billions))
Figure 2: Average nominal farm-gate prices of dry opium in US dollars (purple line) together with annual opium production (green bars)
Figure 3: Regional average price of dry opium reported by traders, January 2005-October 2013 (US dollars per kilogram)
Figure 4: Average nominal (current) farm-gate prices of dry opium (US dollars: green bars) and prices adjusted for inflation (constant prices adjusted to 2004 price: line)
Figure 5: Farm-gate value of opium production in Afghanistan (current price), 2008-2014 (US dollars per kilogram)
Figure 6: Nominal (current price) farm-gate value in US dollars (millions: bars), together with the farm-gate value adjusted for inflation (constant price adjusted to 2004 price: line) in US dollars, 2004 to 2013
Figure 7: GDP and net value of the opiate economy in Afghanistan, 2014 (US dollars (billions))
Figure 8: Potential gross export value of opiate production, and farm-gate value, 2000-2014 (US dollars)
Figure 9: Nominal gross export value of opiates (US dollars: bars), together with the gross export value of opiates adjusted for inflation (US dollars: line), 2004 to 2014
Figure 10: Gross income per hectare from opium and wheat, 2003-2014 (US dollars per hectare)
Figure 11: Average annual income of all farmers, by region, 2011 to 2013 (reported in 2012, 2013 and 2014)
Figure 12: Proportion of different 2013 income sources, by type of farmer (data collected in 2014)
Figure 13: Reasons for cultivating opium, 2013-2014
Figure 14: Reasons for ceasing opium cultivation in or before 2013-2014
Figure 15: Percentage of farmers who reported disease as a reason for ceasing cultivation, by region, 2014
Figure 16: Reasons for never cultivating opium in 2013-2014
Figure 17: Access to boys' school and a girls' schools in the Eastern, Southern and Western regions, by poppy-growing status, 2014
Figure 18: Conceptual framework defining the risk of opium poppy cultivation: risk is composed of environmental and climatic suitability, and vulnerability to illicit cultivation determined by socio-economic factors derived from the UNODC/MCN village surveys and ancillary data
Figure 19: Risk, socio-economic vulnerability and environmental suitability in selected areas of Farah and Balkh
Figure 20: Decomposition of indicators related to environmental suitability and socio-economic vulnerability in selected areas in Farah and Balkh*
Figure 21: Decomposition of environmental suitability and socio-economic vulnerability in selected areas in Nangarhar and Hilmand*
Figure 22: Decomposition of environmental suitability and socio-economic vulnerability in selected areas in Badakhshan*
Figure 23: Scatter plots of household data, village data and population data of the village frame
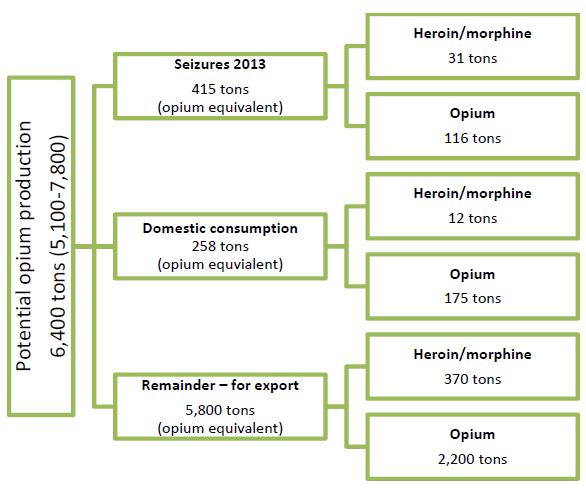
Figure 24: Opiates in Afghanistan, by destination, 2014
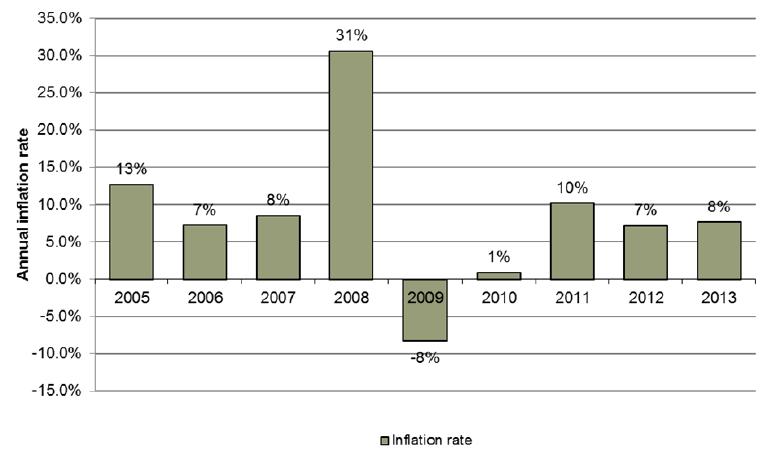
Figure 25: Inflation rates in Afghanistan
List of Tables
Table 1: Regional farm-gate prices of dry opium at harvest time, reported by farmers through the price-monitoring system, 2013-2014 (US dollars per kilogram)
Table 2: Prices of dry opium reported by traders, by region, August 2013-August 2014 (US dollars per kilogram)
Table 3: Prices (rounded) and approximate amounts of acetic anhydride needed for the production of 1 kilogram of heroin, 2014
Table 4: Overview of different values/revenues per kilogram of opium/heroin (rounded), 20102014 (US dollars)
Table 5: Gross and net income per hectare, 2011-2014 (US dollars per hectare)
Table 6: Average expenditure on poppy and wheat, per hectare, 2014 (US dollars per hectare)
Table 7: Average annual income of all farmers, by region, 2011 to 2013 (reported in 2012, 2013 and 2014)
Table 8: Sources of 2013 income for all farmers, by region (reported in 2014)
Table 9: Reported average 2012 and 2013 annual household income, by region and by opium-growing status (data collected in 2012 and 2013, respectively)
Table 10: Average size of outstanding loans in US dollars per household and percentage of farmers with a loan, 2010-2014
Table 11: Daily wage rates for different activities in Afghanistan, 2010-2014
Table 12: Updated conversion ratio of opium to pure heroin base and of opium to heroin of export quality (52% purity) with opium of 12.3% morphine content and 34% laboratory efficiency (kilograms of raw opium needed to produce 1 kilogram of pure heroin base and 1 kilogram of heroin of export quality, respectively)
Table 13: Proportions of seizures by opiate type in Afghanistan and neighbouring countries (Percentage)
Table 14: Potential heroin production from Afghan opium, 2014
Table 15: Estimated gross and net values, 2014 (US dollars)
Table 16: Domestic opiate market, 2009
Table 17: Properties of indicators of poppy suitability
Table 18: AHP-Weightings for land cover (H1)
Table 19: ECOCROP Model parameters for climate suitability (S3)
Table 20: Properties of Indicators of socio-economic vulnerability
Fact Sheet Afghanistan Opium Survey 2014 |1|
2013 Change from 2013 2014 Net opium poppy cultivation (after eradication) in hectares 209,000 ha (173,000 - 238,000) 7% 224,000 ha (200,000 - 250,500) Number of poppy-free provinces |2| 15 0 15 Number of provinces affected by poppy cultivation |3| 19 0 19 Eradication (hectares) 7,348 ha -63% 2,692 ha Average opium yield (weighted by cultivation) in kilograms per hectare 26.3 kg/ha 9% 28.7 kg/ha Potential production of opium |4| 5,500 tons (4,500 - 6,500) 17% 6,400 tons (5,100 - 7,800) Average farm-gate price (weighted by production) of fresh opium at harvest time US$ 143/kg -20% US$ 114/kg Average farm-gate price (weighted by production) of dry opium at harvest time US$ 172/kg -23% US$ 133/kg GDP |5| US$ 21.04 billion 0.84% US$ 21.2 billion Total farm-gate value of opium production
In % of GDPUS$ 0.95 billion
4%-10%
0%US$ 0.85 billion
4%Potential gross value of opiates
In % of GDPUS$ 3.1 billion (US$ 2.0-3.9 billion)
15%-8.7% 2.84 billion (2.3-3.2 billion)
13.4%Potential net value of opiates
In % of GDP2.99 billion (2.0-3.7 billion)
14%-10.4 2.68 billion (2.3-2.9 billion)
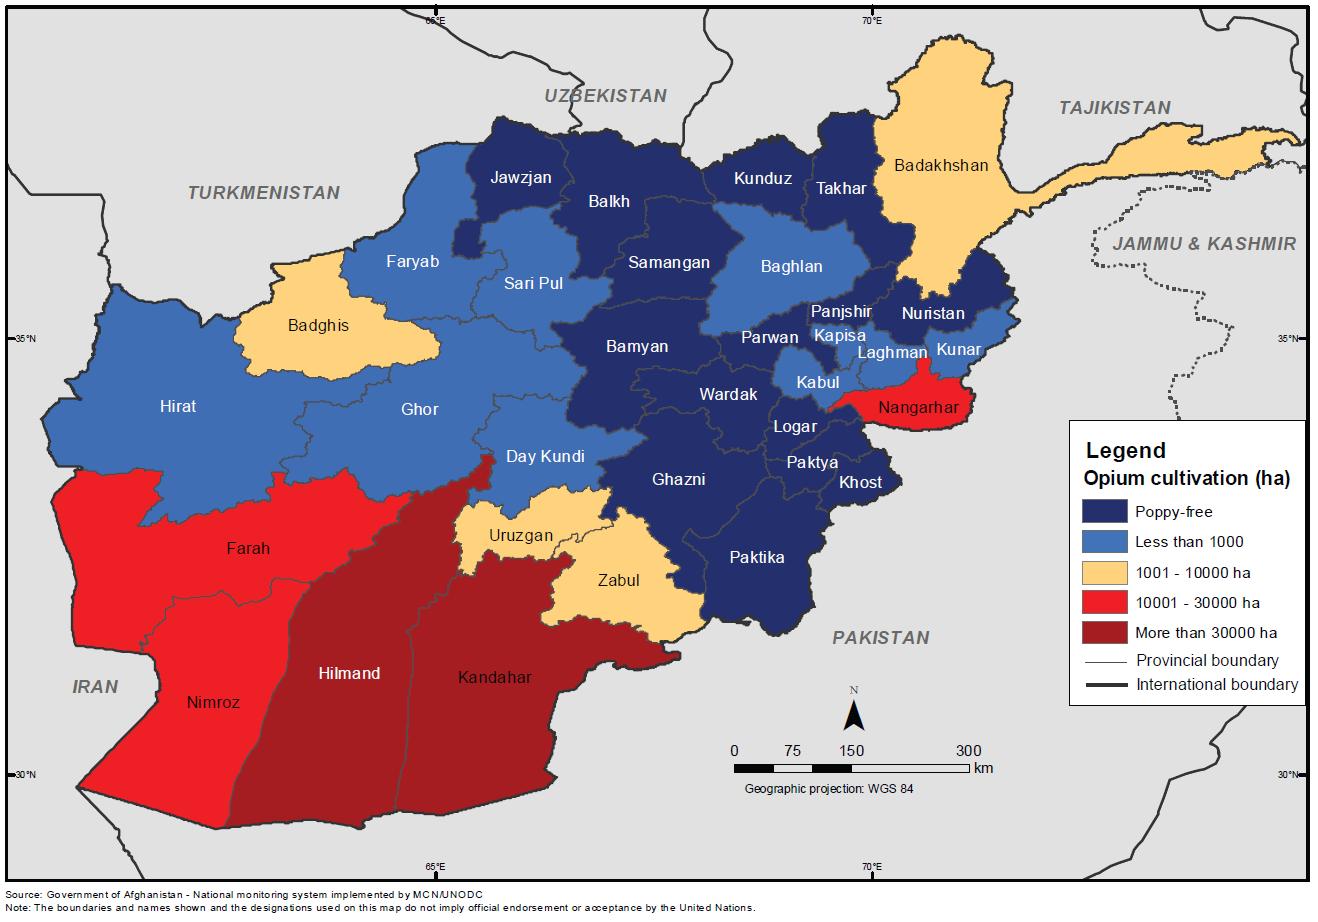
12.6%Farmers' gross income |6| from opium per hectare US$ 4,500 -16% US$ 3,800 Farmers' net income from opium per hectare US$ 3,600 -19% US$ 2,900 Opium cultivation in Afghanistan, 2014 (at province level)
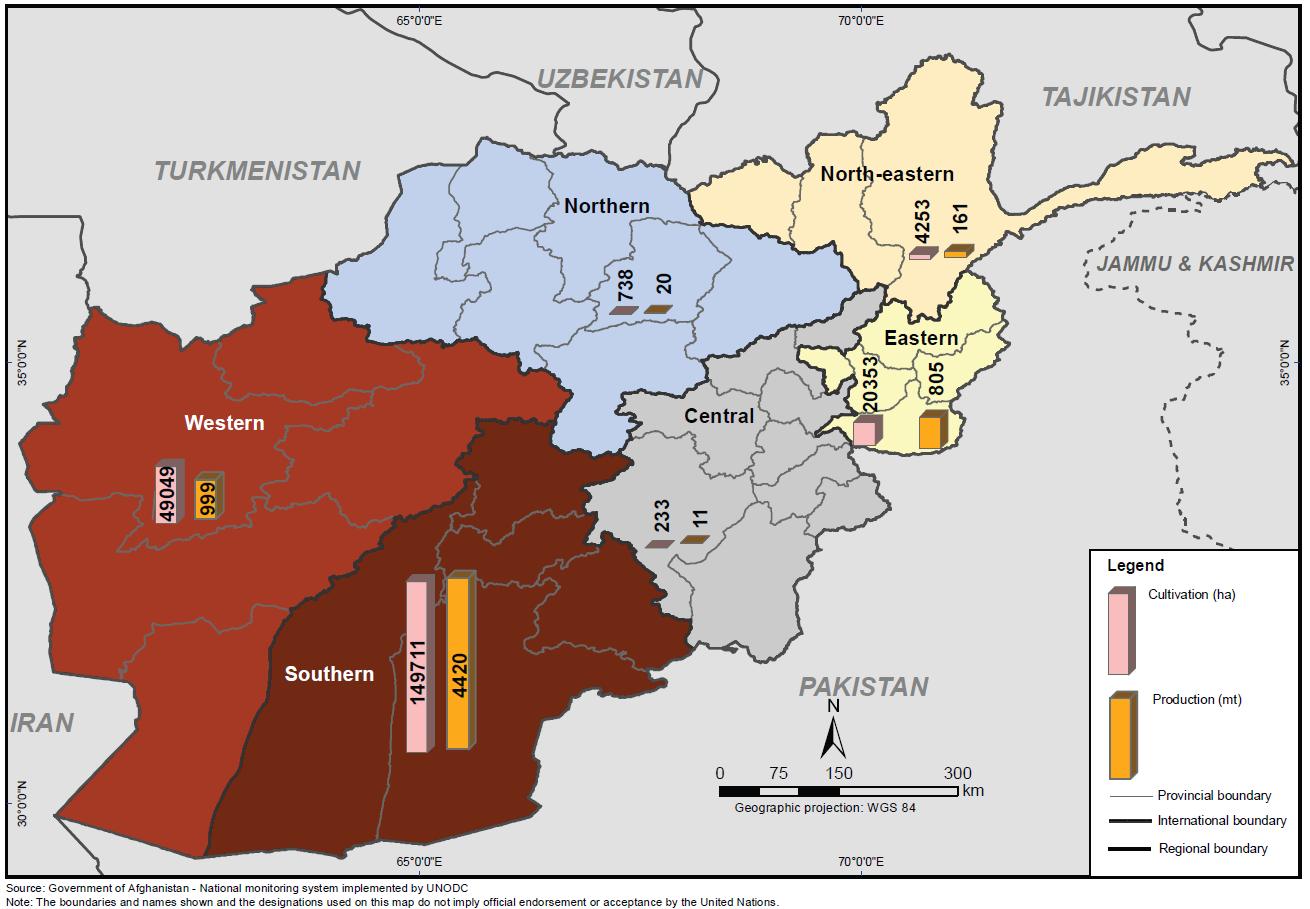
Click to enlargeRegional opium cultivation and production in Afghanistan, 2014

Click to enlarge1 Key findings
Afghanistan is currently going through a crucial transitional phase as it attempts to strengthen its civil administration and stabilize the country for its post-2014 political scenario. Such comprehensive political changes can only be accomplished once an institutional framework to strengthen and optimize the economic and socio-economic opportunities in the country is in place.
As the cultivation of opium is an important economic activity in many parts of the country and constitutes a significant share of the national economy, the comprehensive analysis of economic opportunities and challenges place special emphasis on this sector. Furthermore, given the multitude of factors driving opium poppy cultivation (and illicit crop cultivation in general), the findings of this survey can support policy responses formulated based on solid evidence. This part of the Afghanistan Opium Survey 2014 is therefore dedicated to the analysis of the opiate economy in Afghanistan and the factors and determinants driving opium poppy cultivation. It looks at opium cultivation from both an economic point of view, which includes indicators such as household income and the value of the country's opiate economy, and from a socio-economic point of view, which aims to shed light on the factors that influence opium poppy cultivation.
- Despite a decrease of almost 9% from the previous year (to US$ 2.84 billion) in the estimated potential gross value of opiates in Afghanistan, opiates still constituted a sizeable share of Afghanistan's economy in 2014. Accounting for 13% of the country's GDP, the value of opiates considerably exceeded the value of the export of licit goods and services in 2014, while the cultivation and production of Afghan opium actually increased from their 2013 levels. The total area under opium poppy cultivation was estimated at 224,000 hectares, a 7% increase from the previous year, whereas potential opium production was estimated at 6,400 tons, an increase of 17% from its 2013 level (5,500 tons) and the second highest level since 1994. |7|
- Although the average percentage of land area under opium cultivation as a percentage of total agricultural land cultivation in Afghanistan is not that extensive (3%), there are pockets where opium plays a major role in the rural economy. For example, opium represented an average of 12% of all farmers' incomes in the Southern region (reported in 2014) and accounted for almost 30% of the total area of agricultural land in Hilmand province, again Afghanistan's major opium-cultivating province in 2014. While the relative decrease in the value of the opium economy to GDP may indicate that Afghanistan's economy has become less and less dependent on income from opium, dependency on the opiate economy at the farmer level in many rural communities is still high.
- Consistent with the law of supply and demand, the increase in opium production in 2014 led to a 23% decrease in the average farm-gate price of dry opium in 2014, yet opium remained the most lucrative crop in the country: the ratio of gross income per hectare of wheat to opium poppy was 1:4 and the ratio of net income was 1:6. Opium thus remains a highly attractive crop to farmers, accounting for 36% of the income of farmers that actually grow poppy in Afghanistan.
- Average annual household income in Afghanistan, reported by farmers in 2013 (data collected in 2014), was, however, some 6% lower than in 2012, whereas in the Southern region, where most opium is cultivated, the decrease was 21%. This was not a direct consequence of opium prices in 2014, as data refers to 2013, but it shows that the rural economy continued to deteriorate in 2014.
- The deterioration in the economic situation of farmers was also reflected in daily wage rates in rural communities: all four wage types monitored (labour, e.g. in construction, poppy lancing, poppy weeding and wheat harvesting) decreased from their 2013 levels by between 5% and 9% in 2014. The rural economy in general benefits from the income earned from opium poppy cultivation (e.g. by providing salaried labour and by increasing domestic consumption), but even opium-growing farmers, who on average tend to be better off than non-opium-growing farmers, experienced a drop in income.
- Although income from opium decreased in 2014, the same percentage of farmers as in 2013 (33%) reported having outstanding loans. The average |8| size of those loans also remained stable (US$ 981 in 2014; US$ 957 in 2013) but there was a 28% increase in the average size of loan (from US$ 837 in 2013 to US$ 1,070) among opium poppy-growing households.
- The price decrease in the average farm-gate price of dry opium in 2014 was also reflected in a decrease in heroin prices both within Afghanistan and across its borders, though existing information does not show a major change in demand in the main opiate consuming countries. The prices of precursor substances requisite for heroin production increased, however, which was probably due to an increase in demand caused by the high levels of opium production.
- In the Southern region, the phenomenon of farmers migrating in order to transform the desert into arable land for opium cultivation appears to be coming to an end. This may be due to the combination of relatively low opium prices and yields deterring investment in, for example, irrigation. The overall opium cultivation situation stabilized in Hilmand as a whole, but outside the main Hilmand agricultural area the area under poppy cultivation decreased slightly in 2014. The "Food Zone" alternative livelihood programme in Hilmand province came to an end in 2012, and though significant differences could still be observed between the areas inside and outside the zone in 2014, opium cultivation was still relatively smaller inside the Food Zone than outside it.
- Traditionally the heartland of opium cultivation in Afghanistan, the Eastern region experienced a massive decrease in opium cultivation in recent years before undergoing a resurgence in opium cultivation in 2014. As farmers in that region have the highest household income in the country it is unlikely that this recent phenomenon is linked to socio-economic vulnerability, as is often the case in other regions, with specific local conditions in the region's provinces, such as Nangarhar, playing a more important role.
- The reasons why Afghan farmers cultivate opium are multiple. Some of these reasons are declared by farmers when questioned during the village survey, while the (undeclared) underlying reasons are gleaned from an in-depth risk assessment of opium poppy cultivation in Afghanistan, which resulted in the production of risk maps. The lucrative nature of the crop is the principal reason that the largest share of farmers offer as an explanation for their decision to cultivate opium poppy, but a much smaller proportion of opium farmers (44%) actually did so in 2014 than in 2013 (72%).
- While income from opium is undoubtedly an important factor in household decision making, risk maps show that the risk factors behind opium cultivation vary from region to region, with environmental suitability, socio-economic vulnerability and security/rule of law issues (as insecurity continues to be highly correlated with opium cultivation), and opium prices the principal factors.
- For example, in selected areas of Badakhshan, the role played by environmental conditions, particularly climate, in deterring farmers from cultivating opium have more of an impact than the socio-economic factors that can push farmers to cultivate opium.
- In selected areas of Nangarhar, where farmers have the highest household income in Afghanistan, there was a comparatively low risk of opium cultivation due to socio-economic vulnerability, yet there was still an increase in opium cultivation in 2014. This implies that other drivers play a role in opium cultivation in Nangarhar and that opium cultivation in the province requires more of a political response as opposed to purely development measures.
- While certain areas of the provinces of Farah and Balkh have similar levels of risk of opium cultivation, despite great variations in their levels of socio-economic vulnerability and environmental suitability, their respective outcomes in terms of opium cultivation are completely different: the area around Balkh is poppy-free; Farah is one of Afghanistan's main poppy-producing provinces.
- The frequency of opium diseases also has an effect on cultivation. The fear of plant disease continued to be a major factor in farmers ceasing opium cultivation in 2014 (14% of farmers interviewed), as in 2013 (12%), whereas only 1.2% of farmers reported that they ceased opium cultivation for that reason in 2012. This becomes even more apparent when looking at regional distribution: in the Southern region, which was heavily affected by disease and where yields were still below average in 2014, 42% of farmers cited disease as a reason for ceasing opium cultivation. By contrast, only 1% of farmers in the Central and North-eastern regions cited disease.
- The risk assessment showed that the reasons for cultivating opium are diverse and often specific to one particular area. This should be taken into consideration when designing intervention strategies such as alternative development programmes: something that works in one part of the country does not necessarily work in another part. From a policy perspective, a focus on the areas in which conditions are highly favourable to poppy cultivation is therefore appropriate.
2 Introduction
The Afghanistan Opium Survey is implemented annually by the Ministry of Counter Narcotics (MCN) of Afghanistan in collaboration with the United Nations Office on Drugs and Crime (UNODC). The survey team collects and analyses information on the location and extent of opium cultivation, potential opium production and the socio-economic situation in rural areas. Since 2005, MCN and UNODC have also been involved in the verification of opium eradication conducted by provincial governors and poppy-eradication forces. The results provide a detailed picture of the outcome of the current year's opium season and, together with data from previous years, enable the identification of medium- and long-term trends in the evolution of the illicit opium cultivation problem in Afghanistan. This information is essential for planning, implementing and monitoring the impact of measures required for tackling a problem that has serious implications for Afghanistan and the international community.
The opium survey is implemented within the technical framework of the UNODC Illicit Crop Monitoring Programme (ICMP). The objective of ICMP is to assist the international community in monitoring the extent and evolution of illicit crops in the context of the Plan of Action adopted by the United Nations (the 53rd session of the Commission on Narcotic Drugs in March 2009). Under ICMP, monitoring activities currently supported by UNODC also exist in other countries affected by illicit crop cultivation: in Asia, Myanmar and the Lao People's Democratic Republic; in Latin America, the Plurinational State of Bolivia, Colombia, Ecuador, Mexico and Peru; in Africa, Nigeria.
The Afghanistan Opium Survey 2014 was implemented under project AFG/F98, "Monitoring of Opium Production in Afghanistan", with financial contributions from the Governments of Germany, Norway, the United Kingdom of Great Britain and Northern Ireland, and the United States of America.
3 The opiate economy in Afghanistan: Overview
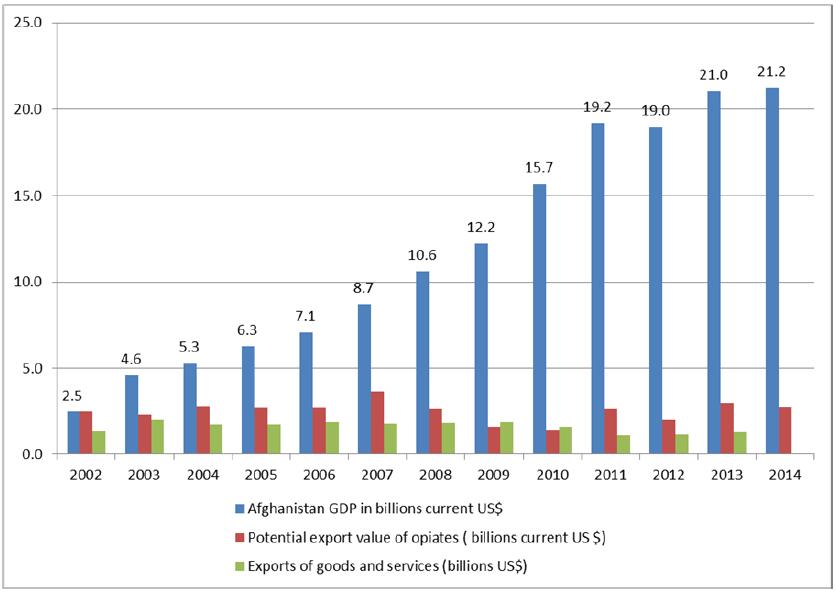
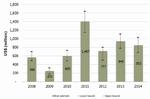
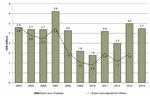
The size of Afghanistan's opiate economy is considerable. From 2003 to 2007 the potential gross value of the opiate economy, including revenues from heroin production and trafficking to the border, was equivalent to almost half of Afghanistan's total licit GDP. But from 2008 the share of GDP of illicit opiate revenues decreased steadily, from 41% to a low of 13% in 2014.
The decrease in the value of the opiate economy relative to licit GDP has been mainly due to the increase in licit GDP and not to a significant reduction in the production or cultivation of opium. At some 13% of GDP, the value of opiates still constitutes a considerable portion of Afghanistan's economy, and even considerably exceeds the value of the licit export of goods and services. It is therefore fair to say that opium remains one of Afghanistan's leading economic activities. It should be noted, however, that the majority of the proceeds of opium and opiate production probably leave the country (capital flight) and do not directly aid Afghanistan's economy as such.
The opiate economy
The potential gross value of the opiate economy is calculated by considering the income and costs related to opium poppy cultivation and beyond after opium leaves the farm and is processed into morphine or heroin and traded. Costs related to opium poppy cultivation include seeds, lancing, fertilizers, pump irrigation and labour. Often farmers do not account for the costs of family labour, even though these are fixed costs related to the livelihood of family members. Farmers also report the existence of outstanding loans related to production and investment needs, but also to food, clothing, medical costs and marriage. Once opium leaves the farm, income is generated by the sale of opiates (opium, morphine and heroin] on the domestic market and by their trade across Afghanistan's borders. However, income generated by trafficking beyond Afghanistan borders is not accounted for and income generated by trafficking to destinations such as Europe rarely finds its way into the Afghan economy. Additional costs exist in relation to heroin and morphine production, for which precursors have to be imported.
While the relative decrease in the value of the opiate economy to GDP may indicate that Afghanistan's economy has become less and less dependent on income from opium, at the farmer level in many rural communities, dependency on the opiate economy is still high. In Hilmand province, for example, opium accounted for almost 30% of the total area of agricultural land in 2014.
Figure 1: Afghanistan GDP, potential export value of opiates and value of Afghan exports of goods and services (US dollars (billions))
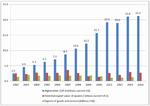
Click to enlargeSource: Afghanistan Central Statistical Office; UNODC/MCN Afghanistan opium surveys.
The farm-gate value of opium is an important measure of the added value generated in rural communities by the cultivation and harvesting of opium. In contrast to the proceeds of onward processing and trafficking, which benefit external individuals, the proceeds of opium cultivation most likely remain within rural communities: opium poppy cultivation is labour intensive, lancers (workers harvesting opium) earn considerable amounts of money when compared to earnings from other – licit – activities (see table 11). Moreover, opium cultivation provides employment: an estimated 376,000 full-time equivalent jobs were created by opium production in Afghanistan in 2013. |9|
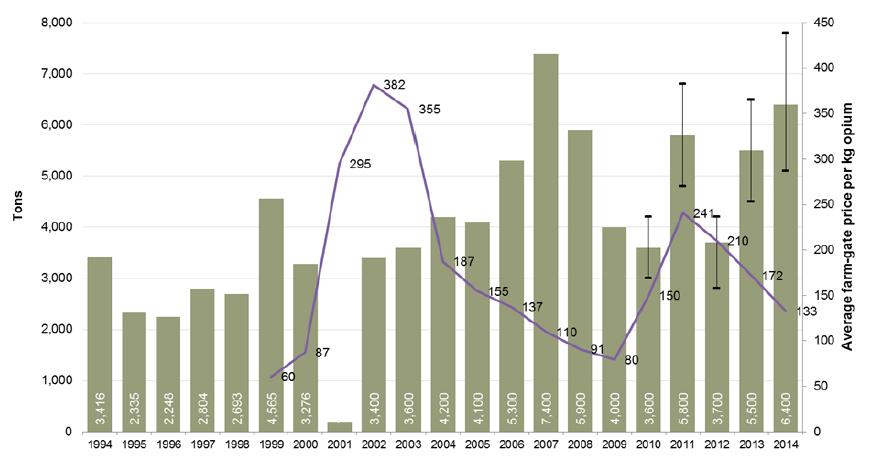
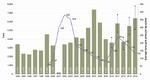
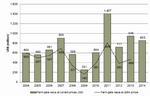
The farm-gate value of opium has presented erratic patterns in recent years. The production of opium, like any other agricultural product, is highly dependent on meteorological and climatic conditions. Furthermore, with opium prices being subject to strong market dynamics, particularly supply shocks and price hikes, as in 2002 (Taliban opium ban) and 2011 (crop failure in 2010), due to perceived or real shortages, spikes in the farm-gate value of opium were caused in those years.
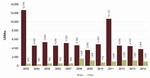
When looking at figure 2, which shows opium production as well as the average farm-gate price of opium, it becomes apparent that, in the long run, opium prices and production have a negative relationship with each other: the higher the level of production, the lower the price. This relationship is strongest |10| when comparing opium production in one year with prices in the next, which implies that prices react to production in the previous year and shows that the Afghanistan opium market presents the characteristics of a competitive market, meaning that prices do not seem to be driven by cartels or other forms of monopoly.
Figure 2: Average nominal farm-gate prices of dry opium in US dollars (purple line) together with annual opium production (green bars)
Click to enlargeIn 2014, the total farm-gate value of opium in Afghanistan was equivalent to roughly 4% of GDP. The financial benefits of illicit crops are an important aspect of household decision making. In spite of substantial fluctuations due to global market rates, per-hectare income from opium in the past five years has ranged from US$ 3,800 (2014) to US$ 10,700 (2011). Farmers typically grow poppy on less than 0.2 hectares of land (jerib) and can earn annual gross incomes of about US$ 800 to US$ 2,000, which, on average, constitutes a third of poppy-growing farmers' incomes.
Opium poppy is thus an attractive cash crop. Incomes from opium poppy have always been more than three times the size of those generated from wheat production, and, in the case of years with very high opium yields and prices, such as 2011, almost ten times the size. In 2014, the ratio of gross income per hectare of wheat to opium poppy was 1:4 and the ratio of net income was 1:6 (see section 5.1.2 on the comparison of income from opium and wheat).
However, it should be noted that while this comparison provides an order of magnitude of the profitability of opium poppy cultivation, it may be misleading when discussing alternatives: wheat is a staple crop not a cash crop, is often cultivated for own consumption and may therefore not be a suitable substitute for opium poppy. The Afghanistan Drug Report 2012 |11| cites, for example, tomatoes, potatoes and saffron as generating similar per-hectare gross incomes to opium poppy. How far these crops are actually viable alternatives depends, of course, on local conditions, as well as the production costs related to their cultivation.
4 The 2014 opiate economy in Afghanistan
Opium prices decreased in all regions of Afghanistan in 2014, making it the third year to show a decreasing trend since the price hike caused by the poppy disease of 2010.
MCN/UNODC has monitored opium prices in selected provinces of Afghanistan on a monthly basis since 1994 (18 provinces as of September 2011). In 2008/2009, opium prices were at a low level but increased after that, most noticeably in the Eastern, Southern and Western regions, before reaching a maximum in 2011 after the unusually poor harvest caused by the above-mentioned poppy disease.
In 2011, opium prices started to decrease around harvest time in some regions, but remained volatile and at a higher level than in any year since 2005 (in absolute terms, not adjusted for inflation). This decrease can be explained by the relatively good 2011 harvest, since when reported opium prices have shown a decreasing trend in all regions, with an overall decrease of 23% between 2013 July and July 2014. Dry opium prices reported by traders also showed a decreasing trend in all regions of the country, though at 5% the overall decrease was smaller than the one reported by farmers.
Table 1: Regional farm-gate prices of dry opium at harvest time, reported by farmers through the price-monitoring system, 2013-2014 (US dollars per kilogram)
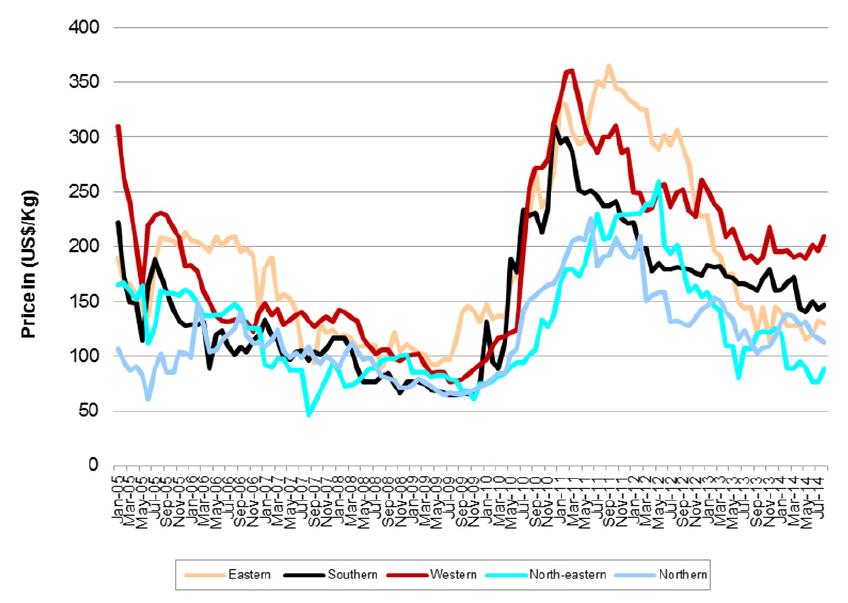
Region Average dry opium price (US$/kg) 2013 Average dry opium Price (US$/kg) 2014 Change 2013-2014 (%) Central 221 142 -36% Eastern 171 113 -34% North-eastern 89 60 -33% Northern 109 112 3% Southern 161 129 -20% Western 209 178 -15% National average weighted by production* 172 133 -23% Figure 3: Regional average price of dry opium reported by traders, January 2005-June 2014 (US dollars per kilogram)
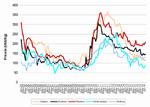
Click to enlargeSource: MCN/UNODC Monthly Price Monitoring System.
Table 2: Prices of dry opium reported by traders, by region, August 2013-August 2014 (US dollars per kilogram)
Region Regional average price (US$/kg) August 2013 Regional average price (US$/kg) August 2014 Change 2013-2014 (%) Trader Trader Eastern region (Kunar, Laghman, Nangarhar) 145 129 -11% Southern region (Hilmand, Kandahar) 163 146 -10% Western region (Badghis, Farah, Ghor, Hirat, Nimroz) 192 210 9% North-eastern region (Badakhshan, Kunduz, Takhar) 107 89 -17% Northern region (Balkh, Faryab, Kunduz) 112 112 0% Average 144 137 -5% 4.1.1 Farm-gate prices of dry opium adjusted for inflation
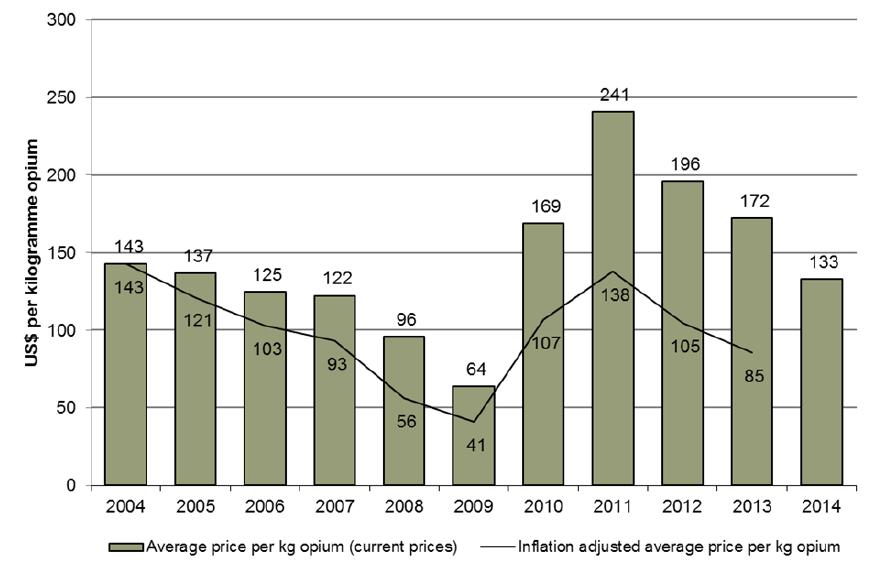
Figure 4 shows the average farm-gate price in US dollars (weighted by production) of 1 kilogram of opium for the years 2004 to 2014, together with prices adjusted for inflation. If the value of the Afghan afghani (AFN) had remained constant, opium production in 2004 would have been most lucrative (relative to price level) in the years considered. |12| Furthermore, the real loss in value of 1 kilogram of opium between 2004 and 2009 was more drastic than when counted in current prices, while the price hike that started in 2010 seems to be relatively lower than before.
If the value of the AFN had been constant over time (and all other things being equal), the farm-gate value of 1 kilogram of opium in 2013 would have had roughly the same purchasing power as in 2007.
No estimates of the inflation rate were available for 2014. However, a further reduction in the inflation-adjusted price was to be expected.
Figure 4: Average nominal (current) farm-gate prices of dry opium (US dollars: green bars) and prices adjusted for inflation (constant prices adjusted to 2004 price: line)
Click to enlargeNote: for ease of comparison, the Afghanistan inflation rate has been applied to US$ farm-gate values. Changes in the exchange rates can alter the results (see Afghanistan Opium Survey 2013 for details).
4.2 Farm-gate value of opium production and income from opium
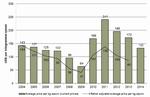
4.2.1 Farm-gate value of opium production decreased in spite of increased production
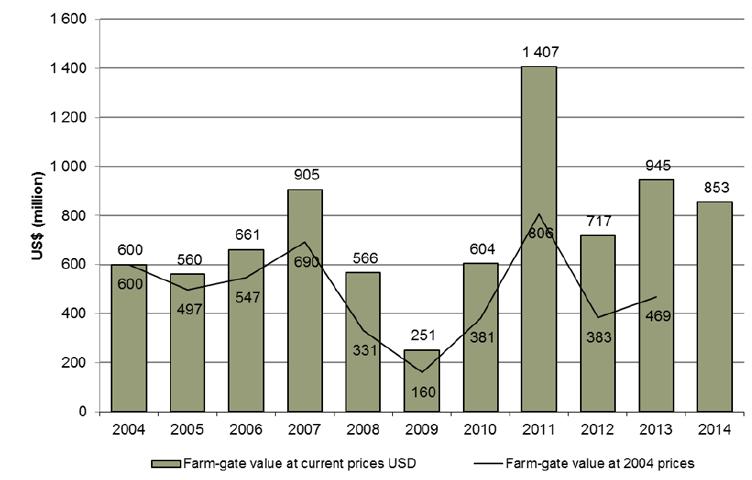
Amounting to US$ 853 million (US$ 680-1,030 million), the farm-gate value of opium production in 2014 decreased by 10% from its 2013 level. The decrease in farm-gate value was mainly due to the 23% decrease in the farm-gate price of dry opium.
Farmers in Hilmand, the country's largest opium-producing province, earned some US$ 394 million, which was equivalent to 46% of the total farm-gate value of opium production in Afghanistan in 2014 (US$ 853); a decrease of 13% from the 2013 total (US$ 945 million).
Figure 5: Farm-gate value of opium production in Afghanistan (current price), 2008-2014 (US dollars per kilogram)
Click to enlargeFigures for 2008 and 2009 were recalculated from the revised opium production estimates; see MCN/UNODC Afghanistan Opium Survey 2012. Ranges were calculated proportionally to the previously published estimate.
4.2.2 Farm-gate value of opium and inflation
The farm-gate value of opium represents the potential gross amount earned from opium by farmers in a given year. Figure 6 shows the nominal farm-gate value in US dollars (current price) together with values adjusted for inflation (constant price: black line). In 2004, both numbers were identical as that year is the base line.
Figure 6: Nominal (current price) farm-gate value in US dollars (millions: bars), together with the farm-gate value adjusted for inflation (constant price adjusted to 2004 price: line) in US dollars, 2004 to 2013.
Click to enlargeNote: for ease of comparison, the Afghanistan inflation rate has been applied to US dollar prices. Changes in the exchange rates can alter the results (see Afghanistan Opium Survey 2013 for details).
4.3 Potential value of the 2014 opiate economy in Afghanistan
The value of production and export of opium and heroin/morphine is the equivalent of a sizeable share of Afghan GDP. By far the largest share of income is generated by opiate transformation and exports to neighbouring countries, but there is also a domestic market for opium and heroin/morphine.
This section provides estimates of the potential income generated by the opium and its derivatives produced in Afghanistan in 2014. Unlike farm-gate value, potential value also includes all income generated after opium leaves the farm. Income is generated whenever opium is traded or modified in some way and includes income generated by opiates (opium, morphine and heroin) consumed domestically, as well as income generated by trading opiates to Afghanistan's borders.
The value of exported opiates only includes the value of opiates traded across Afghanistan's borders. No further income from onward trafficking beyond the country's borders, for example, to Europe and other regions, is included. Indeed, Afghan traffickers seem to be heavily involved in shipping opiates over the border, most notably to Iran and Pakistan, but much less so in subsequent trafficking. Thus, the far greater income generated on international trafficking routes does not normally find its way into the pockets of Afghan traffickers and into the Afghan economy.
It should be stressed that despite ongoing attempts to improve estimates of the opiate economy through additional information-gathering activities, economic calculations remain far less robust than estimates of the area under cultivation, opium yield and opium production. The calculations presented here are intended to provide reasonable orders of magnitude of the income generated rather than exact amounts.
4.3.1 Potential gross and net value of 2014 opium production
In 2014, the gross value of the Afghan opiate economy was estimated to be US$ 2.84 billion (US$ 3.1 billion in 2013). This value represents all income generated by the opium production that is believed to have remained in Afghanistan, and is the sum of the value of the domestic market and the value of opiates available for export. Its net value (US$ 2.7 billion) is considered to be most suitable for comparison with GDP, and is the gross value minus expenditures for imported precursor substances.
The gross export value of opium plus heroin/morphine exports in 2014 was US$ 2.74 billion. The gross value of the domestic market for heroin and opium was, however, much smaller. In 2014, the estimated worth of opiates consumed in Afghanistan was US$ 0.1 billion, which was slightly lower than in 2013 (US$ 0.12 billion). This difference is due to a decrease in prices with the same underlying domestic demand for opiates.
It should be noted that the wholesale and retail prices of opiates are approximates and not purity adjusted. There are large disparities in reported prices, which may stem from differences in the quality of opiates purchased. Indeed, calculating the value of exported morphine/heroin is limited by the fact that the product leaving laboratories in Afghanistan may undergo further processing (for example, adulteration) before reaching assumed points of sale in neighbouring countries. There are indications that heroin is already mixed with cutting agents in Afghanistan, which is done to increase profitability as well, perhaps, as for other reasons such as tailoring the product for specific types of usage. These factors cannot be estimated at present, but it is reasonable to assume that the use of cutting agents increases the profitability of exporting heroin/morphine, and not taking such factors into account could lead to an underestimation of the export value of the opium economy in Afghanistan.
4.3.2 Value of 2014 opium production and GDP
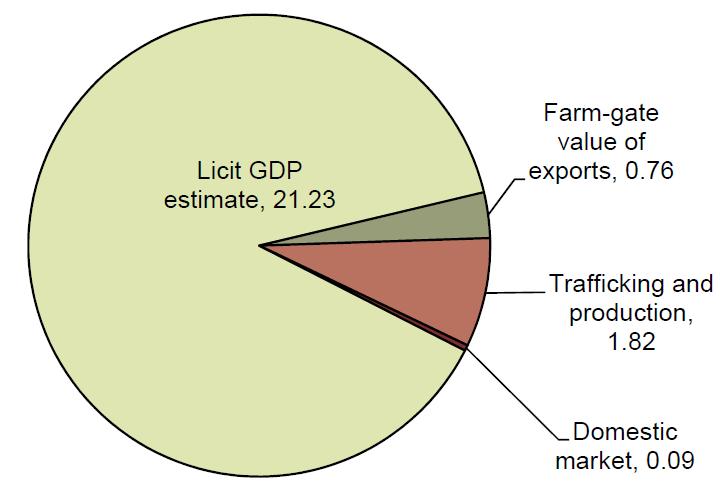
When comparing the above-mentioned gross and net values with the 2014 GDP of Afghanistan, which was US$ 21.2 billion, |13| the magnitude of the Afghan opium economy becomes apparent. In 2014, net opium exports were worth about 13% of GDP and the farm-gate value of the opium needed to produce those exports alone was equivalent to 4% of GDP. The net value of the domestic market for opiates is small by comparison, but still worth approximately 0.4% of GDP.
The net export value of Afghan opiates (US$ 2.59 billion) consists of the farm-gate value of the opiates believed to be exported (0.76 billion) and the value added by traffickers through the processing of opium into morphine/heroin, and the export of processed and unprocessed opiates. This was estimated to be US$ 1.82 billion in 2013.
Figure 7: GDP and net value of the opiate economy in Afghanistan, 2014 (US dollars (billions))
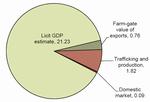
Click to enlargeNote: "Farm-gate value" refers to the farm-gate value of the opium needed for producing exports. "Trafficking and production value" represents the value generated by opium between farm-gate and borders minus costs for imported precursors. "Domestic market" is the net value of the domestic opiates market. Sources: Afghanistan Central Statistical Office and MCN/UNODC 2013.
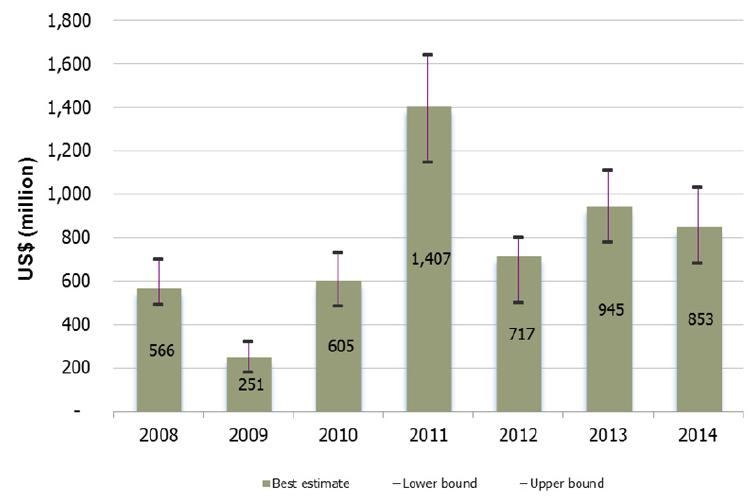
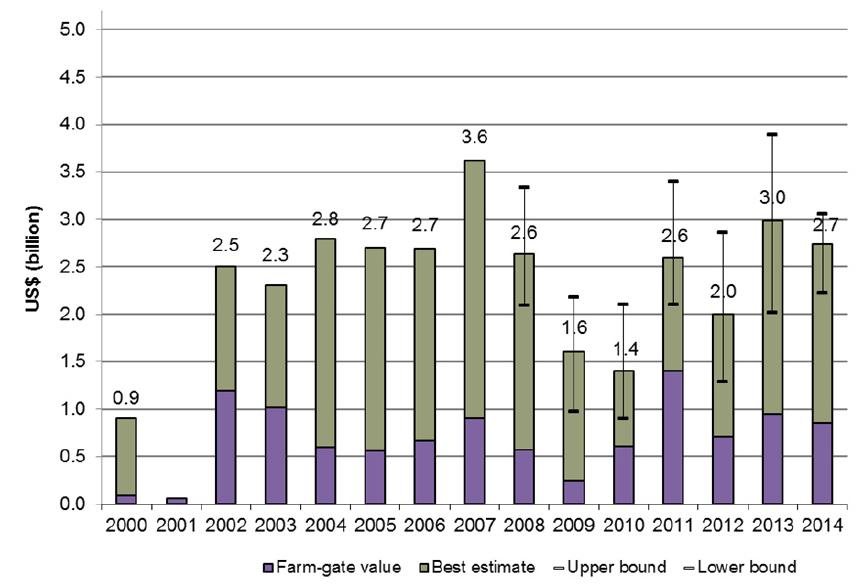
Figure 8: Potential gross export value of opiate production, and farm-gate value, 2000-2014 (US dollars)
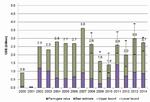
Click to enlargeSources: UNODC (2003): The Opium Economy in Afghanistan; MCN/UNODC: Afghanistan opium surveys 20032013. Note: The bars indicate the upper and lower margins of the range of the estimated value. Values for 2006 to 2009 have been revised, see Afghanistan Opium Survey 2012.
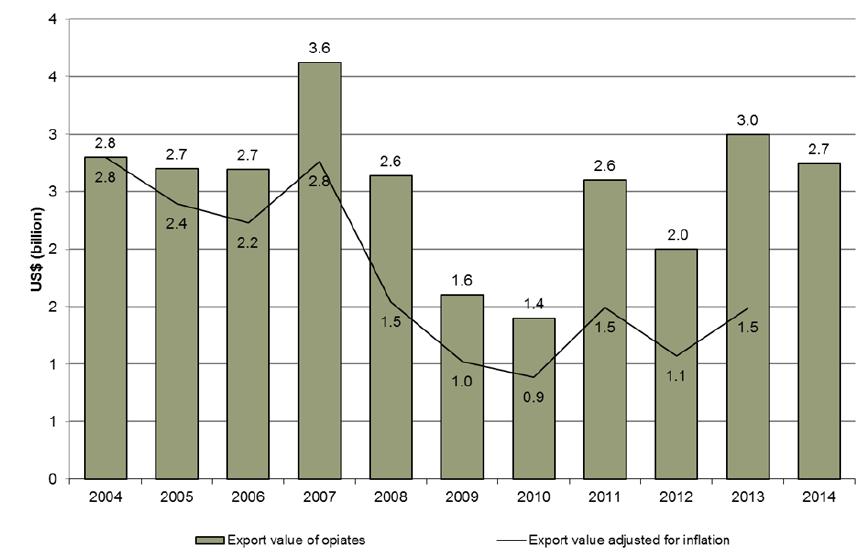
4.3.3 Value of the opiate economy adjusted for inflation
The gross export value of opiates is the value of all opiates destined for export (estimates of shares of heroin/morphine and unprocessed opium are based on seizure data), whereas the net value is the gross value minus all costs for imports needed to produce opiates (only precursor costs).
The gross value of all opiates destined for export presented a stable trend between 2004 and 2008 (with the exception of 2007). The low prices in 2009 and the poor harvest in 2010 and 2012 led to a further reduction. However, the relatively high level of production in 2011 led to a relatively lucrative year, with a gross export value comparable to that of 2008. But when looking at value adjusted for inflation, the picture is different: due to high rates of inflation, the highest export value adjusted for inflation was in 2004, after which export value started to decline, except for in 2007 when it reached the 2004 level. From 2008 on, the overall level of the adjusted export value decreased drastically to less than a third of its 2004 value in 2010. In 2011, the export value adjusted for inflation increased to its 2008 level and seemed to remain somewhat stable in the two subsequent years.
However, little is known about the way transactions are made during high-level trafficking. Whether or not inflation-adjusted values actually represent a change in the real income made from opiates depends on many factors, the most important being the currency in which high-volume trafficking transactions are made. Indeed, when it comes to reflecting income derived from opium, farm-gate value seems to be the better indicator.
Figure 9: Nominal gross export value of opiates (US dollars: bars), together with the gross export value of opiates adjusted for inflation (US dollars: line), 2004 to 2014
Click to enlargeNote: for ease of comparison, the Afghanistan inflation rate has been applied to US dollar prices. Changes in the exchange rates can alter the results (see Afghanistan Opium Survey 2013 for details).
4.3.4 Costs and revenues of heroin and morphine production
Net export value (and the net value of the domestic market) accounts for import costs associated with the production of morphine and heroin. It therefore provides a proxy for the net amount of revenue entering Afghanistan generated by opiate exports.
Import costs, as far as they are known, are deducted from the gross export value of Afghan opiates. However, since many import cost factors are not well understood or known, net value only considers the costs of imported precursors that constitute an important cost element of morphine and heroin production.
The main (imported) precursor in terms of cost is acetic anhydride, which converts morphine base into brown heroin base. Acetic anhydride is a controlled substance for which there is no known licit use in Afghanistan, nor known licit production.
The net export value is calculated by:
- multiplying the cost of acetic anhydride per kilogram of heroin by the total amount of exported heroin potentially exported;
- subtracting the total cost of acetic anhydride from gross export value. Other import costs were not considered.
Table 3: Prices (rounded) and approximate amounts of acetic anhydride needed for the production of 1 kilogram of heroin, 2014
Precursors Price (US$/unit) Amount needed/kg heroin Costs per kg of heroin (US$) Acetic anhydride (litre) 274 1.5 l |14|
(0.77-4.0)411
(211-1096)Like the farm-gate price, the average cross-border price of opium (US$ 387) decreased in 2014 from its 2013 level (US$ 437). The same holds in the case of heroin: the average cross-border price of 1 kilogram of heroin was US$ 5,110 in 2014, which was a further decrease from 2013 (US$ 5,900). Prices for acetic anhydride, however, increased from US$ 221/unit in 2013 to US$ 274/unit in 2014.
Table 4: Overview of different values/revenues per kilogram of opium/heroin (rounded), 2010-2014 (US dollars)
2010 2011 2012 2013 2014 |15| Export price per kilogram of heroin in US$ 3,300 4,500 6,800 5,900 5,110 Export price per kilogram of opium in US$ 360 400 425 437 390 Farm-gate price per kilogram of opium in US$ 170 240 196 172 133 Cost per kilogram of heroin in US$ (precursor and dry opium) 1,600 2,400 1,700 1,530 1,690 Revenue from exporting 1 kilogram of opium in US$ 190 160 230 265 300 Revenue from exporting 1 kilogram of heroin/morphine in US$ 1,600 2,100 5,100 4,380 3,400 Revenue from 7/9.6 kilograms of opium in US$ (rounded)* 1,300 1,100 1,700 1,900 2,400 Financial profit from exporting heroin instead of opium (rounded) 300 1,000 3,400 2,500 1,000 *Note: Costs other than the farm-gate price or precursor costs are not considered. Values before 2014 were calculated with an opium to heroin conversion ratio of 7:1; values in 2014 were calculated with the updated ratio of 9.6:1.
The first two lines of the above table present export prices of opium and heroin at the Afghan border. The third line presents the rounded average price per kilogram of opium at the farm-gate. The fourth line presents precursor and opium costs for producing 1 kilogram of heroin by using the amounts presented above. The last line then gives the extended net gain per unit exported.
Heroin revenue is not the net revenue of traffickers, but rather the value generated per kilogram of heroin along production and trafficking chains beginning at the farm-gate. From the difference, all production costs (including laboratories, labour, trader mark-ups, etc.) other than for precursor substances have to be financed.
The mechanisms driving these prices are not well understood. Many questions remain regarding the number of intermediate traders, production costs for heroin/morphine other than from imported precursor substances, and, most importantly, the quality of the heroin exported. As these estimates are based on pure heroin, one explanation for the attraction of exporting heroin is that the heroin exported is of low quality.
5 Household economy
5.1.1 Per-hectare income from opium
As the farm-gate price of opium decreased in 2014, the average per-hectare gross income from opium cultivation in Afghanistan also decreased to US$ 3,800, a 16% decrease from 2013 (US$ 4,500).
Net income is derived by subtracting production costs from gross income. Production costs per hectare, reported by farmers, amounted to US$ 860 in 2014, which can be considered stable when compared to the 2013 level (US$ 900). The main cost factors in opium expenditure are lancing (41%) and fertilizing (28%).
Variations in net income are mainly caused by variations in gross income, which are heavily driven by per-kilogram prices of dry opium and yield: in 2014, farmers reported average expenditure corresponding to 23% of gross income; whereas it was 21% in 2013 and 28% of gross income in 2012. Only in 2011, a year with high yields and high opium prices, was the share much smaller, at 13%.
These calculations represent an average value per hectare under poppy cultivation. Farmers whose fields were affected by diseases or adverse weather conditions may have made very little income, perhaps not even recovering production costs, while others whose fields were unaffected would have made a good profit.
Table 5: Gross and net income per hectare, 2011-2014 (US dollars per hectare)
2011
(US$/ha)2012
(US$/ha)2013
(US$/ha)2014
(US$/ha)Gross income per hectare of opium 10,700 4,600 4,500 3,800 Net income per hectare 9,300 3,300 3,600 2,900 Production costs (rounded) 1,390 1,300 900 860 Expenditure as share of gross income 13% 28% 21% 23% Some caveats should be added, however. Average production costs for opium do not necessarily apply to small-scale farmers who typically cultivate 1 jerib (= 0.2 hectares) or less in Afghanistan. They can make use of the "free" labour of their household members for ploughing and weeding the fields as well as for lancing and collecting opium. In some provinces, notably those with a strong insurgent presence, some or all farmers reported paying an opium tax, which further reduces their net income. This was not considered in this calculation of net income as it does not apply to all poppy farmers. The expenditure for opium cultivation may also be higher if farmers rely exclusively on pump irrigation.
5.1.2 Comparison of income from opium and from wheat
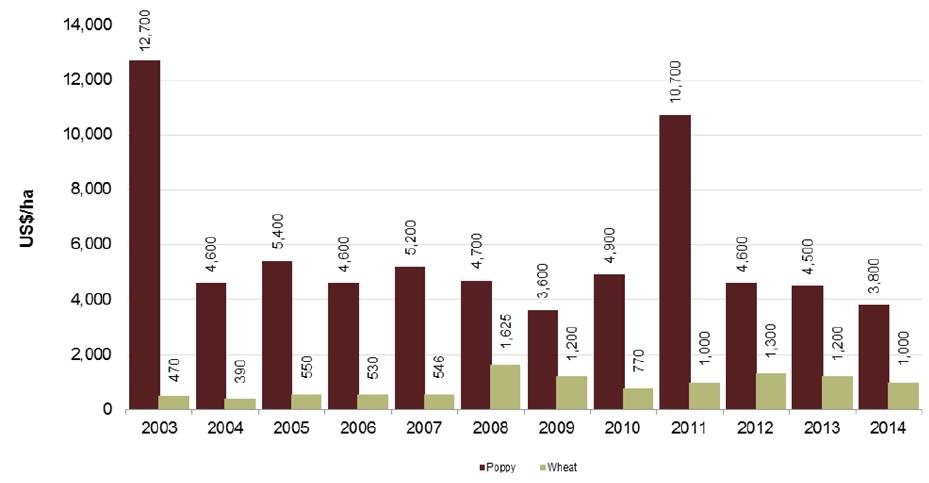
Opium remains an attractive alternative to other crops and the comparison of the per-hectare income from wheat and opium poppy is an indicator of just how attractive poppy cultivation can be. Opium poppy and wheat are planted during the same season in Afghanistan and, as most poppy is grown on irrigated land, wheat yield on irrigated land is used to make the comparison. However, it should be noted that while this comparison provides an order of magnitude of the profitability of opium poppy cultivation, it may be misleading when discussing alternatives: wheat is a staple crop not a cash crop and is therefore often cultivated for personal consumption, so may not be a suitable substitute for opium poppy.
In 2014, at roughly 4:1, the ratio between gross income from opium and wheat was similar to its 2013 level, the highest ratio calculated since 2008. The price of wheat increased slightly after 2008 while the price of opium increased significantly, but the ratio was still much lower than prior to 2008. In 2003, for example, farmers earned 27 times more gross income per hectare of opium than per hectare of wheat.
The estimated per-hectare income from wheat was based on information provided by village headmen about wheat yield and price. The wheat price reported reflects the price level and expectations at the time of the survey (April/May 2014). The average reported wheat yield was 2,600 kilograms per hectare on irrigated land and farmers made an estimated average gross income of US$ 1,000 per hectare from wheat (the average price per kilogram of wheat was US$ 0.39). |16|
Farmers were asked about their average expenditure per hectare under cultivation for the following activities: fertilizer, harvesting, irrigation, ploughing, seeds and weeding (see table 6, which compares average expenditure per hectare of poppy and wheat).
Average costs of wheat production per hectare were estimated to be US$ 504 in 2014, which was slightly lower than in 2013 (US$ 556). The ratio of net income from opium (US$ 3,600) to that of wheat (US$ 514) was again roughly 6:1 |17| However, the income comparison presented here does not take into account income from the by-products of opium and wheat cultivation, such as poppy seed and wheat straw. According to field observations, wheat straw can provide considerable additional income to farmers and thus reduce the difference between opium and wheat income per hectare.
Table 6: Average expenditure on poppy and wheat, per hectare, 2014 (US dollars per hectare)
Costs per hectare Fertilizer Harvesting/ Lancing Irrigation Ploughing Seeds Weeding Total costs Wheat (US$/ha) 162 175 92 82 64 68 504 Poppy (US$/ha) 242 132 352 81 13 149 859 Note: Average over all expenditures named by farmers for each category. Zero expenditure is excluded.
Figure 10: Gross income per hectare from opium and wheat, 2003-2014 (US dollars per hectare)
Click to enlarge5.2 Household income, outstanding loans and daily wages
5.2.1 Income and distribution of income sources of farming households
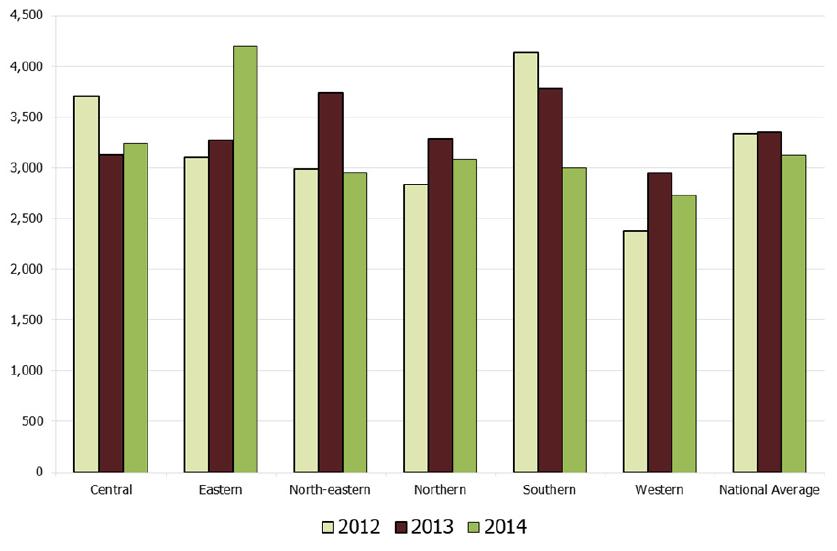
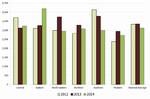
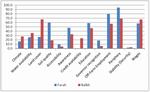
In 2014, Afghan farmers of all types reported an average annual income of US$ 3,100 for the year 2013. The distribution by region shows that the highest average income was earned in the Eastern region, followed by the Central region. The lowest average income was earned in the Western region.
With the exception of the Eastern region, which observed a strong increase in average annual income, overall annual income between 2012 and 2013, as reported by farmers, actually decreased (-6%). The reduction was most pronounced in the Southern region (-21%), corresponding to the decrease in opium prices in the previous two years, though, interestingly, the Southern region actually had the highest annual income in those two years.
The values presented here are reported income, which is difficult to measure. A further complication is that annual income is reported in three different currencies (Afghan Afghani, Pakistani rupee, Iranian riyal), depending on the region of Afghanistan. All values are converted to dollars and it cannot be excluded that year-on-year variations in exchange rates influence the trends observed here. For this reason, the data presented here should be taken as indications of trends and patterns, rather than absolute values.
Table 7: Average annual income of all farmers, by region, 2011 to 2013 (reported in 2012, 2013 and 2014)
REGION Annual income 2011 Annual income 2012 Annual income 2013 Central 3,700 3,100 3,200 Eastern 3,100 3,300 4,200 North-eastern 3,000 3,700 3,000 Northern 2,800 3,300 3,100 Southern 4,100 3,800 3,000 Western 2,400 2,900 2,700 Grand total 3,300 3,300 3,100 Figure 11: Average annual income of all farmers, by region, 2011 to 2013 (reported in 2012, 2013 and 2014)
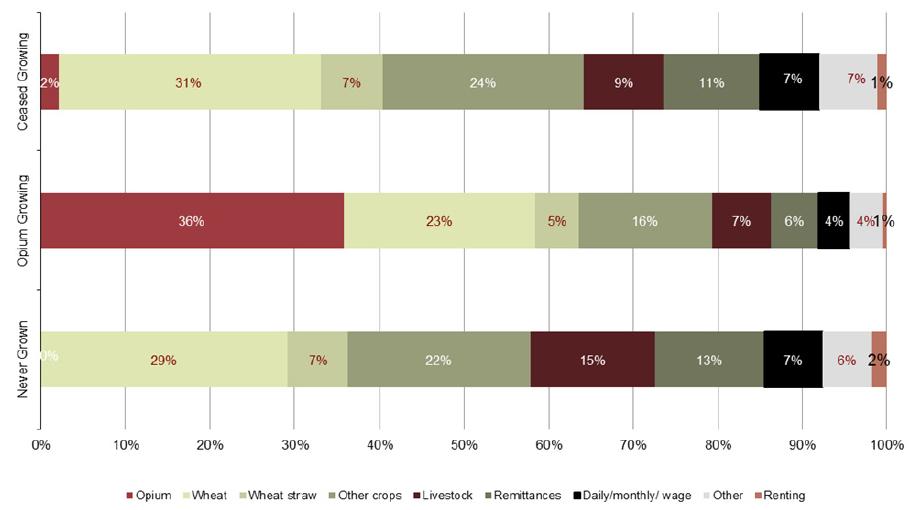
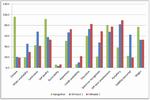
Click to enlargeWhile wheat remained the most important source of income (29% on average), followed by other crops (21%), livestock (13%), income received from abroad (remittances: 12%) and poppy (5%). A regional breakdown shows clear variations in the distribution of income sources. In the Southern region, farmers reported that an average of 12% of their income came from opium poppy cultivation; the highest proportion in the country. In the Eastern and Western regions, two important poppy-cultivating regions, poppy made up 7% of income, while in the Central, Northeastern and Northern regions, it was only 1%, 1% and 2%, respectively.
Table 8: Sources of 2013 income for all farmers, by region (reported in 2014)
REGION Daily/monthly/ wage Livestock Other Other crops Poppy Remittances Renting Wheat Wheat straw Central 8% 15% 10% 19% 1% 21% 3% 17% 7% Eastern 16% 10% 1% 22% 7% 15% 1% 19% 7% Northeastern 3% 22% 5% 20% 1% 5% 1% 35% 9% Northern 9% 11% 3% 19% 2% 12% 1% 34% 8% Southern 2% 10% 9% 30% 12% 4% 1% 28% 6% Western 2% 10% 2% 16% 7% 9% 2% 46% 6% Grand total 6% 13% 6 21 5 12 1 29 7% Opium is a cash crop in Afghanistan and while it is interesting to understand the economic importance of opium at the household level, it is also important to understand which other sources of cash income rural households generate in addition, or as an alternative, to opium cultivation. The opium village survey investigates those two issues by looking at differences in the income patterns of rural households and the relative importance of different income sources. The survey is designed to investigate general differences between opium-growing and non-opium-growing households, but it cannot explain how successful or unsuccessful specific income strategies are. Nor can the data shed light on the relationship between opium cultivation and income, or explain whether it is opium cultivation that makes farmers relatively wealthy or it is the relatively wealthy farmers who go into opium cultivation.
On average, poppy-growing households in Afghanistan have had a higher cash income than households that do not grow poppy. Indeed, it can be noted that in 2013 farmers involved in opium cultivation had, on average, a higher income level than farmers who had ceased growing opium or had never grown opium. In the Eastern region, however, the pattern was different as opium-growing farmers had smaller household incomes than those who had ceased growing, or had never grown, opium. This confirms the findings of the risk maps for opium cultivation in chapter 6.3 of this survey, which show that opium cultivation in Nangarhar province in the Eastern region is not driven by socio-economic vulnerability.
Table 9: Reported average 2012 |18| and 2013 annual household income, by region and by opium-growing status (data collected in 2012 and 2013, respectively)
Opium-growing farmers (US$) Farmers ceased growing opium (US$) Farmers never grown opium (US$) REGION/ YEAR 2013 2013 2012 2013 2012 2013 Central 3,860 3,479 3,030 3,397 3,110 3,214 Eastern 3,540 3,873 3,310 4,242 3,080 4,378 North-eastern 3,040 NA 3,970 2,089 3,770 3,058 Northern 4,650 4,091 5,120 3,535 2,820 2,904 Southern 4,230 3,640 3,920 2,848 3,390 2,762 Western 3,420 2,990 3,370 2,881 2,690 2,616 National 3,920 3,414 3,760 3,151 3,120 3,027 Income of opium farmers in the North-eastern regions was not analysed because of a low number of opium-growing villages in the sample.
The main difference between opium-growing and non-opium-growing households remains the composition of the cash component. While opium-growing households have little cash income from sources other than opium, non-opium-growing households rely heavily on wage labour and remittances. A possible explanation for the low importance of wage labour for opium-growing households could be a trade-off between wage labour and opium: labour-intense opium cultivation may already absorb considerable manpower, which is then no longer available for wage labour.
Figure 12: Proportion of different 2013 income sources, |19| by type of farmer (data collected in 2014)
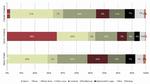
Click to enlargeThe relatively high importance of remittances for households that had ceased opium cultivation (11%), and an even higher one for those that had never grown opium (13%) is striking. This may indicate that suitable alternative cash income sources to opium cultivation are still not sufficiently available within the country as a whole, let alone close to home, and/or that, as remittances are more important for non-poppy-growing households, migration is effectively an alternative to opium cultivation.
5.2.2 Outstanding loans
Understanding the financial status of farmers can shed light on their reasons for cultivating opium and the dynamics of opium cultivation in Afghanistan. To that end, as part of the annual village survey, farmers were asked if they had any outstanding loans.
In 2014, 33% of farmers reported having outstanding loans, the same percentage as in 2013. While the average |20| size of those loans also remained stable (US$ 981 in 2014; US$ 957 in 2013) there was a 28% increase in the average size of loan (from US$ 837 in 2013 to US$ 1,070) among opium poppy-growing households.
Table 10: Average size of outstanding loans in US dollars per household and percentage of farmers with a loan, 2010-2014
2010 2011 2012 2013 2014 Loan % Loan % Loan % Loan % Loan % Opium-growing farmers 1,029 31% 976 41% 1,298 18% 837 29% 1,070 27% Farmers who ceased growing opium 1,053 41% 1,097 43% 935 37% 957 39% 878 26% Farmers never grown opium 1,043 41% 1,097 41% 1,145 40% 928 32% 1,004 36% All farmers 1,046 41% 1,085 41% 1,106 37% 957 33% 981 33% 5.2.3 Daily wage rates in rural communities
Extra labour is needed for opium lancing. Under normal conditions, three people can harvest (lance) 1 jerib (0.2 hectares) of opium poppy in 21 days. If all harvesting had taken place at the same time, a total of 3.3 million person-days would have been needed to reap the entire 2014 opium harvest in Afghanistan.
In 2014, although the country experienced an overall decrease in daily labour wages in US dollar terms in comparison to their 2013 levels, the daily wage for opium lancing/gum collection remained higher than other daily wages. Average daily wages for lancing and wheat harvesting decreased to US$ 9.4 and US$ 5.6 per day in 2014, from US$ 9.8 and US$ 5.9, respectively, in 2013.
Local wages were reported in a number of different currencies, including AFN, Pakistani rupees and Iranian rials, which complicates any year-on-year comparison as exchange rates can be subject to significant variations.
Table 11: Daily wage rates for different activities in Afghanistan, 2010-2014
Activity Daily wage rate (US dollars) Change 2013-2014 2010 2011 2012 2013 2014 Labour (roads, construction, etc.) 4.7 5.6 5.7 5.6 5.4 -5% Lancing/gum collection 9.3 12.6 11.7 9.8 9.4 -4% Poppy weeding 5.4 6.6 5.7 6.2 5.7 -9% Wheat harvesting 5.4 6.6 6.4 5.9 5.6 -4% 6 Reasons for cultivating opium poppy
Opium poppy cultivation, like the cultivation of illicit crops in general, is driven by a large number of factors. Over the years the UNODC/MCN Afghanistan opium surveys and several other research studies have researched drivers and related factors in order to inform decision makers on designing appropriate intervention strategies. |21|
Reasons for cultivating were are declared by farmers during the village survey when headmen and farmers in some 1,500 villages in all the Afghan provinces are interviewed. The resulting data set is very rich and it can be geographically evaluated as the exact locations of all villages are known. Other (undeclared) reasons were gleaned from an in-depth risk assessment of opium poppy cultivation in Afghanistan carried out by UNODC/MCN in collaboration with the University of Salzburg, Austria, which led to the production of risk maps that analyse selected areas in certain provinces of Afghanistan.
6.1 Reasons for cultivating opium poppy declared by farmers
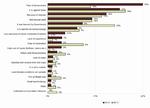
The reduction in farm-gate prices of opium was strongly reflected in farmers' reasons for cultivating opium poppy in 2014: the high sale price of opium continued to be the most important reason for cultivating opium poppy cited by poppy farmers (44%), but it was reported to a much lesser extent than in 2013 (72%). Poverty, improving living conditions and high income from little land were other important reasons for cultivating opium poppy declared by farmers.
Figure 13: Reasons for cultivating opium, 2013-2014

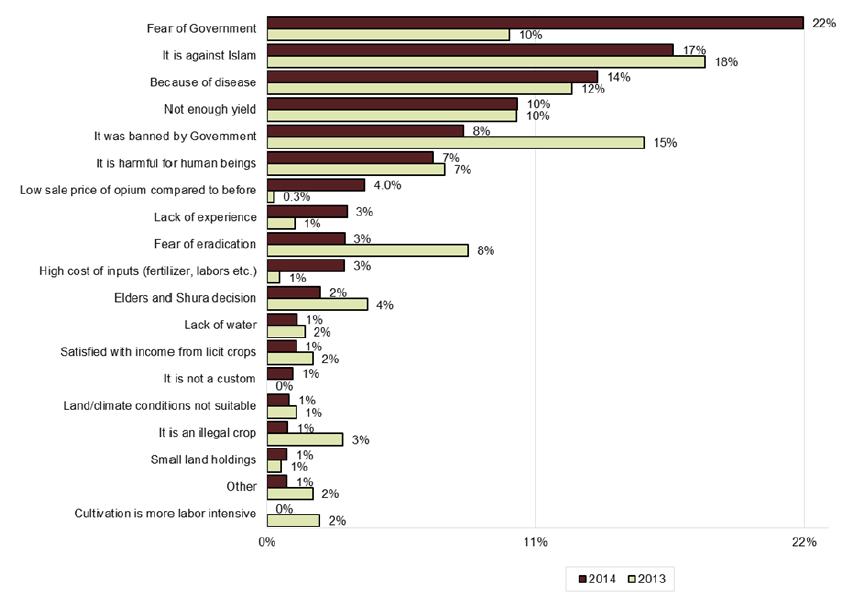
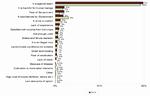
Click to enlargeFarmers who had ceased cultivating opium in 2014 or before were asked about their major reasons for doing so. The government ban on opium cultivation was the most cited reason (22% of respondents) in 2014, while religious belief (opium cultivation being against Islam) was the second most frequently cited reason for ceasing opium cultivation (17% in 2014; 18% in 2013). Other important reasons were disease and not enough yield (14% and 10%, respectively).
Figure 14: Reasons for ceasing opium cultivation in or before 2013-2014
Click to enlargeAs in 2013 (12%), ceasing opium cultivation out of the fear of plant disease continued to be a major factor in 2014 (14%), whereas in 2012 only 1.2% of farmers reported that they ceased opium cultivation for that reason. The relatively high proportion of farmers citing plant disease seemed to reflect their experience, or at least knowledge, of the widespread disease that affected opium poppy in 2010 and 2012.
Figure 15: Percentage of farmers who reported disease as a reason for ceasing cultivation, by region, 2014
Click to enlargeThis was even more apparent from the regional distribution of reasons for ceasing opium cultivation. For example, in the Southern region, which was heavily affected by disease and where yields were still below average in 2014, 42% of farmers cited plant disease as a reason for ceasing opium cultivation, while only 1% of farmers in the Central and North-eastern regions cited disease as a reason.
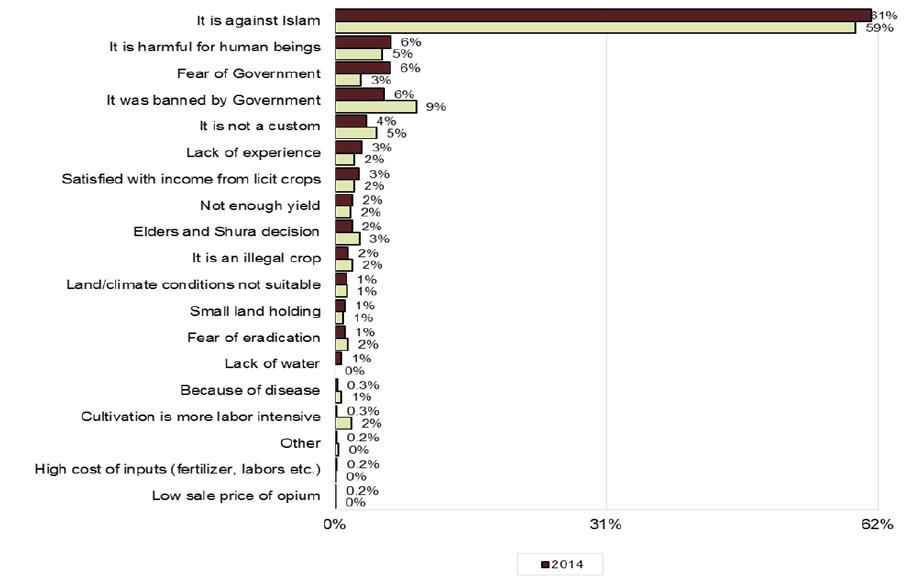
Figure 16: Reasons for never cultivating opium in 2013-2014
Click to enlargeIn both 2013 and 2014, religious belief was the principal reason for never having cultivated opium poppy: in 2014, some 61% of farmers who had never grown opium (59% in 2013) reported that they did not do so because it is forbidden (haraam) by Islam. The government ban and opium's harmful effect on humans were the other main reasons for never cultivating opium poppy.
It is apparent from the above findings that some farmers will never grow opium poppy because their beliefs are so firm that the impact of external factors that can push farmers to cultivate opium is substantially weakened. On the other hand, other farmers treat opium cultivation as a business and their choice is determined by factors such as climate, market value and the ability to cultivate alternative crops.
6.2 Links between lack of access to development facilities, security and opium cultivation
The multi-year research undertaken in Afghanistan has continued to show a link between opium poppy cultivation and a lack of employment alternatives (i.e. alternative on-farm income or off-farm employment opportunities), a lack of governance, a lack of stability, a lack of opportunities for education, and poverty.
This analysis of data collected form village headmen and farmers has found that inaccessibility to schools, markets and development facilities is related to opium cultivation. For example, there is a striking relationship between the presence of girls' and boys' schools and an absence of opium poppy cultivation (see figure 17). Likewise, it has been shown that opium poppy-growing villages are further away from markets than non-poppy-growing villages and that there is a relation between opium cultivation and the absence of basic development facilities such as access to the power grid. This list is not exhaustive and, for some of these relationships, there may be a common underlying reason that explains both factors (such as Taliban presence, education and poppy cultivation). However, it is clear that poppy cultivation is a multi-dimensional problem and driven by many different factors.
Figure 17: Access to boys' school and a girls' schools in the Eastern, Southern and Western regions, by poppy-growing status, 2014
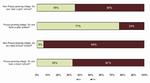
Click to enlargeDifferences are significant at the 0.01 level.
6.3 Geographical assessment of risk factors for opium cultivation |22|
To explore the driving factors behind opium poppy cultivation in more depth, UNODC/MCN has entered into cooperation with the University of Salzburg, Austria. |23| A risk assessment of opium poppy cultivation in Afghanistan was undertaken, which is based on the data collected during the village surveys supplemented with other data sets (for example, climatic conditions).
The risk assessment combined socio-economic factors with environmental factors known to be related to opium poppy cultivation in order to assess the location-specific (independent of administrative boundaries) risk of opium poppy cultivation. |24| Both components (environmental and socio-economic indicators) are important factors to consider: if the surrounding farmland provides ideal growing conditions, it does not necessarily follow that a farmer will actually cultivate illicit crops. Likewise, though environmental conditions may be the same, poppy is cultivated to a greater extent in one area, while other areas (provinces, districts or even parts of a district) may be less affected, or even totally unaffected, by poppy cultivation due to socioeconomic or political differences.
The purpose of the assessment is not to predict cultivation, but rather to investigate the geographical distribution of its risk factors with the aim of understanding what factors play a role in opium poppy cultivation in which parts of the country, and which of these factors are more important in one geographical area than in another.
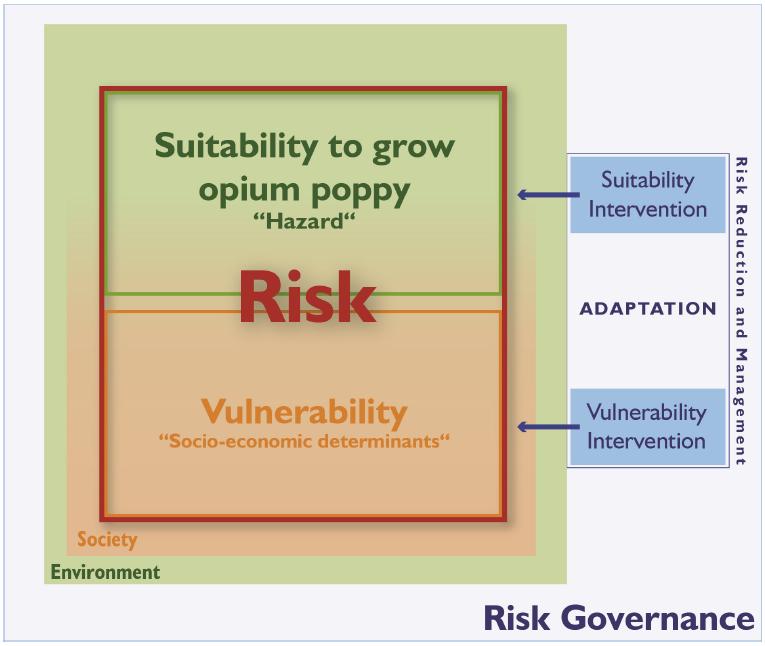
Figure 18: Conceptual framework defining the risk of opium poppy cultivation: risk is composed of environmental and climatic suitability, and vulnerability to illicit cultivation determined by socio-economic factors derived from the UNODC/MCN village surveys and ancillary data.
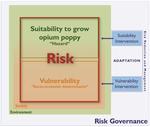
Click to enlargeThe risk of opium poppy cultivation can be assessed by looking separately at environmental suitability and socio-economic vulnerability and by looking at both together, which results in three maps.
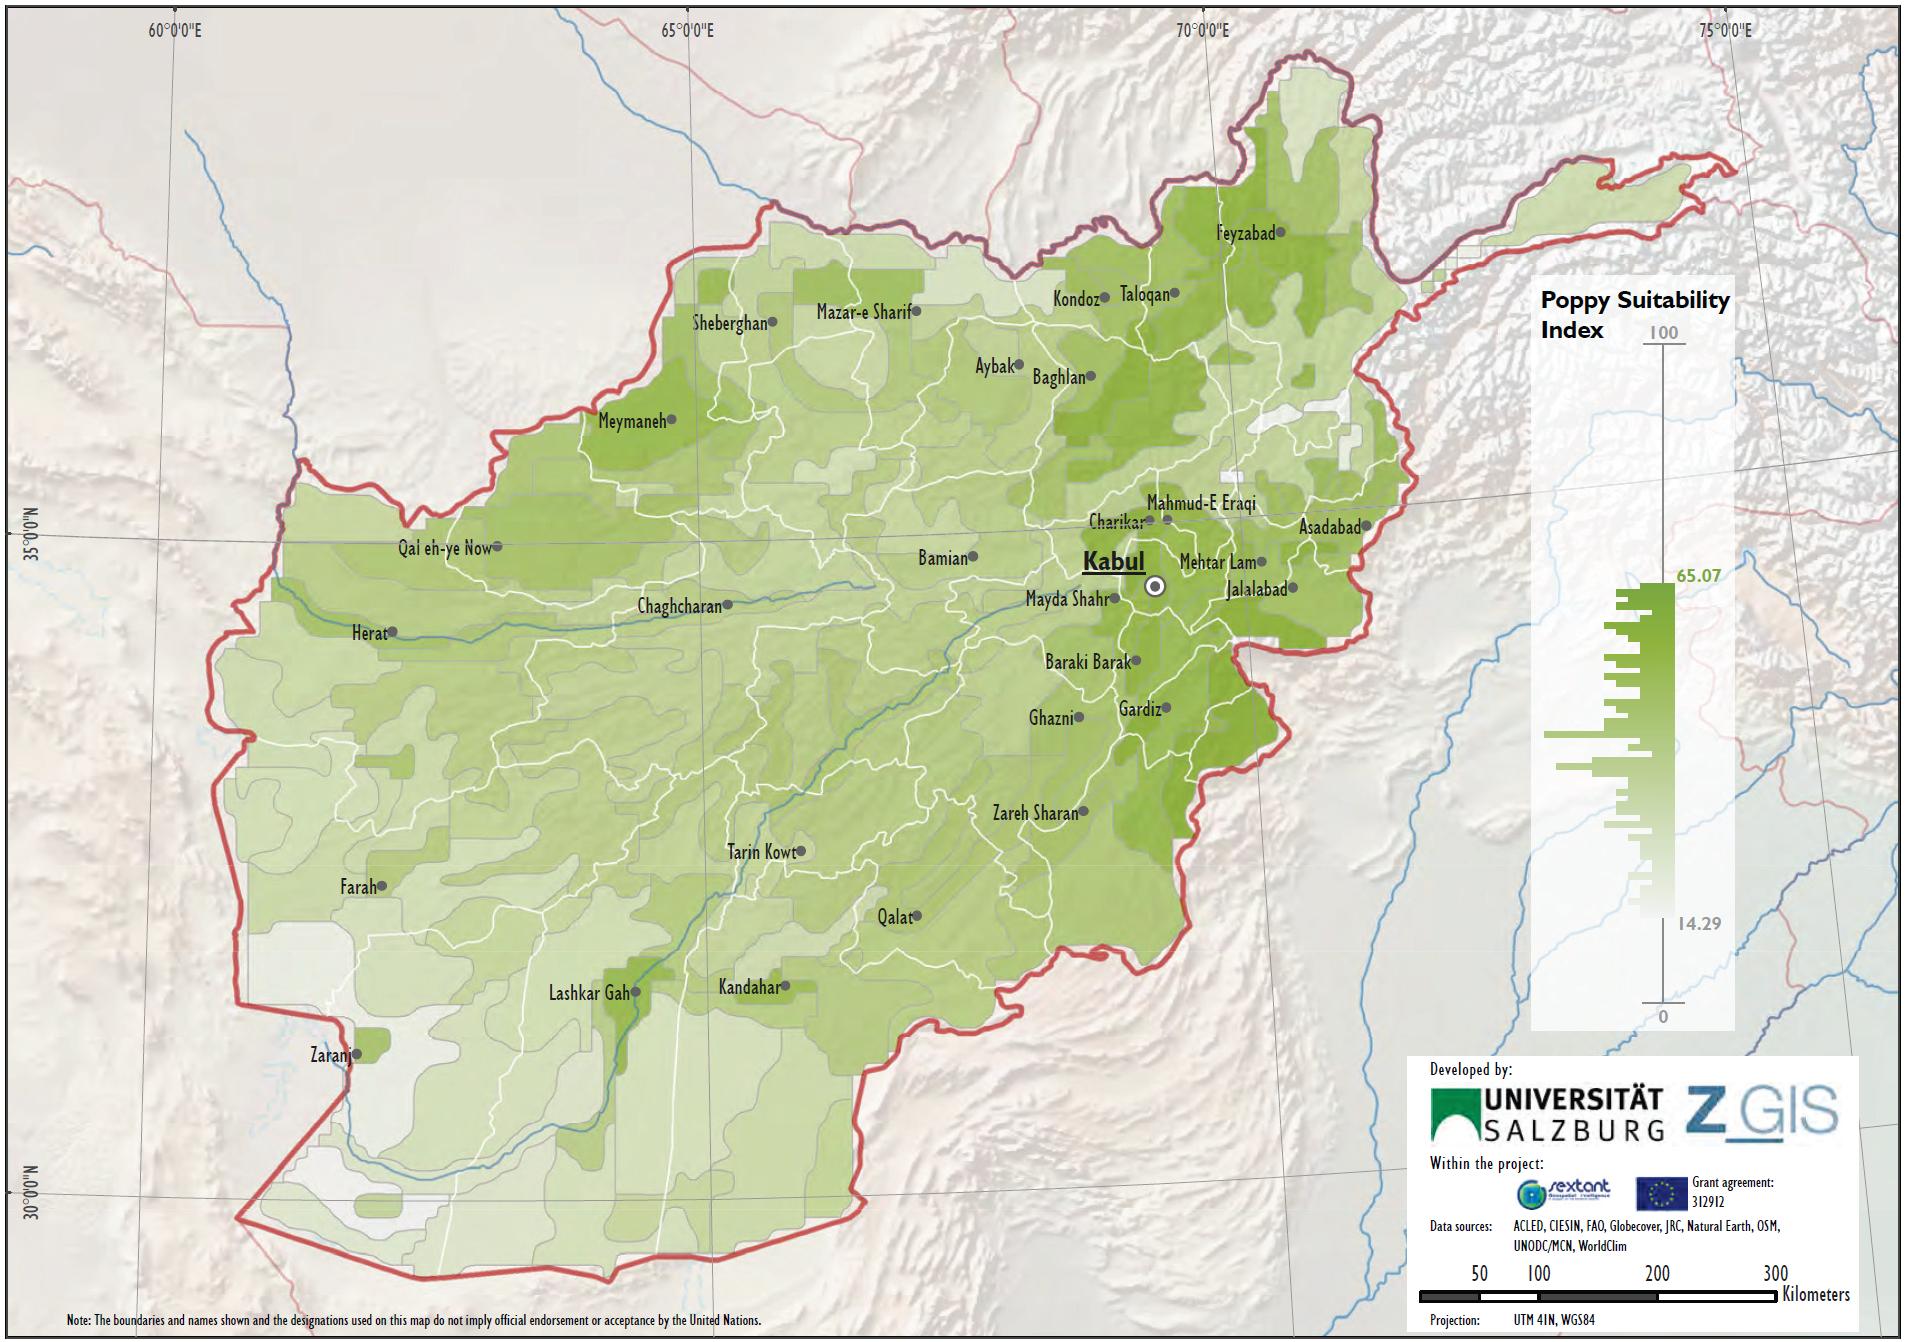
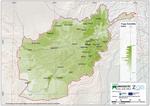
Map 1: Environmental suitability to opium poppy cultivation in Afghanistan
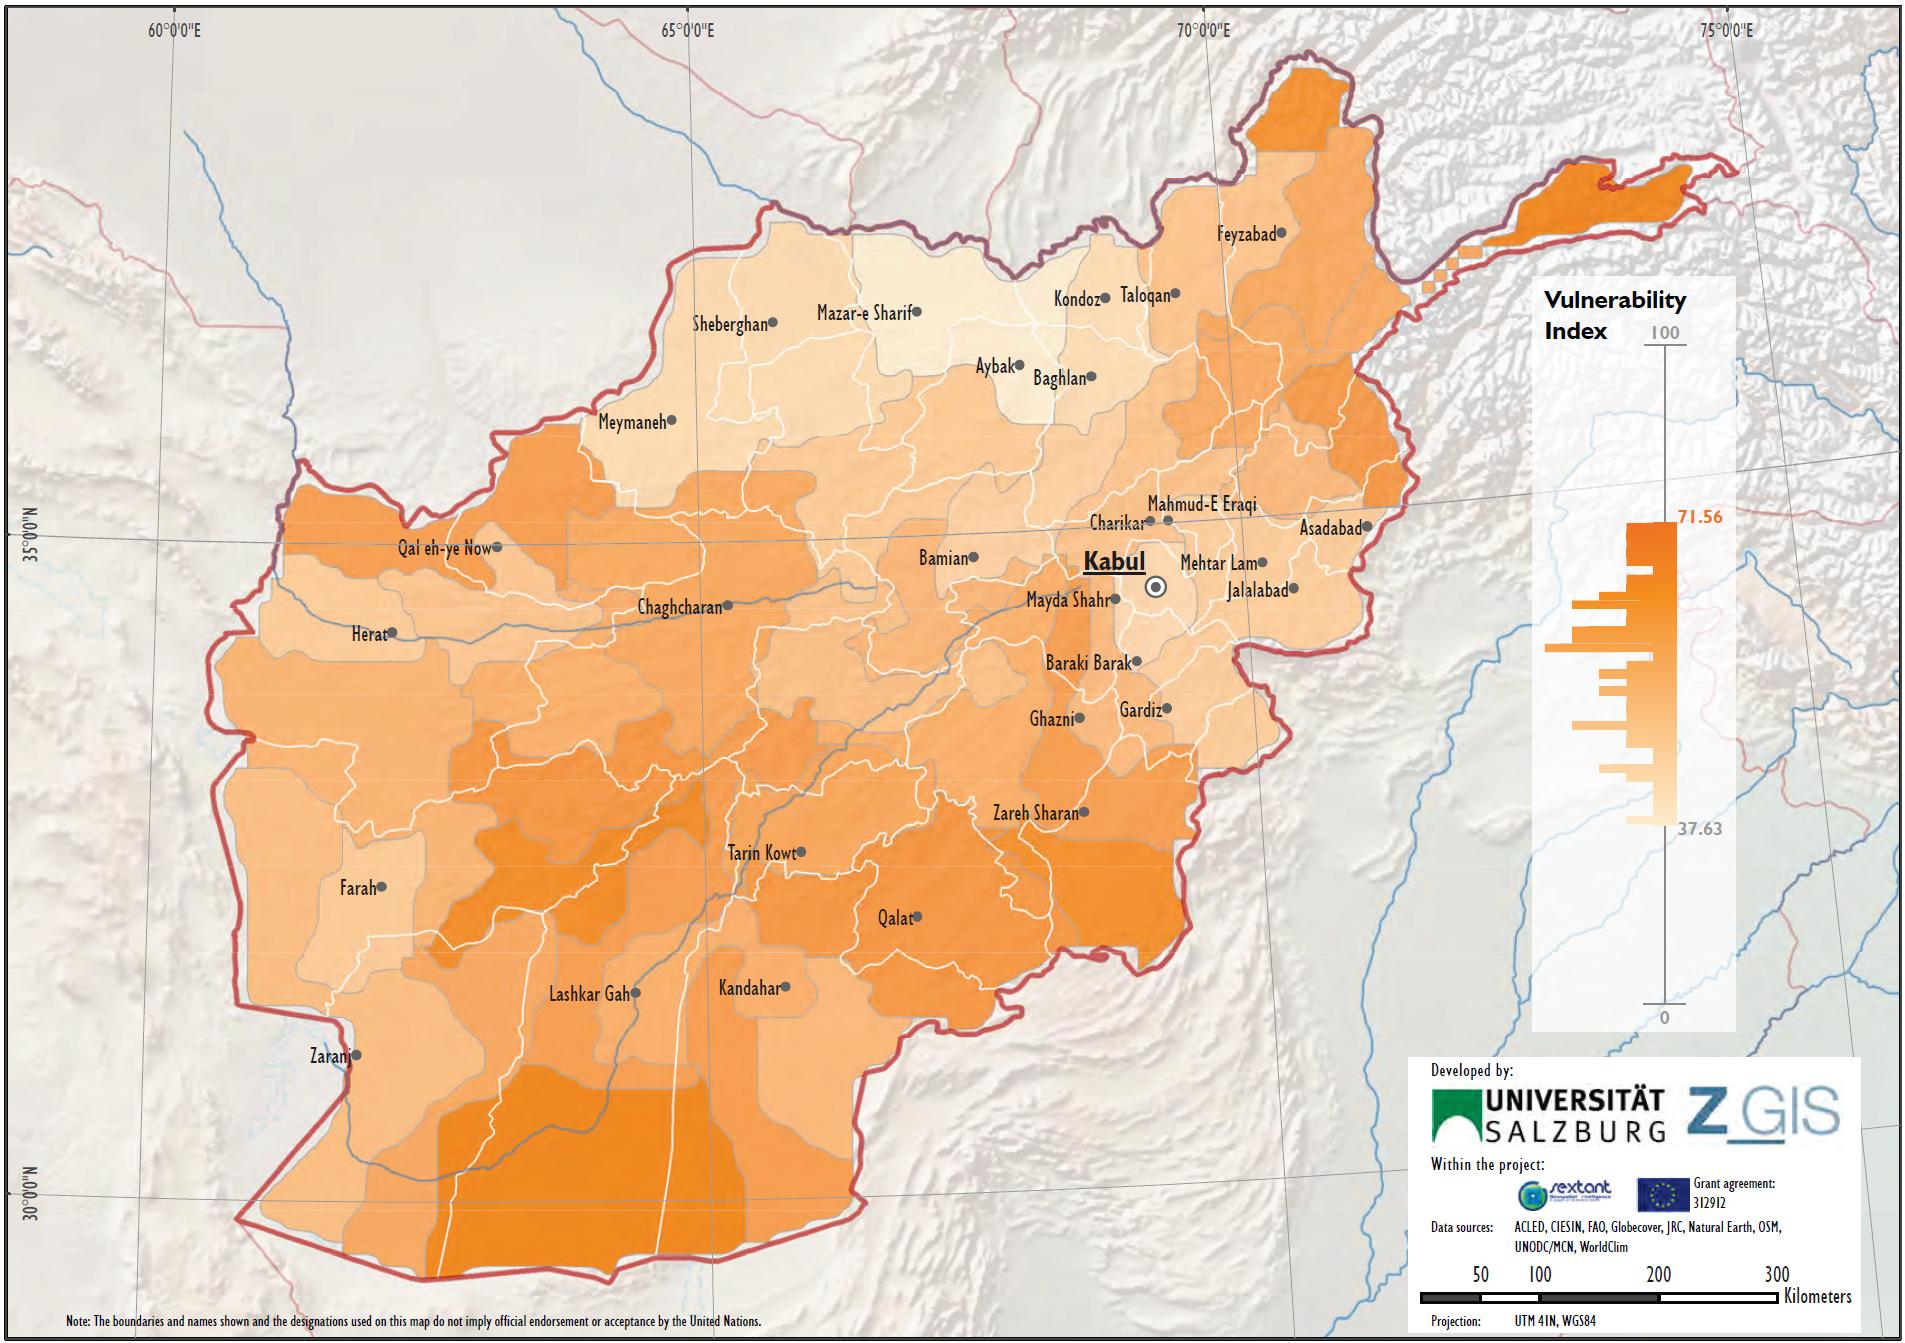
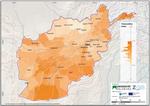
Click to enlargeMap 2: Socio-economic vulnerability to opium poppy cultivation in Afghanistan
Click to enlarge6.3.1 Opium poppy cultivation risk map and case studies
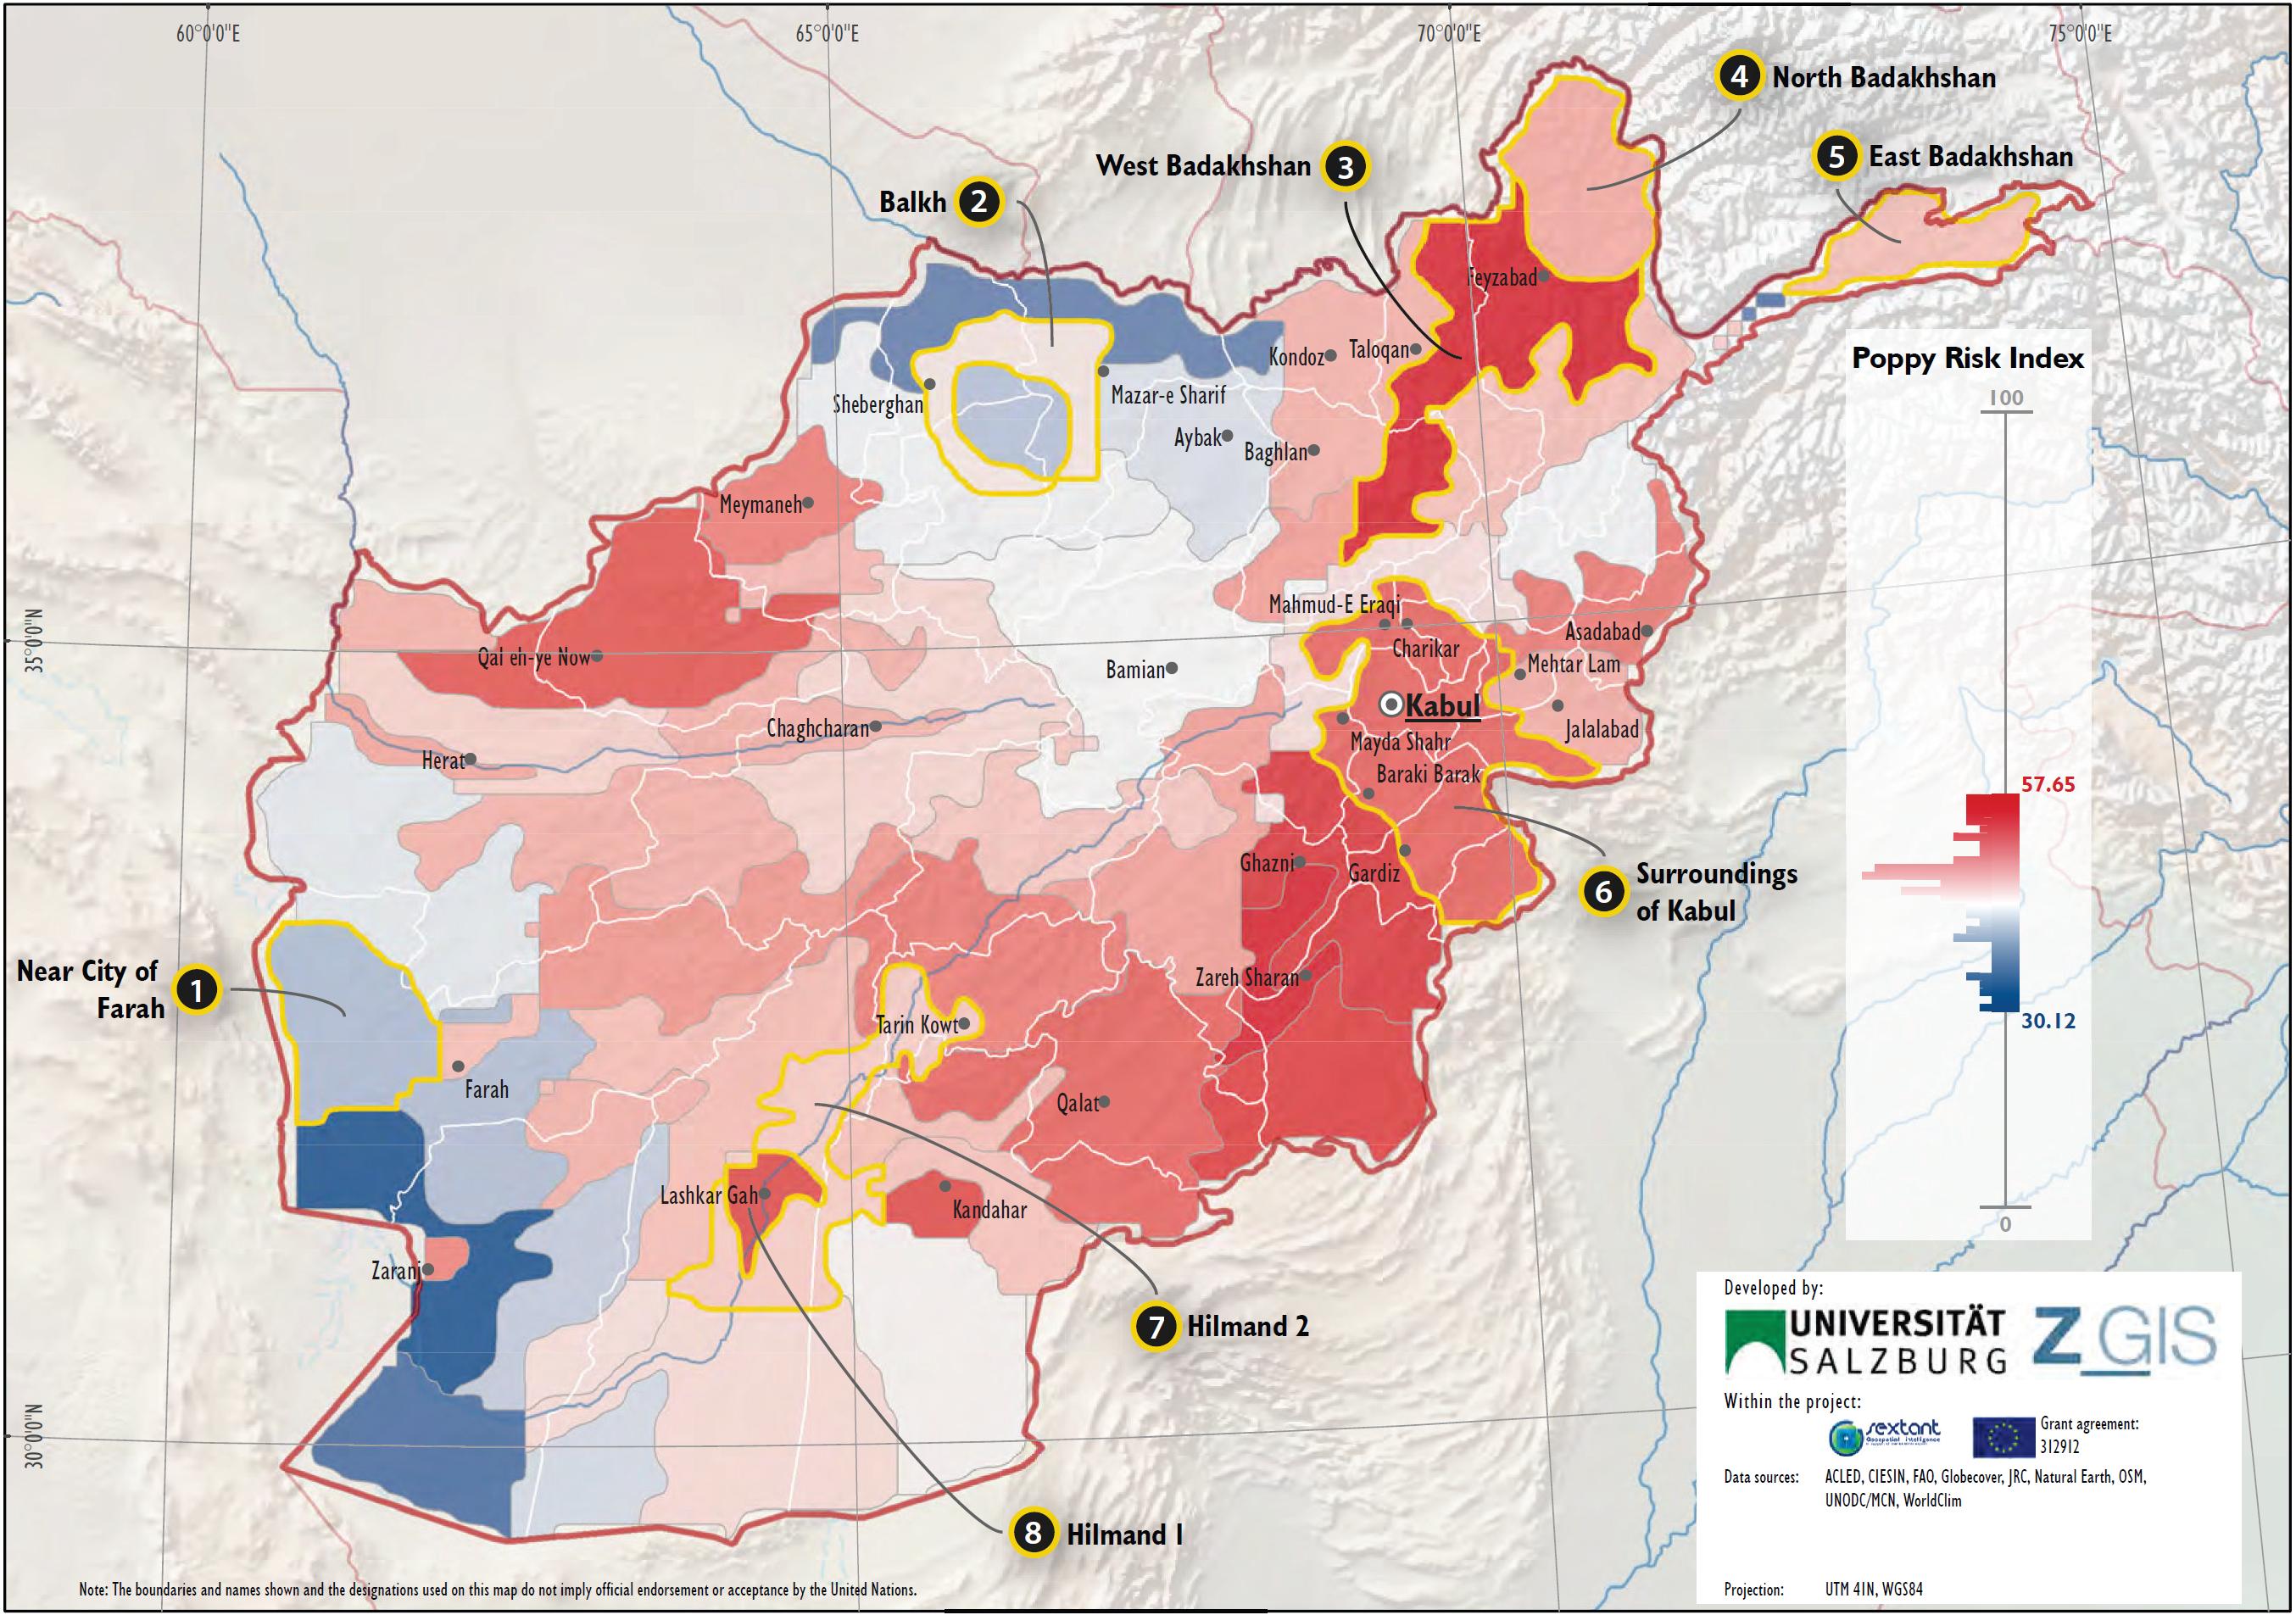
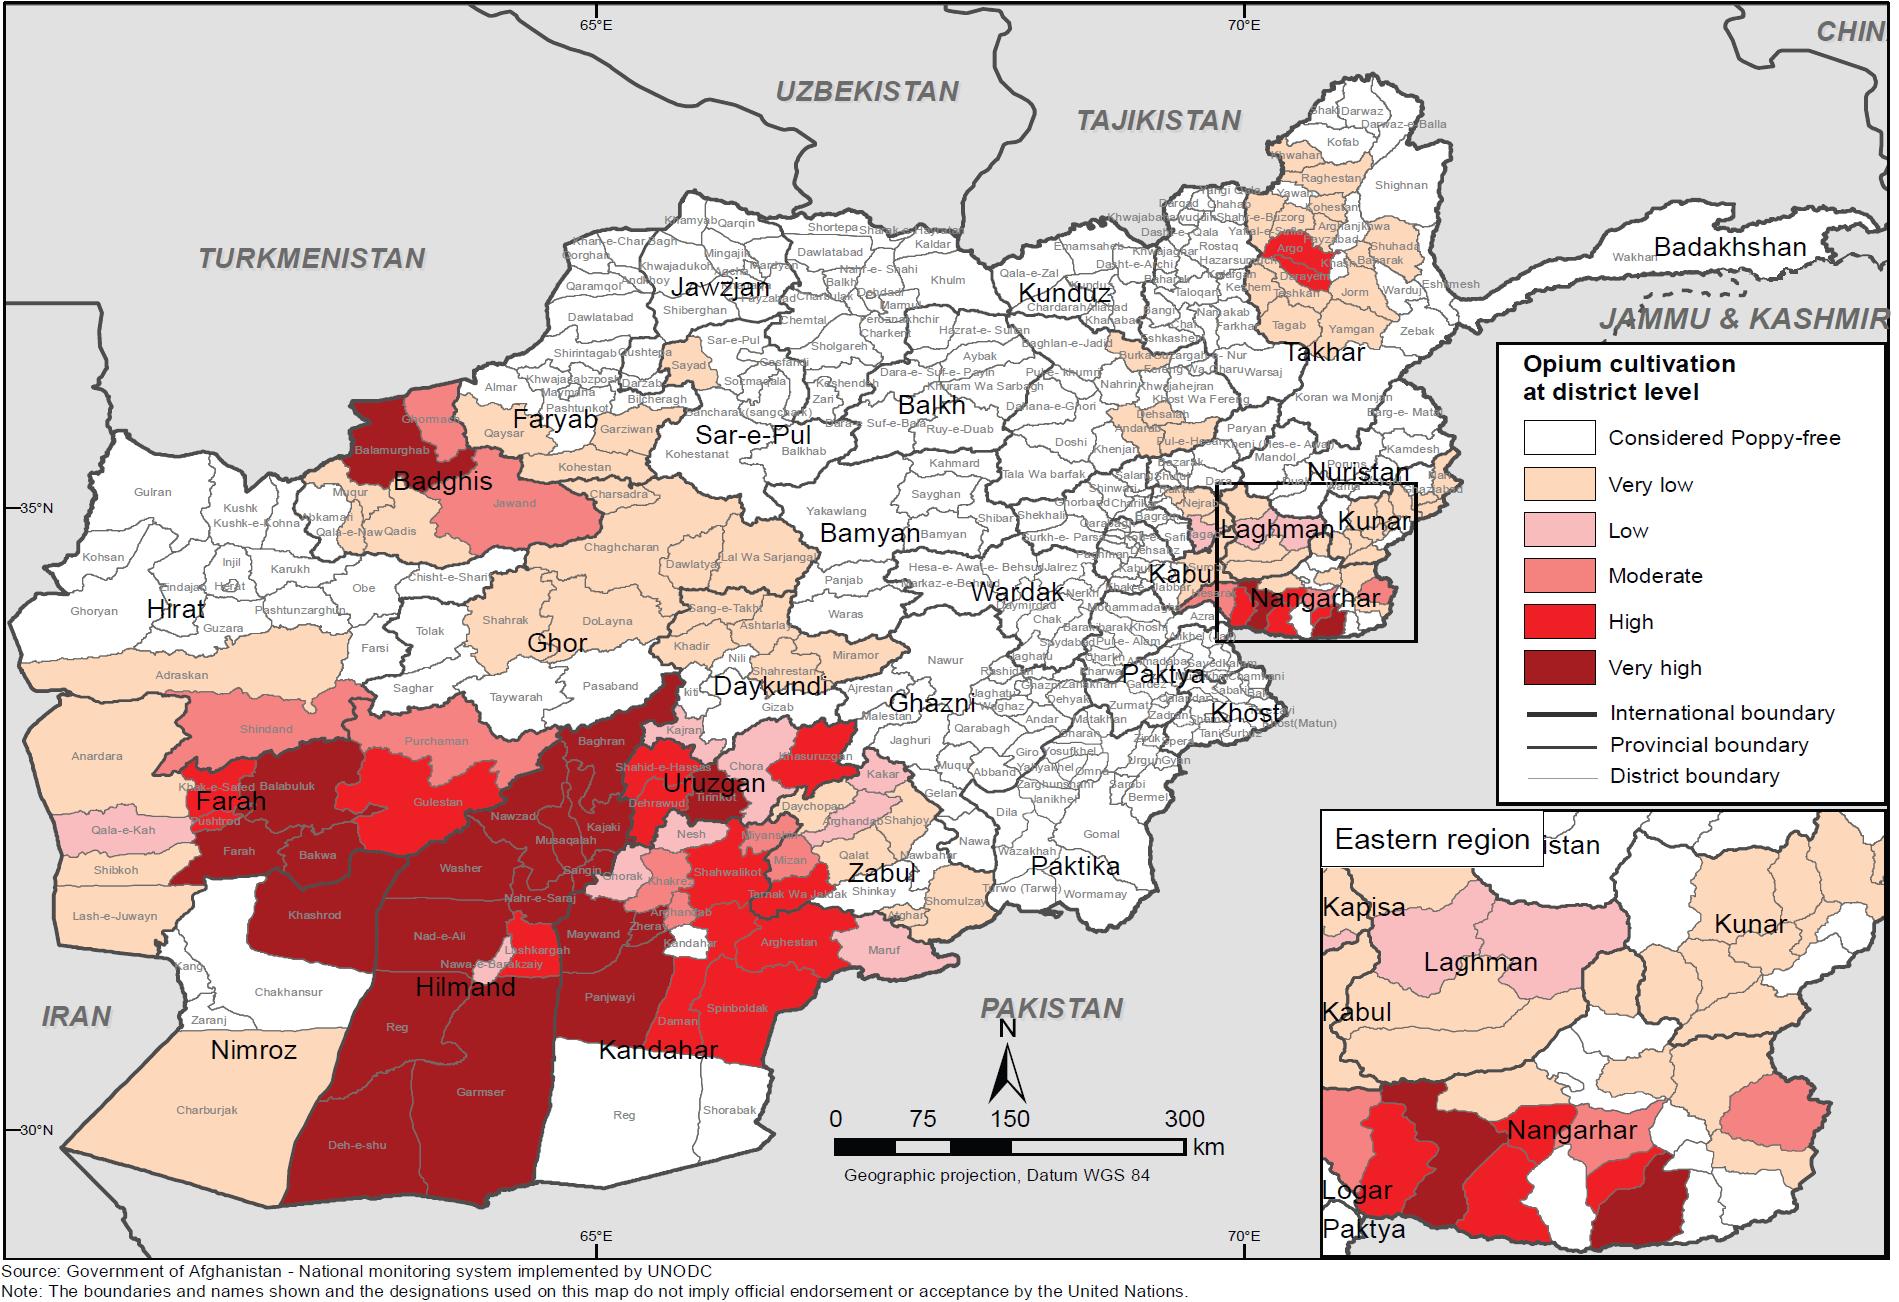
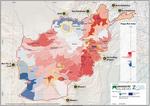
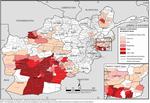
When looking at the combination of environmental suitability and socio-economic vulnerability modelling results, a high risk of opium cultivation is apparent in the Eastern, Northern and Northwestern regions of Afghanistan. The risk map largely reflects the current opium cultivation situation, with deviations in some areas: for example, in Farah, where poppy is cultivated but relatively little risk is indicated, or in the Eastern and Central regions, in the provinces of Paktika, Khost, Paktia and Ghazni, where a high risk is shown but no cultivation takes place. There is also an area in the north-east of Badakhshan, which though highly vulnerable (due to its being on the periphery and not easily accessible) is poppy-free as it is not climatically suitable for opium poppy cultivation. This section focuses on case studies in some of those areas
Map 3: Risk map integrating environmental suitability and socio-economic vulnerability
Click to enlarge6.3.2 Case Study I: Comparison of two selected areas in Farah and Balkh
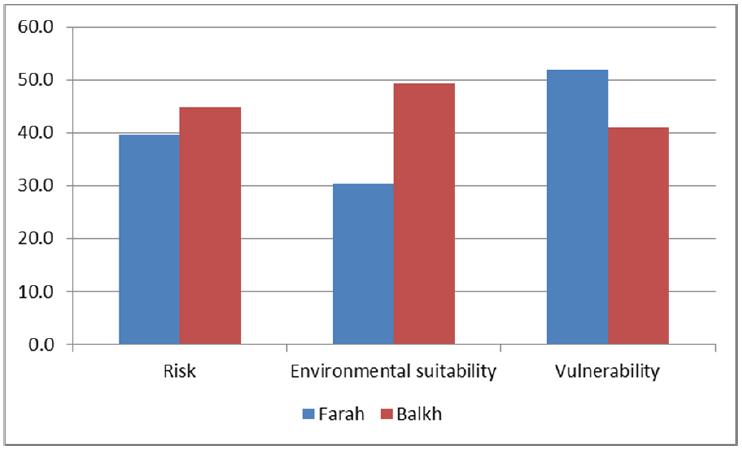
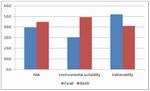
Here, two selected areas in Farah and Balkh which have similar, relatively low levels of risk of opium cultivation yet actually present different poppy cultivation levels are considered: the area near the city of Farah has a risk index of 39.8 and the one around Balkh, next to Mazar-i-Sharif, has a risk index of 44.9, but while there was no poppy cultivation in Balkh, Farah accounted for 12% of total opium cultivation in Afghanistan in 2014. The composition of the factors contributing to risk is very different, however (see figure 19), as the area around Farah has a low level of risk due to its low environmental suitability in comparison to its socio-economic vulnerability, whereas the area around Balkh has a low level of socio-economic vulnerability in comparison to its environmental suitability. Indeed, poppy cultivation in Farah seems to be the result of socio-economic vulnerability.
Figure 19: Risk, socio-economic vulnerability and environmental suitability in selected areas of Farah and Balkh
Click to enlargeWhen looking at the indicators that contribute to risk value, the differences become more apparent (see figure 20). Although in the area in Farah (blue) all indicators related to socio-economic vulnerability have higher values than in the area in Balkh (apart from credit availability which has a low weight), the indicators of environmental suitability have higher values in Balkh than Farah. This is apparent in the outcome, too: the area around Balkh is poppy-free, while Farah is one of the main poppy-cultivating provinces – despite the relative lack of environmental suitability of land and climate in large areas of the province.
The distribution of poppy cultivation in Farah is also reflected in the model: the risk maps show that the eastern parts of Farah present higher risk values both in terms of environmental suitability and socio-economic vulnerability, which coincides with the higher levels of poppy cultivation in that area (see map 4).
Map 4: Opium cultivation in Afghanistan, by district, 2014
Afghanistan Opium cultivation in 2014 (at district level)
Click to enlargeThese examples show that a similar risk value can be rooted in quite different circumstances. From a policy perspective, this indicates that the current political and socio-economic situation in Balkh does not provide a situation conducive to opium poppy cultivation, though, since environmental suitability is given, slight changes could lead to an increase in poppy cultivation. In Farah, however, in the East of the province in particular, where environmental suitability is higher, socio-economic drivers have to be tackled to reduce cultivation.
Figure 20: Decomposition of indicators related to environmental suitability and socioeconomic vulnerability in selected areas in Farah and Balkh*
Click to enlarge* Unweighted values have been applied for calculating the risk index weights.
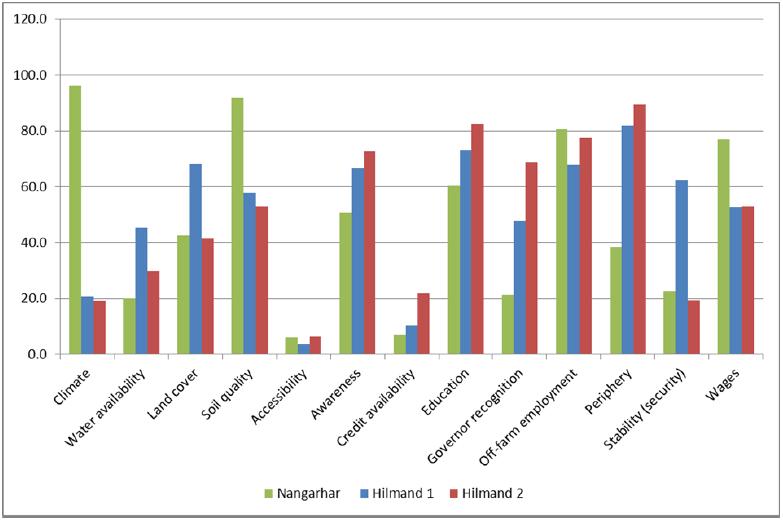
6.3.3 Case Study II: selected areas with high levels of risk in Hilmand
This case study relates two areas located close to each other in Hilmand province: one is located around the provincial capital, Lashkar Gah (Hilmand 1), and the other area surrounds this area (Hilmand 2). Hilmand 1 has a higher overall risk of opium poppy cultivation than Hilmand 2, but it has lower levels of cultivation than in the rest of the province. The decomposition of risk by indicator (see figure 21) explains this difference. Hilmand 1 has a high risk due to its socioeconomic conditions while the risk in Hilmand 2 is associated with its better quality of land and water availability. This shows that cultivation in these circumstances is led by socio-economic conditions rather than by the quality of agricultural land.
When comparing the situation in Hilmand with Nangarhar, the difference is even more apparent. Apart from the indicator relating to off-farm employment and wages, Hilmand has much higher socio-economic vulnerability than Nangarhar, which is a resource-rich province whose vicinity to Jalalabad and Peshawar and their economic opportunities means that its socio-economic vulnerability to poppy cultivation is low in general. Yet Nangarhar is a major poppy-cultivating province, though it has successfully implemented opium bans in the past.
From a policy perspective this could imply that Nangarhar requires a more political response, whereas in Hilmand the focus could be on development measures to increase security, accessibility (and thus reduce the risk associated with the periphery indicator) and education.
Figure 21: Decomposition of environmental suitability and socio-economic vulnerability in selected areas in Nangarhar and Hilmand*
Click to enlarge* Unweighted values have been applied for calculating the risk index weights.
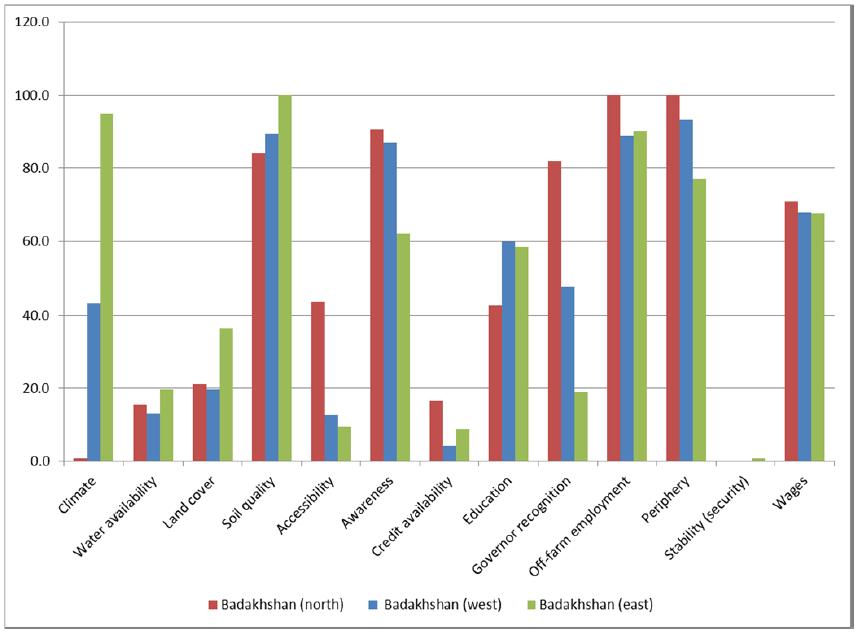
6.3.4 Case study III: Badakhshan
A very good reflection of the geographical distribution of poppy cultivation by the risk index can be found in the province of Badakhshan. The areas analysed include an area with the highest risk index, which covers the part of west Badakhshan where most opium poppy cultivation occurs, and two other areas that show a lower risk and cover areas with lower levels of opium poppy cultivation.
When looking at the decomposition of the risk indicators it becomes apparent that this difference is mainly caused by environmental factors. The area in east Badakhshan presents lower overall levels of socio-economic vulnerability (with the exception of credit availability, which has a small weight, and education, while the area in north Badakhshan has lower values) but higher values in terms of all indicators related to environmental suitability. This implies that the geographical distribution of opium poppy in Badakhshan is mainly driven by environmental factors, particularly climate, and not so much by factors related to socio-economic vulnerability. From a policy perspective, a focus on the areas which are highly suitable for poppy cultivation could be more effective.
Figure 22: Decomposition of environmental suitability and socio-economic vulnerability in selected areas in Badakhshan*
Click to enlarge* Unweighted values have been applied for calculating the risk index weights.
6.4 Lessons learned from the risk assessment
The opium poppy risk assessment presented here enables exploration of the complex nature of illicit crops in Afghanistan. An empirical validation that compares the derived risk indices with actual poppy cultivation levels by district shows that the map reflects opium poppy cultivation patterns in a satisfactory manner: hotspots of opium poppy cultivation are generally located in high-risk areas. From deviations, as in poppy-free provinces in the Central and Eastern regions, important lessons can be learned about drivers – or in this case, inhibitors – of cultivation that are not captured in the current model.
The study also confirms what has already been widely discussed in the literature: reasons for cultivation are diverse and often location specific. The results of the risk assessment illustrate the complexity of the illicit crop situation in Afghanistan and are aimed at encouraging a more profound examination of the drivers of opium poppy cultivation in a geographical context. The assessment clearly shows that substantial differences exist within Afghanistan, both in terms of the values and the nature of socio-economic vulnerability to opium poppy cultivation and the environmental suitability of the land.
The strength of this method is that each single area can be decomposed into its components, allowing the identification of the contributions of the single indicators. In this way, the risk assessment can support the development of context- and location-specific interventions that are aimed at reducing vulnerabilities. Furthermore, the vulnerability assessment can potentially be implemented as a monitoring tool to evaluate changes over time and the impact of various interventions.
The opiate economy in Afghanistan cannot be eradicated without interventions in the rural economy. At the same time, the rural economy cannot be properly analysed without considering the opium economy, particularly in those areas where the opium economy constitutes a significant portion of the rural economy.
7 Methodology
This chapter covers various methodological aspects regarding survey design and estimation procedure.
7.1 Village survey methodology
Village survey activities (such as training, deployment and data collection) were carried out from the end of March to the end of April 2014 by 136 local field surveyors across all provinces. These activities were supervised jointly by MCN and UNODC. The surveyors were selected on the basis of their experience in opium poppy surveys, knowledge of local customs and their acceptance by local communities. Security was generally problematic for the surveyors, but the selection of surveyors actually from the regions surveyed helped to reduce security risks.
7.1.1 Sampling framework and village frame
The sampling frame for the village survey data is comprised of a list of 41,419 villages in Afghanistan, which is based on information from the Central Statistical Office and UN databases. It contains the village name, district, province and location and, for most provinces, also the number of households and average household size of the villages listed. The village frame has not been updated since 2010. In addition to the sampled villages, the surveyors, using their knowledge of the local situation, visited other areas in their provinces to complement their assessment of opium cultivation trends and the security situation throughout the province.
The sample of villages visited was a nationally representative sample. It was drawn by means of a systematic random sampling approach stratified according to regions that assured the sample followed the distribution of village sizes in the frame. The sample size was allocated proportionally to the square root of the size of the region (measured by the number of villages).
Surveyors sought to interview three farmers in each village: one opium-growing farmer; one who had ceased opium cultivation; and one who had never grown opium. In poppy-free villages, less than three farmers were interviewed. Interview partners were recruited by opportunity sampling.
The following two figures show scatter plots of the numbers of households (x-axes) together with the numbers of villages (left) and with the population size (right).
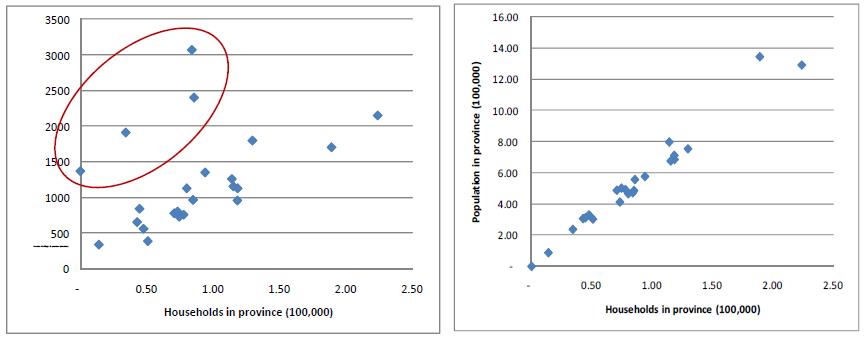
Figure 23: Scatter plots of household data, village data and population data of the village frame
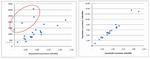
Click to enlargeAs one can see, the total population is highly correlated with total numbers of households (all dots align along one line), whereas the number of villages compared to the numbers of households in the province has four remarkable outliers in Day Kundi, Kandahar, Nangarhar and Zabul provinces (all within the red circle). When compared to household numbers a relatively larger number of villages can come from a significantly smaller size of village. However, double counting of villages or other problems with the database cannot be excluded. Deeper analyses of these issues are out of the scope of this survey, but the discrepancies between the number of villages and the number of households in some provinces should be taken into consideration when interpreting the results. Too large a number (relatively) of villages can lead to an overestimation of indicators of interest.
7.1.2 Surveyor training
In order to prepare for the village survey, and as part of a capacity-building exercise for national staff, regional survey coordinators and their assistants were trained in Kabul over a two-day period. They, in turn, trained surveyors in their respective regions. The extension of survey training sessions to the regional level is one of the milestones reached in building national capacity to conduct opium poppy surveys.
During the training period, a total of 136 surveyors were trained in the use of the survey form and techniques by MCN survey coordinators and supervised by UNODC survey coordinators. Surveyor training began in March 2014. The training included practical (use of GPS, etc.) and theoretical aspects (interviewing and dialogue with village headmen and farmers).
Data collection
Opium cultivation is illegal in Afghanistan and is considered to be forbidden by Islam. Given the sensitive nature of the issue, data collection is difficult and can be dangerous. Surveyors are thus selected from different regions of Afghanistan by means of a very careful process. MCN and UNODC regional offices and coordinators recruit surveyors according to survey specifications and the surveyors' skills. Most of those selected already have experience of conducting UNODC surveys.
Surveyors were trained in techniques for approaching local community members and conducting interviews. Following intensive theoretical and practical training, they were deployed to the field where they interviewed village headmen and conducted other survey-related activities. MCN and UNODC coordinators closely monitored data quality and the progress of the survey. Fortunately, the surveyors did not encounter any security problems.
Debriefing
After the survey, surveyors were debriefed by survey coordinators. This helps understand the difficulties surveyors may have encountered (for example, due to the difficult security situation) and whether questions were properly understood by respondents.
7.2 Average farm-gate price and farm-gate value of opium production
Since 2009, farm-gate prices at harvest time have been derived from the opium price monitoring system and refer to the month when opium harvesting actually took place in the different regions of the country, which is thought to reflect opium prices at harvest time better. To calculate the national average price, regional price averages were weighted by regional opium production. The opium price in the Central region was calculated from the annual village survey, as there is no monthly opium price monitoring in that region.
The farm-gate value of opium production is the product of potential opium production at the national level multiplied by the weighted average farm-gate price of dry opium at harvest time. The upper and lower limits of the range of the farm-gate value were determined by using the upper and lower opium production estimate.
7.3 Estimating the value of the Afghan opiate economy
7.3.1 Key components and underlying assumptions
- Conversion factors A factor of 9.6:1 is used for the conversion of opium into heroin of export quality. Both of these factors are under investigation by, for example, the on-going yield experiments that include investigations into the morphine content of Afghan opium. The heroin figures calculated here refer to "brown" heroin base. More than 9.6 kilograms of opium is needed for the production of 1 kilogram of pure white heroin (heroin hydrochloride). However, the export of such high-quality white heroin from Afghanistan appears to be very limited in comparison to that of brown heroin, thus the production and export of white heroin were not considered in this estimation. For details of the calculation of the conversion ratios please refer to the Afghanistan Opium Survey 2014: Cultivation and Production, page 35.
- Precursor substances. For the production of 1 kilogram of heroin, 1.5 litres of the costly precursor substance acetic anhydride is needed (updated in 2011 from 2.5 litres).
- Purity. The calculation of the value of the opium economy is limited by the fact that the drug products leaving laboratories in Afghanistan may undergo further processing, such as adulterations, before reaching assumed points of sale in neighbouring countries. Indeed, there is evidence that heroin is already mixed with cutting agents in Afghanistan. This is done to increase profitability but can also be done for other reasons, such as tailoring the drug product for specific usages, |25| which not only alters the volume of the drug exported but also influences costs.
- Amounts of opium converted to morphine/heroin. When estimating the amount of opium converted to heroin, seizures in Afghanistan and in neighbouring countries, such as the Islamic Republic of Iran, Pakistan and Central Asia (Kazakhstan, Kyrgyzstan, Tajikistan, Turkmenistan, Uzbekistan), are considered in the model. There are indications of direct drug exports to China and India as well as to other countries by air or land, but the amounts trafficked through those routes are thought to be comparatively small and are not considered in the model. All seizure data from Afghanistan and neighbouring countries is used for the estimation, which implicitly assumes that the shares converted in and exported from Afghanistan are proportional to all seizures made in those countries.
- Morphine/heroin exports. Recent morphine seizures bear evidence of morphine exports from Afghanistan to neighbouring countries. No difference is made between morphine and heroin in their estimation. Morphine and heroin are both treated as heroin in the calculations of the ratio of opium converted to heroin.
- Income from trafficking. The value of exported opium (partly transformed into morphine/heroin) was based on its value at border areas with neighbouring countries. Opiates are usually trafficked to neighbouring countries by Afghan traffickers who, in general, are involved in shipping opiates over the borders, from where traffickers from neighbouring countries take over the consignments. The total gross value of exported Afghan opium can therefore be estimated by multiplying wholesale prices of opium and heroin in the border regions of neighbouring countries by estimated amounts of drugs trafficked.
- Domestic market. The calculation of opiates consumed within Afghanistan uses the drug use estimates from the 2009 Drug Use Survey implemented by the Government of Afghanistan and UNODC, as well as more recent price data. The average quantity of opiates typically consumed per day was 0.35 grams; the quantity of opium consumed was 3.1 grams per day. The underlying assumption is that the quantity used has not changed since 2009, which is a simplification due to the lack of more recent data.
- Gross and net export value. For the calculation of gross export value, the potential volumes of opium and heroin exported to neighbouring countries were multiplied by the corresponding average cross-border prices. The total gross export value is the combined gross export value of opium and morphine/heroin exports. As indicated above, morphine exports are not considered separately and all processed opium exports are assumed to be in the form of heroin. To estimate the net value, the value of imports has to be subtracted from the gross value of all final goods, since this is income lost to the exporting country (Afghanistan). There are many imports necessary for opiate production but only imports of the main precursor substance for heroin production were considered in the calculation.
7.3.2 Components of the estimation
The opium economy estimation process includes the following steps:
- Estimation of the gross value of the domestic market for heroin/morphine and opium;
- Estimation of the gross export value of the remaining opium in the form of opium or heroin/morphine, after deducting seizures and domestic consumption. The respective value is calculated by multiplying quantities by prices in respective neighbouring countries;
- Estimation of the net value of the economy by subtracting the costs of imported precursors used for the production of domestically consumed opiates and the gross export value of remaining opiates;
- Therefore, up-to-date cross-border (for the export value) and end-consumer market (for the domestic market value) prices are needed, as well as the prices of the main precursor substances;
- Furthermore, in order to estimate the amount of opium needed for each of those markets a conversion factor for opium into morphine and heroin is needed.
7.3.3 Proportion of opium converted into morphine and heroin
In 2014, UNODC updated the conversion ratio of opium to heroin, based on new data available on the morphine content of opium harvested in Afghanistan. |26| The updated conversion ratios are 18.5:1 for the production of pure heroin (18.5 kilograms of opium are needed to produce 1 kilogram of pure heroin) and 9.6:1 for heroin of export quality (impure heroin of 52% purity). In the following calculations, heroin of export quality is considered.
Table 12: Updated conversion ratio of opium to pure heroin base and of opium to heroin of export quality (52% purity) with opium of 12.3% morphine content and 34% laboratory efficiency (kilograms of raw opium needed to produce 1 kilogram of pure heroin base and 1 kilogram of heroin of export quality, respectively)
Conversion ratio of opium to pure heroin base Conversion ratio of opium to heroin of export quality 18.5:1 (19.6:1 to 17.5:1) 9.6:1 (9.1:1 to 10.2:1) The proportion of opium converted into morphine and heroin was derived from seizure data in Afghanistan and its neighbouring countries. A three-year average of all reported amounts was taken. The conversion ratio 9.6:1 was applied to all three years of data.
Table 13: Proportions of seizures by opiate type in Afghanistan and neighbouring countries (Percentage)
Distribution 2011 2012 2013 Average 2011-2013 weighted by amounts seized Opium 72% 59% 51% 62% Heroin/morphine 28% 41% 49% 38% Note: a conversion ratio of 9.6:1 for opium to heroin was applied for generating these estimates.
As seizures are often driven by pure chance and seizure data have some inherent uncertainties, changes should be interpreted with caution. Information from the CNPA laboratory indicates that not all assumed seizures of heroin turn out to actually contain heroin, or they contain heroin in combination with various other substances. |27| This is rather typical for seizures and not only specific to Afghanistan. The present level of information does not allow the correction of official seizure figures for purity.
Potentially, all opium produced in Afghanistan could be converted into morphine and heroin. In reality, however, a sizable proportion of opium is trafficked and consumed in the region in its raw form.
Calculating the potential production of heroin requires knowledge of how much opium is converted into morphine and heroin and how much remains unprocessed. This information can only be estimated on the basis of secondary information such as seizure data, thus any data about potential morphine and heroin production should be taken as a rough estimate: too little is known about how much opium is processed and when and where the conversion of opium to morphine and of morphine to heroin takes place.
Based on information on heroin/morphine and opium seizures in Afghanistan and neighbouring countries from 2011 to 2013, and using a 9.6:1 conversion ratio of opium to heroin of export quality (52% purity), |28| an estimated 62% of potential opium production was converted into heroin in 2014. This ratio was higher than in the previous year (54% in 2013). The change in percentage is mainly caused by the update of the conversion ratio of opium to heroin, as the distribution between opium and morphine/heroin seizures remained stable.
The following table shows potential heroin/morphine production if 62% of opium is converted to morphine/heroin and if all potential opium production is to be converted to heroin.
Table 14: Potential heroin production from Afghan opium, 2014
If 62% of potential opium production converted (tons) If total potential opium production converted (tons) Pure heroin base 210 (160-270) 350 (260-440) Heroin of export quality (52% purity) 410 (350-470) 670 (560-760) Unprocessed opium 2,450 (1,960-2,970) - A ratio of 18.5:1 (17.5:1 - 19.6:1) is used for converting opium to pure heroin base. For converting opium to 52% pure heroin, 9.6 kilograms (9.1 to 10.2 kilograms) of opium are assumed to be needed.
Every year all the opium produced in Afghanistan is either exported as raw opium or heroin/morphine, consumed domestically in various forms, seized, stored for later use or lost (for example, due to mould, disposal to avoid seizures, etc.). Hence, the critical amounts needed for calculating the total value of opium products are the shares of opium produced that are destined for export and for the domestic market, the shares of opium that are seized and lost, and the remainder (if any), which does not enter the market in the year of interest.
There is a clear understanding about the approximate amount of opium produced. The shares converted to morphine and heroin are much less certain as only secondary data, such as seizure data, can be used as a proxy. In the case of seizures, for example, the purity of the heroin is not known. Likewise, the purity of heroin domestically consumed may differ.
The share of opium destined for the domestic market is estimated based on the 2009 drug use survey. |29| Remaining opium production is therefore either exported, lost, or kept as inventory (if any is left). As there is not enough information available for providing direct estimates of losses or export amounts, the following breakdown is the most detailed that can be provided.
In 2014, Afghanistan produced an estimated 6,400 tons of opium. Local consumption made up about 4% of it (258 tons), while approximately 6% of all opium was seized as opium or heroin/morphine (equivalent to 415 tons of opium equivalent). After its deduction from total production that leaves a remainder of some 90% of all opium being potentially available for export in the form of opium, morphine or heroin. However, that includes all opium lost due to reasons other than seizures (for example destruction of inventory, mould, or shipments discarded to avoid seizures), as well as possible surpluses of production or opium produced in previous years that enter the market in the current year.
Figure 24: Opiates in Afghanistan, by destination, 2014
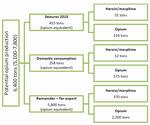
Click to enlargeNote: Heroin is transformed into opium equivalents by using the ratio 1:9.6; i.e. to produce 1 kg heroin of export quality (52% purity), 9.6 kg of opium are needed. Seizures in 2013 reported in the MCN Afghanistan Drug Report 2013 are taken as a proxy for 2014 since the total amount of drugs seized in the current year is not yet known. Consumption estimates are based on 2009 drug use data. With the exception of potential opium production, ranges have been omitted for brevity.
The gross value of Afghan opium production at end-consumer level and at the country's borders is calculated by the amounts consumed and traded multiplied by their respective prices. The net value of opiate production is the gross value minus all expenditure for imports from abroad needed for processing opium into morphine and heroin and results in a net gain for the Afghanistan economy. Net value is considered to be more suitable for comparison with GDP than gross value.
Seizures are not represented in these calculations, as the income that would be generated by seized products is lost. The value of the domestic market at end-consumer level is calculated by multiplying the amounts consumed by the street-level price for heroin/morphine and opium, respectively. The cross-border price was used to calculate the value of the potential exports of opium and opiate products.
The calculation of a possible range in the potential value of the Afghan opiate economy is based on different assumptions about the portion of opium converted to heroin or morphine for export. In the case of the upper bound, it is assumed that all opium available for export is converted to morphine or heroin in Afghanistan (corresponding to 670 tons of morphine/heroin), since the value of 1 kilogram of morphine/heroin is greater than the value of 9.6 kilograms of unprocessed opium. For the lower bound it is assumed that all opium available for export is exported unprocessed and that no conversion to morphine/heroin takes place in Afghanistan (corresponding to 6,400 tons of exported opium).
The resulting ranges are not meant to provide a confidence interval or any other statistical measure, but rather they constitute a what-if analysis that offers results on the basis of different assumptions about the further processing of opium in Afghanistan.
Table 15: Estimated gross and net values, 2014 (US dollars)
Gross value US$ (rounded) Net value US$ (rounded) Net value in relation to GDP Value of the opiate economy 2.84 billion (2.3-3.2 billion) 2.68 billion (2.3-2.9 billion) 12.6% Value of opiates potentially available for export 2.74 billion 2.59 billion 12.2% Farm-gate value of opium 0.85 billion 0.85 billion 4% Value of domestic market 0.1 billion 0.09 billion 0.4 % Export value of 1 kg of opium 387 387 Export value of 1 kg of morphine/heroin 5,100 4,700 Ranges are calculated based on different assumptions on the conversion of opium to morphine/heroin within Afghanistan. "Value of the opiate economy" refers to the sum of the value of the domestic market and the export value of opiates available for export.
The gross value of 1 kilogram of opium exported at wholesale level was approximately US$ 387 in 2014 (US$ 437 in 2013), while the value of 1 kilogram of heroin was US$ 5,100 (US$ 5,900 in 2013). In the case of exported opium, no significant import costs were considered, thus, in these estimations, gross value equals net value.
After subtracting the import costs of main precursors from the gross value (which in 2014 were some US$ 415 per kilogram of heroin; US$ 340 in 2013) the net value of 1 kilogram of heroin/morphine is reduced to US$ 4,700 (US$ 5,600 in 2014). When multiplying these prices by the respective amounts exported, the net export value of opiates in 2014 was US$ 2.59 billion, as opposed to a gross export value of US$ 2.74 billion.
The gross value of 1 kilogram of heroin in the domestic market of Afghanistan in 2014 was about US$ 5,200 (US$ 5,200 in 2013), which refers to retail prices. Subtracting precursor costs leaves a net value of around US$ 4,760 for 1 kilogram of heroin/morphine, and a net value of the domestic opiates market of US$ 0.09 billion.
7.3.4 Prices
For Pakistan, the cross-border price of opium was the simple average of the average monthly wholesale price in Peshawar, Pakistan (between March and December 2013) and the average monthly wholesale price in Quetta, Pakistan (between March and December 2013). |30|
Similarly, heroin prices were calculated from the monthly wholesale prices of best-quality heroin in Peshawar and Quetta. The higher best-quality price for heroin of injection quality was used to account for adulterations and other profit-increasing methods. All these prices were collected by UNODC in the framework of its monthly drug price monitoring.
For Central Asia, prices from Tajikistan, as reported by the Paris Pact Drug Situation Report, were used. The same report was the source of the prices for the Islamic Republic of Iran in 2013.
The simple average of the average prices (Central Asia, Islamic Republic of Iran and Pakistan) was used for estimating the value of exported opiates. It should be noted that price information obtained from all three countries has strong limitations and needs to be improved in order to enhance the reliability of the estimate.
7.3.5 Estimation of domestic consumption
In 2009, the Ministries of Health and Counter Narcotics, in collaboration with UNODC, implemented an extensive national drug use survey in Afghanistan, |31| in which the number of opium and heroin users in the country was estimated to be 230,000 (210,000-260,000) and 120,000 (110,000-140,000), respectively. These numbers account for poly-drug use, i.e. one person is counted in both groups if using both opium and heroin.
The report provides information on the numbers of days that both groups consume the drugs. This information, together with the average amount spent on each drug per day, can be used to calculate the total amount spent on opium and heroin in Afghanistan in a given year. This total amount divided by the average end-consumer price gives the total quantity consumed. As there were no end-consumer prices available for 2009, the earliest (and lowest) data available, which was the price average of October 2010, was used. The price of 1 kilogram of heroin was reported to be US$ 6,300 and of 1 kilogram of opium to be US$ 530. Combining the price data with the other estimates yields the results shown in the following table.
Table 16: Domestic opiate market, 2009
Days consumed, 2009* Total expenditure (US$), 2009 Total consumption (tons) Average daily consumption (grams) Opium 58,045,000 92,872,000 175 3 Heroin/ Morphine 34,142,000 75,113,000 12 0.4 *Source: Ministry of Counter Narcotics/Ministry of Health/UNODC: Drug Use in Afghanistan: 2009 Survey.
The resulting average daily consumption is a sensible magnitude for Afghanistan and is confirmed by regular non-representative use surveys undertaken by MCN/UNODC among heavy users in Afghanistan. It should be noted that there are indications that the quality of heroin/morphine at street level is very poor. When multiplying these quantities consumed by current end-consumer level prices, the value of the domestic opiate market can be calculated.
Inflation is measured by a consumer price index and reflects the annual percentage change in the cost to an average consumer of acquiring a basket of goods and services.
Afghanistan has experienced high annual inflation rates in recent past years. Figure 25 shows the fluctuating annual inflation rates from 2005 to 2013, |32| which reached a low of -8% in 2009 and a high of 31% in 2008.
Figure 25: Inflation rates in Afghanistan
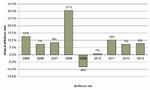
Click to enlargeSource: World Bank - World Development Indicators, retrieved November 2014.
The price-monitoring system and the annual opium surveys usually show prices and values at current prices, which means, for example, that the farm-gate value reflects the value of all opium produced in a given year at the price level in that given year. It does not take into account that the price level and thus the amount of goods and services that could be purchased for a certain amount of money has changed over the years.
Due to the availability of data, the base year is 2004 and the time period considered is from 2004 to 2013. With a 2004 base year, inflation adjustment looks at all values in terms of the purchasing power of the equivalents of local currency to 1 US$ in 2004. Inflation rates usually refer to local currencies. However, for ease of comparison, US dollar values are kept, to which the Afghan inflation rate is applied.
7.5 Assessing the risk of opium poppy cultivation in Afghanistan |33|
The work was conducted within G-SEXTANT (Service Provision of Geospatial Intelligence in EU External Actions Support), a project of the European Earth Observation (EO) programme Copernicus (previously known as GMES - Global Monitoring for Environment and Security), which combines the use of satellite images with in-situ data to deliver geospatial information services and products to a wide range of end-users. G-SEXTANT addresses specific scenarios in the context of support to EU External Action. In the context of one of the scenarios (illicit crops) the Department of Geoinformatics - Z_GIS (University of Salzburg, Austria) is supporting UNODC in developing a risk assessment approach for illicit crops (such as poppy) by integrating different key spatial indicators which determine poppy cultivation.
7.6 Environmental suitability and socio-economic vulnerability
The environmental suitability of land and climate for opium poppy cultivation depends on a range of environmental factors such as the climatic and physio-geographical characteristics of the area. Table 17 provides an overview of the four main indicators used to model environmental suitability for opium poppy cultivation in Afghanistan: land use (land cover), followed by water availability, climatic conditions and quality of soil.
Opium poppy suitability results show higher values in the plains of the northern and south-eastern parts of Afghanistan, |34| with less suitable areas being located in the mountainous and partly glaciated north-east (Hindukush) and the Wakhan corridor, the central highlands, as well as the arid Sistan Basin in the south-west. The major settlements are commonly located in areas with high levels of suitability, i.e. where the land is best suited for agricultural purposes. Examples are Lashkar Gah in Hilmand, the city of Kandahar in Kandahar and Feyzabad in Badakhshan.
Afghanistan's main poppy-growing areas in the South and West do not seem to coincide with prime land for opium poppy cultivation (in contrast to Nangarhar, for example, where cultivation takes place in highly suitable areas). This is also reflected in the strong need for irrigation in the South and the measures undertaken by farmers to make land arable (e.g. north of the Boghra canal in Hilmand).
The range of index values, as presented in map 3, shows that no single location is ideally suitable (this would equate to a value of 100, but the maximum value is 65.01) for the cultivation of opium poppy – a fact reflected in the importance of irrigation in many parts of the country. The minimum index value of 14.23 indicates that even the least suitable areas in Afghanistan have some minor potential for opium poppy cultivation, but require significant measures, such as land cover change or other intervention, to do so.
The Socio-economic vulnerability model considers nine |35| indicators to describe social and socioeconomic vulnerability to opium poppy cultivation. Table 20 lists the indicators used together with the respective expert weight, data source and reference for choosing the indicator.
The vulnerability results display higher values in central and southern parts of Afghanistan, as well as in the north-east. Since the index is composed of multiple indicators, the reason for these higher values can differ considerably. However, areas with high levels of conflict, a lack of alternative employment opportunities and low levels of accessibility (most often rural areas) can be considered significant drivers of opium cultivation. High vulnerability coincides with less security (e.g. Hilmand province), and the least developed parts of the country, e.g. in the Northeast of Badakhshan. The lowest levels (meaning the smallest degree of vulnerability) appear in the north of the country in the provinces of Balkh, Samangan and Kunduz, as well as in the area surrounding Kabul.
7.6.1 Data and expert group weighing
The conceptual framework used is based on an inductive modelling approach, meaning that the choice of indicators used to model risk of opium poppy cultivation are based on a conceptual framework defining and justifying the risk approach, as well as a thorough literature research and expert opinion. Due to the a lack of empirical evidence of relationships among different factors (especially for the socio-economic dimension) the indicators were weighted by a group of experts using the analytical hierarchy process (AHP) method in order to incorporate the relative importance of the indicators in the model. A validation of the modelled results was conducted using the available dataset of locations where opium poppy is known to be cultivated.
The modelling of risk to opium poppy cultivation relies on a set of indicators. The selection process is based on expert opinion and literature review to identify relevant factors that are known to contribute to the cultivation of opium poppy in Afghanistan. This results in an ideal first set of indicators to be used to model risk. Depending on data availability and/or the adequacy of the data to represent the respective factors as proxies, the final indicator list is developed.
Indicators of poppy suitability
Table 17: Properties of indicators of poppy suitability
No Indicator Proxy Expert Weight Attributes/ Categories Resolution/ Scale Data sources References S1 Land use Land cover 0.41 Weighting of land cover classes 300 m Globcover & UNODC agricultural areas UNODC 2011 S2 Water availability Location on water canal 0.28 Water channel density, weighted by Strahler stream order 90 m SRTM Mansfield & Pain 2007, Pain 2007, Mansfield 2008, Rout 2008 S3 Climate Eco-crop model
(FAO)
0.22 Temperature (min, max) Precipitation 30 arc seconds WorldClim - Global Climate Data Sader 1990, Simon et al. 1984, Lim 2013 S4 Soil HWSD 0.11 Weighting of FAO-74 soil classification system 10 arc minutes Harmonized World Soil Database (FAO-74 Soil Map) Pain 2007, Simon et al. 1984 The ability to cultivate opium poppy (papaver somniferum) is dependent on a range of environmental factors such as the prevailing climatic and physio-geographical characteristics of the area. Table 17 provides an overview of the four indicators used to model the environmental suitability in Afghanistan. The factor considered most influential by experts is land cover (0.41 -the sum of the weights equals 1.0), followed by water availability and climatic conditions, respectively. This is confirmed by other studies, such as a similar analysis previously carried out by UNODC (2011) for Myanmar.
For the land cover indicator (S1), the 300 m spatial resolution Globcover |36| dataset was used in combination with the detailed agricultural areas which were mapped on-screen by UNODC using high-resolution satellite imagery. The land cover indicator is often used as a proxy for the utilization of land and aims to reflect the suitability of the land to grow poppy in terms of its physical characteristics. The agricultural areas include irrigated fields and grasslands/croplands. Due to their greater accuracy, the agricultural areas were attributed more significance (so as to be adequately represented in the course-scaled data used for modelling) and combined with the Globcover dataset, thereby increasing the quality of the land cover indicator considerably. More precisely, a rule-based approach for the integration of the UNODC agricultural areas with the Globcover dataset was used (Tiede, 2014). If the agricultural areas covered more than 25% (of a Globcover pixel, the Globcover pixel was attributed the value of the agricultural area. That is to say, that if the 0.09km2 area (pixel size) of a particular Globcover unit included a considerable amount (more than 25%) of a very suitable land cover class, as mapped by UNODC, then this pixel should reflect (and not hide) that reality. In this way, the detailed information provided by UNODC on the most suitable agricultural areas is integrated into the Globcover dataset. The following step is the weighting of the land cover classes using the AHP weighting method. Each class, as shown in table 20, thus receives a weight ranging between 0 and 100, depending on its perceived suitability and potential for opium poppy cultivation. The land cover dataset is thus reclassified to the values of the AHP results (Irrigated croplands receives the value 100). The resampling to 10 km uses an aggregation method, which calculates the sum of the values within each 10 km pixel, which thus represents the average suitability of each pixel.
Table 18: AHP-Weightings for land cover (H1)
Land cover class Weighting Irrigated croplands 100.0 Rain-fed croplands 73.4 Mosaic croplands/vegetation 50.9 Mosaic vegetation/croplands 45.7 Closed to open broadleaved evergreen or semi-deciduous forest 8.9 Closed broadleaved deciduous forest 4.7 Closed needle-leaved evergreen forest 5.0 Closed to open mixed broadleaved and needle-leaved forest 8.6 Mosaic forest-shrubland/grassland 11.4 Mosaic grassland/forest-shrubland 13.2 Closed to open shrubland 17.3 Closed to open grassland 26.2 Sparse vegetation 31.8 Artificial areas 0.3 Bare areas 26.5 Water bodies 0.0 Permanent snow and ice 0.0 Water availability/scarcity (S2) is a major issue in the predominantly dry, continental climate of Afghanistan, although opium poppy can survive with minimal amounts of rainfall. Pain (2007), Mansfield & Pain (2007) and Mansfield (2008) discussed the impact of water management systems in Afghanistan on the spread of cultivation of opium poppy, highlighting the availability of water as a key determinant. Opium poppy is typically cultivated with the support of irrigation systems when possible; according to Rout (2008) approximately 42% of the country's cultivable area is intensively or intermittently irrigated, primarily within the fertile valleys in close proximity to rivers. In order to incorporate the importance of irrigation for the cultivation of crops in Afghanistan, the stream network was delineated from the NASA Shuttle Radar Topographic Mission (SRTM) digital elevation model |37|. The proximity to streams and rivers was derived in a second step, whereby the size of a river or stream was considered to approximate the irrigation capacity in each respective valley (using the Strahler stream order). This water availability indicator was considered by experts to be highly relevant for the model and was attributed a relative weight of 0.28.
The ECOCROP database |38| and model developed for DIVA-GIS |39| was used to locate suitable areas for cultivation based on the climatic thresholds for papver somniferum |40| (S3). The results are based on monthly temperature (Tmin, Tmax) and precipitation values of the WorldClim database. The importance of a suitable climate for successful yields is apparent, as papver somniferum is frost sensitive and requires dry, warm weather during capsule ripening (Sader 1990; Simon et al. 1984). The growing period is therefore dependent on appropriate temperatures, which influences harvest times: July in the mountainous northeast of Afghanistan; May in the south.
Table 19: ECOCROP Model parameters for climate suitability (S3)
ECOCROP Model Parameters Species: Opium poppy - Papaver somniferum L. Climate variables: temperature and precipitation Minimum days of growing season: 135 Maximum days of growing season: 210 Absolute average minimum temperature (�C) that kills plant: -5 Minimum average temperature (�C) at which the plant will grow: 3 Minimum average temperature (�C) at which the plant will grow optimally: 15 Maximum average temperature (�C) at which the plant will grow optimally: 24 Maximum average temperature (�C) at which the plant will cease to grow: 35 Minimum rainfall (mm) during the growing season: 0 Optimal minimum rainfall (mm) during the growing season: 400 Optimal maximum rainfall (mm) during the growing season: 1200 Maximum rainfall (mm) during the growing season:1700 As a fourth environmental suitability indicator we integrated information on soils (S4). Optimal soils for opium poppy are rich and well drained and can be moderately acidic to alkaline, with an optimal pH of 6.0 (Lim 2013). Due to the limited availability of high-resolution and quality soil data, the Harmonized World Soil Database (HWSD) |41| was used to classify the soil suitability according to the properties of the FAO soil units (1974). Soil characteristics were weighted with a relatively low score by the experts (0.11).
Indicators of socio-economic vulnerability
Table 20: Properties of indicators of socio-economic vulnerability
No. Indicator Proxy Expert Weight Attributes/ Categories Resolution/ Scale Data Source References V1 Lack of governance Recognition of governor authority 0.10 0,1 Interpolated points AOPS (20102013) Goodhand 2005, Mansfield & Pain 2007 Mansfield 2005 V2 Lack of stability Conflict incidents 2004-2010 0.15 Incidents Interpolated points ACLE D Goodhand 2005, SPIEGEL V3 Peripheral regions GRUMPv1 0.11 Centrality 30 arc-seconds GRUM Pv1 Mansfield 2006, 2008 V4 Lack of accessibility JRC Global Accessibility 0.15 Travel time 30 arc-seconds Nelson, A. (2008) Mansfield & Pain 2007 V5 Lack of alternatives Off-farm employment opportunities 0.15 0,1 Interpolated points AOPS (20102013) Mansfield & Pain 2007 V6 Lack of education Access to schools and/or vocational training facilities 0.06 0-3 Interpolated points AOPS (20102013) Mansfield 2007 V7 Lack of awareness Agricultural assistance and initiatives to convince farmers not to cultivate opium 0.11 0,1 Interpolated points AOPS (20112012) UNODC 2013 V8 Credit availability Advanced payments for poppy cultivation 0.09 0,1 Interpolated points AOPS (20102013) UNODC 2013 Mansfield & Pain 2007 Mansfield 2004 Goodhand 2005 V9 Poverty Average daily wages of labour and wheat harvesting 0.08 AFG/ PRS Interpolated points AOPS (20102013) Mansfield & Pain 2007 Six of the nine socio-economic indicators of the vulnerability of the population to the cultivation of opium poppy are based on the Afghanistan opium poppy surveys (AOPS) conducted by MCN and UNODC between 2010 and 2013. More than 14,000 villages were surveyed in this period of four years, providing a substantial basis for the development of appropriate and spatial indicators. The point data (x, y co-ordinates of villages) were interpolated using the inverse distance weighting (IDW) model within a GIS environment in order to generate continuous spatial data. Additionally, the incidents data, i.e. the conflict data (Armed Conflict Location & Event Data Project - ACLED) |42| and the GRUMP settlement points |43| (Global Rural-Urban Mapping Project), were interpolated using a kernel density function.
The indicator "lack of governance" (V1) is a complex construct, aiming to reflect the ability of the governing authority to enforce the illegality of opium poppy cultivation. Areas under government control are considered to be more stable and law-abiding than those areas where the governing authority is not recognized. Goodhand (2005) discussed the interconnections between opium poppy cultivation, on the one hand, and warlords, the Taliban and the State, on the other, emphasizing that the post-Taliban environment has created a power vacuum, which empowers warlords with greater autonomy. In addition, Mansfield (2005) suggests that the increasing influence in the south of the Taliban, who "sympathize" with the plight of resource-poor land owners, has led to a steady rise in opium poppy cultivation, which is difficult to control due to the absence of security. A lack of confidence in the governing authorities, particularly by the rural population as described in Mansfield and Pain (2007), can be ascribed to perceived corruption and the belief that counter narcotic measures are simply targeting the assets of the poor.
The lack of governance is perhaps somewhat connected to the indicator "lack of stability" (V2), which relies on the conflict incidents between 2004 and 2010 as recorded by the ACLED data. The hypothesis here is that less stable areas are more vulnerable to poppy cultivation. This again is verified by local studies, such as that of Goodhand (2005), who even suggests that struggles between warlords related to the control of trade routes and markets can often be a reason for conflicts. The fact that the area of cultivation in the province of Badachschan increased by 25% following the deployment of foreign military troops there, underlines the impact of stability on cultivation.
Mansfield (2008, p. 4) asserts that proximity to the provincial capital provides "better access to commodity markets for the purchase and sale of agricultural and non-agricultural goods, as well as labour markets for daily wage labour opportunities and perhaps salaried employment. Those areas nearest the provincial centre may have better physical security and are more likely to benefit from better social and physical infrastructure, as well as, in the case of Nangarhar, a more diverse population in terms of tribes and ethnic groups, making it easier for the provincial authorities to impose their will. These insights mean that areas closer to major settlements are likely to be less vulnerable than peripheral regions. The "peripheral regions" indicator (V3) is closely linked to the accessibility to off-farm employment opportunities, a factor which is represented by both the "lack of accessibility" (V4) and the "lack of alternatives" (V5) indicators. Although all three indicators are intrinsically tied, each relies on independent and very different data sources, thus legitimizing their inclusion.
Social indicators such as lack of educational facilities (V6), awareness (V7) or alternatives to on-farm employment (V5) serve as a means of understanding the social context. Higher educational standards and facilities for vocational training serve to curb the way for an improved socioeconomic development of a region. The AOPS questioned whether or not alternative income opportunities were available in the area (V5). It has often been stated (Mansfield 2004, Goodhand 2005, Mansfield & Pain 2007) that farmers have little choice but to cultivate opium poppy to sustain their livelihoods. Awareness campaigns (V7), i.e. whether or not agricultural assistance was received and/or initiatives were made to convince farmers not to cultivate opium poppy, play an important role in decreasing the cultivation of opium poppy, as is reasoned in the Opium Risk Assessment (2013 p. 1): "villages which had been reached by anti-poppy awareness campaigns were significantly less likely to grow poppy".
Economic indicators provide supplementary input to the vulnerability framework. Access to advanced payments for poppy cultivation (V8) is a major incentive for farmers to cultivate, given the need for capital to ensure survival: "Farmers grow poppy [...] secondly because it provides access to land and credit" (Goodhand 2005, p. 207). The average daily wages of construction and wheat harvesting serve as a proxy for poverty (V9). The hypothesis here is that low income areas are more susceptible to opium poppy cultivation due to the high differential between current wages and wages that could be earned in opium poppy cultivation. The daily wages, while unable to capture all forms of income, especially in areas where opium is grown, are nonetheless an adequate approximation of economic well-being since opium production tends to cause wages across industries to rise.
The vulnerability indicators were also weighted using the AHP-weighting method by the same group of experts. The results of the weightings (see table 20) show that all indicators are considered to be important, i.e. no single indicator is favoured significantly more than the others. The three indicators related to stability, alternative forms of employment and accessibility were, however, attributed with the highest weights (0.15 respectively). In contrast, access to educational facilities was considered least important (0.06).
7.6.2 Methods
The assessment of the risk of opium poppy cultivation was based on a specific approach designed to model latent, spatial and multi-dimensional/complex phenomena. The methodology used for the modelling of risk builds on the concept of integrated geons, which are defined as integrative (due to the integration of multiple indicators), homogenous spatial objects, in terms of their underlying policy-relevant indicators (Lang et al, 2014; Kienberger & Hagenlocher 2014). The advantage of using geons as reporting units compared to administrative boundaries or a continuous grid is the process-oriented presentation of results as well as its spatial-explicitness in conjunction with unique characteristics for each region. While the risk of opium poppy can be dependent on administrative boundaries due to provincial policy differences, most factors are unrelated to political constructs. The use of geons allows homogenous regions to be identified, for which tailored (trans-border) interventions can be developed. Furthermore, geons can also be characterised through specific metrics and measures, which allow the multi-dimensionality of a phenomena to be integrated, while simultaneously decomposing the underlying phenomena into the respective components. Thus geons do not mask out spatial variations within provinces, as is the case when aggregating results to administrative units, but rather provide policy-relevant, workable regions for intervention development and implementation as well as monitoring of trends.
The methodology of the risk assessment follows a four-point procedure, beginning with (1) the definition of the conceptual framework, which includes defining the risk concept and identifying relevant indicators of the vulnerability and suitability domains. A thorough desk study of recent, thematically-relevant literature is indispensable at this stage, as are expert consultations, which took place on multiple occasions at UNODC, Vienna. Since the deductive approach used for this assessment relies on expert knowledge, whether indirect through secondary sources, or direct through consultations, the indicator development can be seen as a maturing process, requiring frequent adjusting, due to limitations such as the saliency, credibility and legitimacy of the proposed initial indicator set and particularly data availability. (2) The second step includes the finalization of the indicator set to render a dataset that can be subsequently used for modelling. During this stage, the data is pre-processed (including the interpolation of point data using either inverse-distance weighting (IDW) or kernel density for incidents data) and resampled to the 10 x 10 km2 resolution (based on the UNODC sampling grid). The original indicator values are then normalized through a linear min-max function to allow comparison/aggregation and tested for multicollinearity to ensure the indicators are independent and avoid double counting. (3) The third step includes the modelling of the three components: vulnerability, environmental suitability and the risk of opium poppy cultivation. Prior to the modelling, the indicators were weighted by experts using the AHP pairwise weighting method. In this way, factors that are considered to be more/less important than others are attributed with greater/lower weightings. Finally, the homogeneous regions are delineated using a multi-resolution segmentation method (Baatz & Schape, 2000) and automatically parameterized through a statistical analysis of the input layers (Dragut et al., 2014), which takes into account the expert weights. The vulnerability and suitability indices are calculated using the vector magnitude of the respective indicators, reflecting its distance within an n-dimensional indicator (feature) space. It should be noted that, due to the vector magnitude, a change among the higher indicator values impacts the index higher than a change within the lower values. The vulnerability and suitability indices are combined into a risk index using the geometric mean, which ensures that the contribution of the lower value of the two is retained (i.e. if either the suitability or vulnerability equates to zero, the total risk is also zero). Lastly, in the fourth stage of the methodology, the results are visualized using pie/bar charts in order to explore the relative contributions of the indicators to the final scores.
7.6.3 References
- Baatz, M., and Schäpe, A. (2000). Multiresolution Segmentation - an optimization approach for high quality multi-scale image segmentation. In J. Strobl, T. Blaschke, & G. Griesebner (Eds.), Angewandte Geographische Informationsverarbeitung (pp. 12-23). Heidelberg: Wichmann-Verlag.
- Center for International Earth Science Information Network - CIESIN - Columbia University, International Food Policy Research Institute - IFPRI, The World Bank, and Centro Internacional de Agricultura Tropical - CIAT (2011): Global Rural-Urban Mapping Project, Version 1 (GRUMPv1): Urban Extents Grid. Palisades, NY: NASA Socioeconomic Data and Applications Center (SEDAC).
- Dragut, L., Csillik, O., Eisank, C., Tiede, D., 2014. Automated parameterisation for multi-scale image segmentation on multiple layers. ISPRS Journal of Photogrammetry and Remote Sensing 88, 119-127.
- Mansfield, D. (2004): What is Driving Opium Poppy Cultivation? Decision Making Amongst Opium Poppy Cultivators in Afghanistan in the 2003/4 Growing Season. Paper for the UNODC/ONDCP Second Technical Conference on Drug Control Research, 19-21 July 2004. Kienberger, S. and Hagenlocher, M. (2014): Spatial-explicit modeling of social vulnerability to malaria in East Africa. International Journal of Health Geographics, 13, 29.
- Lang, S., Kienberger, S., Tiede, D., Hagenlocher, M., and Pernkopf, L., (2014): Geons - domain-specific regionalization of space. Cartography and Geographic Information Science, 41 (3): 214-226. http://dx.doi.org/10.1080/15230406.2014.902755.
- Lim, T.K. (2013): Edible Medicinal and Non-Medicinal Plants. Volume 5, Fruits. Springer, 943 p.
- Mansfield, D. (2005): Exploring the "Shades of Grey": An Assessment of the Factors Influencing Decisions to Cultivate Opium Poppy in 2005/06. A Report for the Afghan Drugs Inter Departmental Unit of the UK Government.
- Mansfield, D., and Pain, A. (2007): Evidence from the field: Understanding changing levels of opium poppy cultivation in Afghanistan. Briefing Paper. Kabul: Afghanistan Research and Evaluation Unit.
- Mansfield, D. (2008): Water Management, Livestock and the Opium Economy. Resurgence and Reductions: Explanations for Changing Levels of Opium Poppy Cultivation in Nangarhar and Ghor in 2006-07. Kabul: AREU.
- Nelson, A. (2008) Estimated travel time to the nearest city of 50,000 or more people in year 2000. Global Environment Monitoring Unit - Joint Research Centre of the European Commission, Ispra Italy.
- Pain, A. (2007): Water Management, Livestock and the Opium Economy: The Spread of Opium Poppy Cultivation in Balkh. Kabul: AREU.
- Rout, B. (2008): Water Management, Livestock and the Opium Economy. How the Water Flows: A Typology of Irrigation Systems in Afghanistan. Kabul, AREU.
- Sader, S.A. (1990): Remote Sensing of Narcotic Crops with special reference to techniques for detection and monitoring of poppy production in Afghanistan. [Online] July 10, 2014: http://pdf.usaid.gov/pdf_docs/PNABT431.pdf.
- Simon, J.E., Chadwick, A.F., and Craker, L.E. (1984): Herbs: An Indexed Bibliography. 19711980. The Scientific Literature on Selected Herbs, and Aromatic and Medicinal Plants of the Temperate Zone. Archon Books, 770 pp., Hamden, CT.
- Tiede, D., 2014. A new geospatial overlay method for the analysis and visualization of spatial change patterns using object-oriented data modeling concepts. Cartography and Geographic Information Science 41, 227-234.
- UNODC (2011): Statistical analysis of risk factors for opium poppy growing in Myanmar. Analysis with logistic and decision-tree models. United Nations Office for Drugs and Crime, Vienna, June 2011.
[Source: United Nations Office on Drugs and Crime - UNODC, Ministry of Counter Narcotics of the Islamic Republic of Afghanistan, Mar15]
Abbreviations
AGE Anti-Government elements ANP Afghan National Police CNPA Counter Narcotics Police of Afghanistan GLE Governor-led eradication ICMP Illicit Crop Monitoring Programme (UNODC) ISAF International Security Assistance Force MCN Ministry of Counter-Narcotics UNODC United Nations Office on Drugs and Crime
Notes:
1. Numbers in brackets indicate the upper and lower bounds of the estimation range. [Back]
2. Poppy-free provinces are those estimated to contain less than 100 hectares of opium cultivation. [Back]
3. Provinces estimated to contain more than 100 hectares of opium cultivation. [Back]
4. Refers to oven-dry opium. [Back]
5. Relation to nominal GDP of the respective year. Source: Government of Afghanistan, Central Statistical Office. [Back]
6. Income figures are indicative only as they do not include all expenditure and income components associated with opium cultivation. [Back]
7. Production reached its peak in 2007. [Back]
8. Average size of loan calculated for farmers with a current loan. [Back]
9. Based on David Mansfield, The Economic Superiority of Illicit Drug Production: Myth and Reality. Opium Poppy Cultivation in Afghanistan.; 2002; available at www.davidmansfield.org/field_work.php. [Back]
10. The respective Pearson correlation coefficient is without time lag -0.337, with opium production values being one year ahead -0.583; with two years -0.541. The year 2001 (Taliban opium ban has been excluded from the analysis). [Back]
11. MCN, Afghanistan Drug Report 2012, p. 62. [Back]
12. Inflation rates are presented in the methodology section. [Back]
13. Nominal GDP. Source: Government of Afghanistan, Central Statistical Office. [Back]
14. Please note, that these were adapted in the Afghanistan Opium Survey 2010; in 2010, 2.4 litres per kilogram were used for the calculations. [Back]
15. Calculated with the updated conversion ratio from opium to heroin of export quality of 9.6:1. [Back]
16. MCN/UNODC Afghanistan Drug Price Monitoring. [Back]
17. The expenditure on wheat reported by farmers was used for calculating the net income instead of a proportional estimate of cultivation costs as in 2012. [Back]
18. Farmers annual income of 2012 had to be revised. The numbers therefore differ from the ones published in the Afghanistan Opium Survey 2013. [Back]
19. The survey relies on reported income, which is difficult to measure. While the absolute income figures reported may not always be reliable or complete, the proportions of different income sources are thought to be reliable enough to understand their relative importance and general differences between opium-growing and non-growing households at an aggregated level. Income in this context refers to the value of all products produced or cash income received in the previous 12 months, including products used for own consumption, such as wheat. [Back]
20. Average size of loan calculated for farmers with current loan. [Back]
21. E.g. Mansfield, D., and Pain, A. (2007): Evidence from the field: Understanding changing levels of opium poppy cultivation in Afghanistan. Briefing Paper. Kabul: Afghanistan Research and Evaluation Unit; Mansfield, D. (2005): Exploring the "Shades of Grey": An Assessment of the Factors Influencing Decisions to Cultivate Opium Poppy in 2005/06. A Report for the Afghan Drugs Inter Departmental Unit of the UK Government.Goodhand, J. (2005) Frontiers and Wars: the Opium Economy in Afghanistan, Journal of Agrarian Change Volume 5, Issue 2. [Back]
22. In cooperation with Department of Geoinformatics - Z_GIS, University of Salzburg, Austria, with acknowledgement to G-SEXTANT (Service Provision of Geospatial Intelligence in EU External Actions Support), a project of the European Earth Observation (EO) program Copernicus. [Back]
23. Available at: www.uni-salzburg.at/zgis. [Back]
24. The method used for modelling risk generates homogenous areas of similar characteristics. These areas are independent of administrative boundaries, such as district or province boundaries. The reasoning behind this approach is that while the risk of opium poppy can be dependent on administrative boundaries due to political or societal differences, many factors are unrelated to administrative units. The choice of the specific indicators used has been based on insights from previous opium poppy surveys, as well as related literature and expert opinions. [Back]
25. See UNODC (2009): World Drug Report 2009, p. 61, where evidence from the forensic laboratory of CNPA is presented confirming the use of various cutting agents in Afghanistan in 2008. [Back]
26. For details see Afghanistan Opium Survey 2014: Cultivation and Production, pp. 35. Available at: www.unodc.org/documents/crop-monitoring/Afghanistan/Afghan-opium-survey-2014.pdf. [Back]
27. Counter Narcotics Police of Afghanistan, Forensic Laboratory/UNODC (2008): Laboratory Information Bulletin 12/2008 (LIB IV/2008). http://www.unodc.org/pdf/scientific/LIB%20IV-2008_Kabul-.pdf. [Back]
28. See Afghanistan Opium Survey 2014: Cultivation and Production, pp. 35. [Back]
29. Ministry of Counter Narcotics/Ministry of Health/UNODC: Drug Use in Afghanistan: 2009 Survey. (http://www.unodc.org/documents/data-and-analysis/Studies/Afghan-Drug-Survey-2009-Executive-Summary-web.pdf). [Back]
30. Ministry of Counter Narcotics and UNODC: Afghanistan Opium Price Monitoring, 2012. [Back]
31. Ministry of Counter Narcotics/Ministry of Health/UNODC: Drug Use in Afghanistan: 2009 Survey (in print). [Back]
32. Source: World Bank, World Development indicators; retrieved November 2014. [Back]
33. Department of Geoinformatics - Z_GIS, University of Salzburg, Austria, with acknowledgement to G-SEXTANT (Service Provision of Geospatial Intelligence in EU External Actions Support), a project of the European Earth Observation (EO) program Copernicus (previously known as GMES - Global Monitoring for Environment and Security) funded by the European Union. [Back]
34. See Environmental suitability to poppy cultivation map, section 5.3. [Back]
35. Six of the nine socio-economic indicators for vulnerability to the cultivation of opium poppy are based on the Afghanistan opium poppy surveys (AOPS) conducted by MCN and UNODC between 2010 and 2013. More than 14,000 villages were surveyed in this four-year period, providing a substantial basis for the development of appropriate and spatial indicators. [Back]
36. ESA GlobCover Version 2.3 2009. [Back]
37. Available at: www.cgiar-csi.org/data/srtm-90m-digital-elevation-database-v4-1. [Back]
38. Available at: http://ecocrop.fao.org/ecocrop/srv/en/home. [Back]
39. Available at: www.diva-gis.org/. [Back]
40. Available at: http://ecocrop.fao.org/ecocrop/srv/en/cropView?id=8296. [Back]
41. Available at: www.iiasa.ac.at/web/home/research/modelsData/HWSD/HWSD.en.html. [Back]
42. Available at: www.acleddata.com/. [Back]
43. Available at: http://sedac.ciesin.columbia.edu/data/set/grump-v1-settlement-points. [Back]
Corruption and organized crime
 | This document has been published on 05Nov15 by the Equipo Nizkor and Derechos Human Rights. In accordance with Title 17 U.S.C. Section 107, this material is distributed without profit to those who have expressed a prior interest in receiving the included information for research and educational purposes. |