| Information |  | |
Derechos | Equipo Nizkor
| ||
| Information | | |
Derechos | Equipo Nizkor
| ||
Nov14
Afghanistan: Opium Survey 2014
Cultivation and Production
Back to topCONTENTS
Key Findings
Fact Sheet Afghanistan Opium Survey 20143.1 Poppy Eradication Decreased by 63% in 2014
3.2 Quality Control of Reported Eradication with Satellite Images4 Potential Opium Yield and Production
4.1 Potential Opium Yield and Production Increased in 2014
4.2 Potential Heroin Production in Afghanistan5 Opium Prices and Farm-Gate Value of Opium
6.1 Estimation of Area under Opium Cultivation
6.2 Satellite Image Interpretation
6.3 Opium Yield and Production
6.4 Verification of Governor-Led Eradication (GLE)
6.5 Average Farm-Gate Price and Farm-Gate Value of Opium ProductionANNEX I: Opium Poppy Cultivation per Province, 2002-2013 (Hectares)
ANNEX II: Indicative District Level Estimates of Opium Cultivation, 2002-2014 (Hectares)
ANNEX III: Eradication Figures, by District (2014)
LIST OF FIGURES
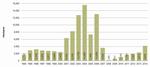
Figure 1: Opium cultivation in Afghanistan, 1994-2014 (Hectares)
Figure 2: Opium cultivation in Nangarhar province, 1994-2014 (Hectares)
Figure 3: Opium cultivation in Laghman, Kunar, Nuristan and Kapisa provinces, 1994-2014 (Hectares)
Figure 4: Opium cultivation in Badakhshan province, 1994-2014 (Hectares)
Figure 5: Opium cultivation in the Northern region, 2004-2014 (Hectares)
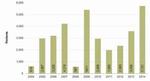
Figure 6: Opium cultivation in Zabul province, 2002-2014
Figure 7: Opium cultivation in Hilmand, Kandahar and Uruzgan provinces, 2004-2014 (Hectares)
Figure 8: Opium cultivation in Badghis province, 2004-2014 (Hectares)
Figure 9: Opium cultivation in Farah province, 1994-2014 (Hectares)
Figure 10: Percentage of total opium poppy eradication, by province, 2013-2014
Figure 11: Area of opium poppy eradication, by different methods, 2013-2014 (Percentage of total)
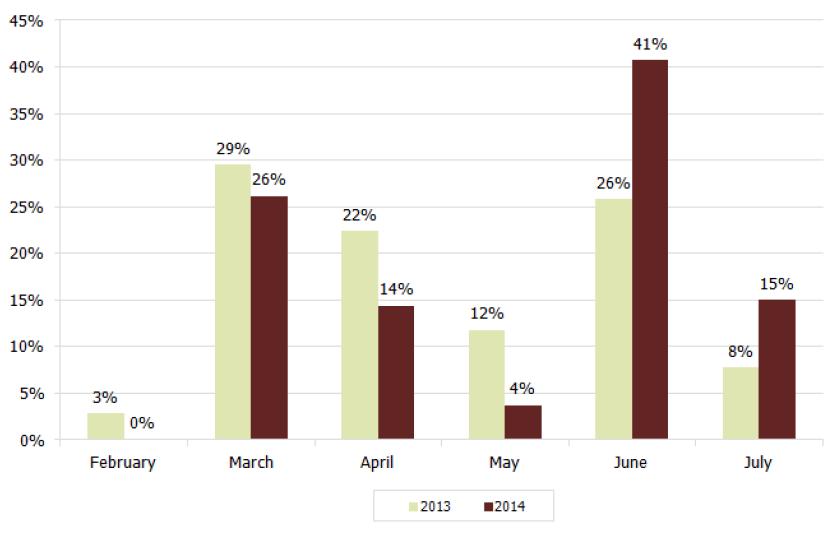
Figure 12: Area of opium poppy eradication, per month, 2013-2014 (Percentage of total)
Figure 13: Potential opium production in Afghanistan, 1997-2014 (Tons)
Figure 14: Morphine content (%) of all samples analysed between 2000 and 2012, with linear trend line
Figure 15: Average morphine content (%) in Afghan samples of oven-dry opium gum, 2000-2012
Figure 16: Simplified flow chart illustrating the main stages of processing pure heroin base from opium
Figure 17: Photographs of yield survey 2014
Figure 18: Regional average price of dry opium reported by traders, January 2005 to August 2014 (US dollars per kilogram)
Figure 19: Monthly prices of dry opium in Kandahar and Nangarhar province, as collected from March 1997 to August 2014 (US dollars per kilogram)
Figure 20: Farm-gate value of opium production in Afghanistan, 2008-2013 (Million US dollars)
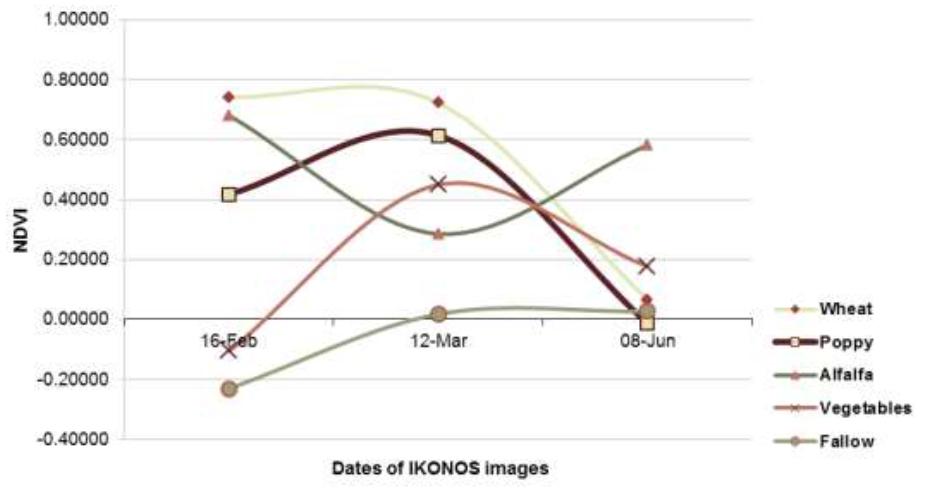
Figure 21: Spectral reflectance of opium poppy and other crops
Figure 22: Image classification methodology for estimating opium cultivation area
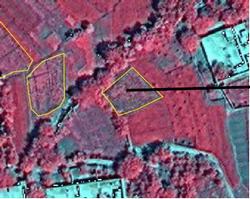
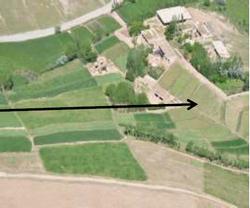
Figure 23: Use of geo-referenced ground photos for image interpretation
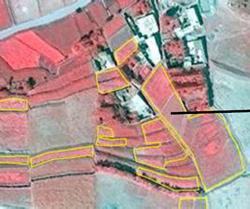
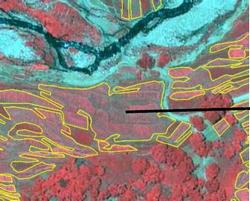
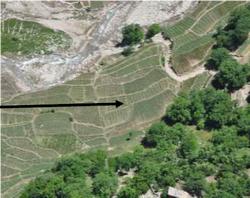
Figure 24: Use of aerial photos for image interpretation
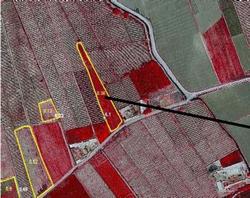
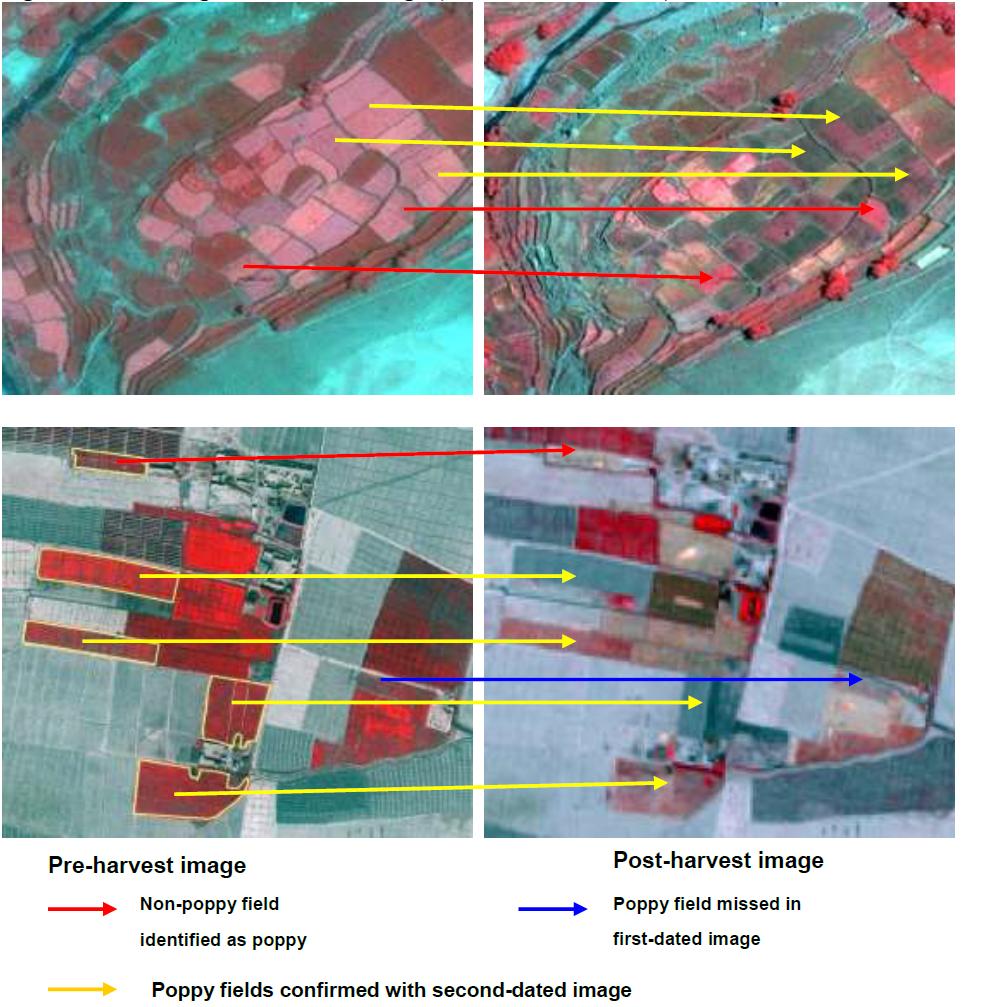
Figure 25: Advantage of two-dated images, Kabul and Kandahar, 2009
List of Tables
Table 1: Regional distribution of opium cultivation, 2013-2014 (Hectares)
Table 2: Number of provinces by opium cultivation trends, 2006-2014
Table 3: Main opium-cultivating provinces in Afghanistan, 2007-2014 (Hectares)
Table 4: Opium cultivation (2010-2014) and eradication (2013-2014) in Afghanistan (Hectares)
Table 5: Opium cultivation and eradication in the Central region, 2011-2014 (Hectares)
Table 6: Opium cultivation and eradication in the Eastern region, 2011-2014 (Hectares)
Table 7: Opium cultivation and eradication in the North-eastern region, 2011-2014 (Hectares)
Table 8: Opium cultivation and eradication in the Northern region, 2011-2014 (Hectares)
Table 9: Opium cultivation and eradication in the Southern region, 2011-2014 (Hectares)
Table 10: Poppy cultivation inside and outside the former Hilmand "Food Zone", 2012-2014
Table 11: Opium cultivation and eradication in the Western region, 2011-2014 (Hectares)
Table 12: Governor-led eradication, by province, 2014
Table 13: Governor-led eradication, 2013-2014 (Hectares and percentage change)
Table 14: Poppy eradication and cultivation in Afghanistan, 2007-2014 (Hectares)
Table 15: Start and end dates of Governor-led eradication (GLE), 2014
Table 16: Opium yield, by region, 2013-2014 (Kilograms per hectare)
Table 17: Opium production in Afghanistan 2009-2014, by province (Tons)
Table 18: Potential opium production, by region, 2013-2014 (Tons)
Table 19: Potential opium production, by region, with ranges, 2014 (Tons)
Table 20: Conversion ratios of opium to pure heroin base corresponding to various morphine contents and a laboratory efficiency of 34% (Kilograms of raw opium needed to produce a kilogram of pure heroin base)
Table 21: Updated conversion ratio of opium to pure heroin base (Kilograms of raw opium needed to produce a kilogram of pure heroin base)
Table 22: Heroin purities at the wholesale level, as reported by selected countries
Table 23: Amount of opium needed to produce a kilogram of heroin base of export quality (52% purity) with opium of 12.3% morphine content and 34% laboratory efficiency (Kilograms of raw opium needed to produce a kilogram of pure heroin base)
Table 24: Potential heroin production from Afghan opium, 2014
Table 25: Regional farm-gate prices of dry opium at harvest time, reported by farmers through the price-monitoring system, 2013-2014 (US dollars per kilogram)
Table 26: Dry opium prices reported by traders, by region, August 2013-August 2014 (US dollars per kilogram)
Table 27: Area estimation method, by province, 2014
Table 28: Sample size, agricultural land and sampling ratio, by province, 2014
Table 29: Area estimates of sample provinces with 95% confidence interval, 2014 (Hectares)
Table 30: Regional opium yield values with 95% confidence intervals, 2014 (Kilograms per hectare)
Table 31: Yield survey villages and fields surveyed (all data), 2009-2014
Table 32: Proportions of opiate seizures in Afghanistan and neighbouring countries (Percentage)
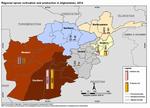
- The total area under opium poppy cultivation in Afghanistan was estimated at 224,000 hectares in 2014, a 7% increase from the previous year.
- The vast majority (89%) of opium cultivation took place in nine provinces in Afghanistan's Southern and Western regions, which include the country's most insecure provinces.
- Hilmand remained Afghanistan's major opium-cultivating province, followed by Kandahar, Farah, and Nangarhar.
- Opium cultivation increased in most of the main poppy-cultivating provinces, but stabilized in Hilmand itself (+3%).
- Interestingly, differing trends could be observed in Hilmand. Inside the former "Food Zone" (an alternative livelihood programme), opium cultivation increased by 13% in 2014 (to 41,089 hectares from 36,244 hectares in 2013). However, outside the former Food Zone, where the increases in poppy cultivation seen in previous years were mainly achieved through artificial irrigation, the area under poppy cultivation decreased slightly.
- Total eradication of opium poppy decreased by 63% in 2014, to 2,692 hectares.
- Average opium yield amounted to 28.7 kilograms per hectare in 2014, which was 9% more than in 2013 (26.3 kilograms per hectare).
- Opium yields in the Southern region, which drive overall production, increased by 27%, from 23.2 kilograms per hectare in 2013 to 29.5 kilograms per hectare in 2014. However, yields in the Southern region were still at relatively low levels in comparison to their levels prior to 2010.
- Potential opium production was estimated at 6,400 tons in 2014, an increase of 17% from its 2013 level (5,500 tons). This increase can be mainly attributed to a strong increase in production in the Southern region, where yields increased by 27% (from 23.2 kilograms per hectare in 2013 to 29.5 kilograms per hectare in 2014).
- Accounting for 69% of national production, the Southern region continued to produce the vast majority of opium in Afghanistan. With 16% of national production, the Western region was the country's second most important opium-producing region in 2014.
- At US$ 0.85 billion, or the equivalent of roughly 4% of Afghanistan's estimated GDP, the farm-gate value of opium production decreased by 13% in 2014.
- In 2014, opium prices decreased in all regions of Afghanistan. One probable reason for the decrease was an increase in supply due to an increase in production.
- Based on recent data on the morphine content of Afghan opium, the heroin conversion ratio, which describes the amount of opium needed to produce a kilogram of heroin, has been updated. For converting opium to pure heroin base, a ratio of 18.5:1 is estimated; for heroin of export quality (impure heroin of 52% purity), a ratio of 9.6:1 is estimated. These ratios replace the former ratio of 7:1 for converting opium to heroin of unknown purity.
Fact Sheet Afghanistan Opium Survey 2014 |1|
2013 Change from 2013 2014 Net opium poppy cultivation (after eradication) in hectares 209,000 ha
(173,000 - 238,000)7% 224,000 ha
(200,000 - 250,500)Number of poppy-free provinces |2| 15 0 15 Number of provinces affected by poppy cultivation |3| 19 0 19 Eradication 7,348 ha -63% 2,692 ha Average opium yield (weighted by cultivation) 26.3 kg/ha 9% 28.7 kg/ha Potential production of opium |4| 5,500 tons
(4,500 - 6,500)17% 6,400 tons
(5,100 - 7,800)Average farm-gate price (weighted by production) of fresh opium at harvest time US$ 143/kg -20% US$ 114/kg Average farm-gate price (weighted by production) of dry opium at harvest time US$ 172/kg -23% US$ 133/kg Total farm-gate value of opium production US$ 0.95 billion -10% US$ 0.85 billion Opium cultivation in Afghanistan, 2014 (at province level)
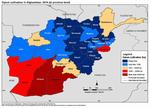
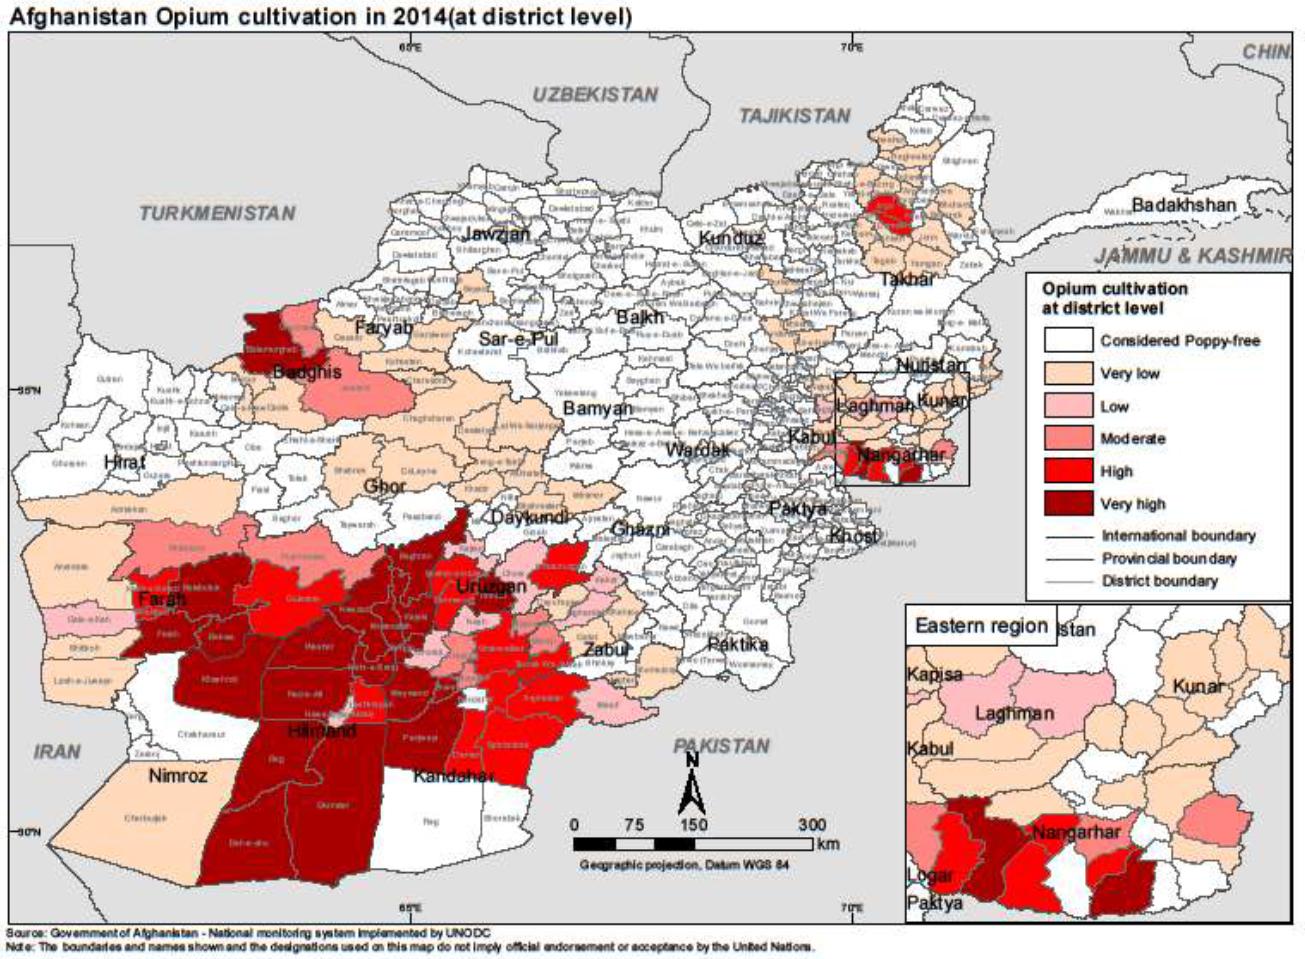
Click to enlargeAfghanistan Opium cultivation in 2014 (at district level)
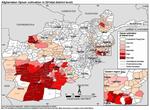
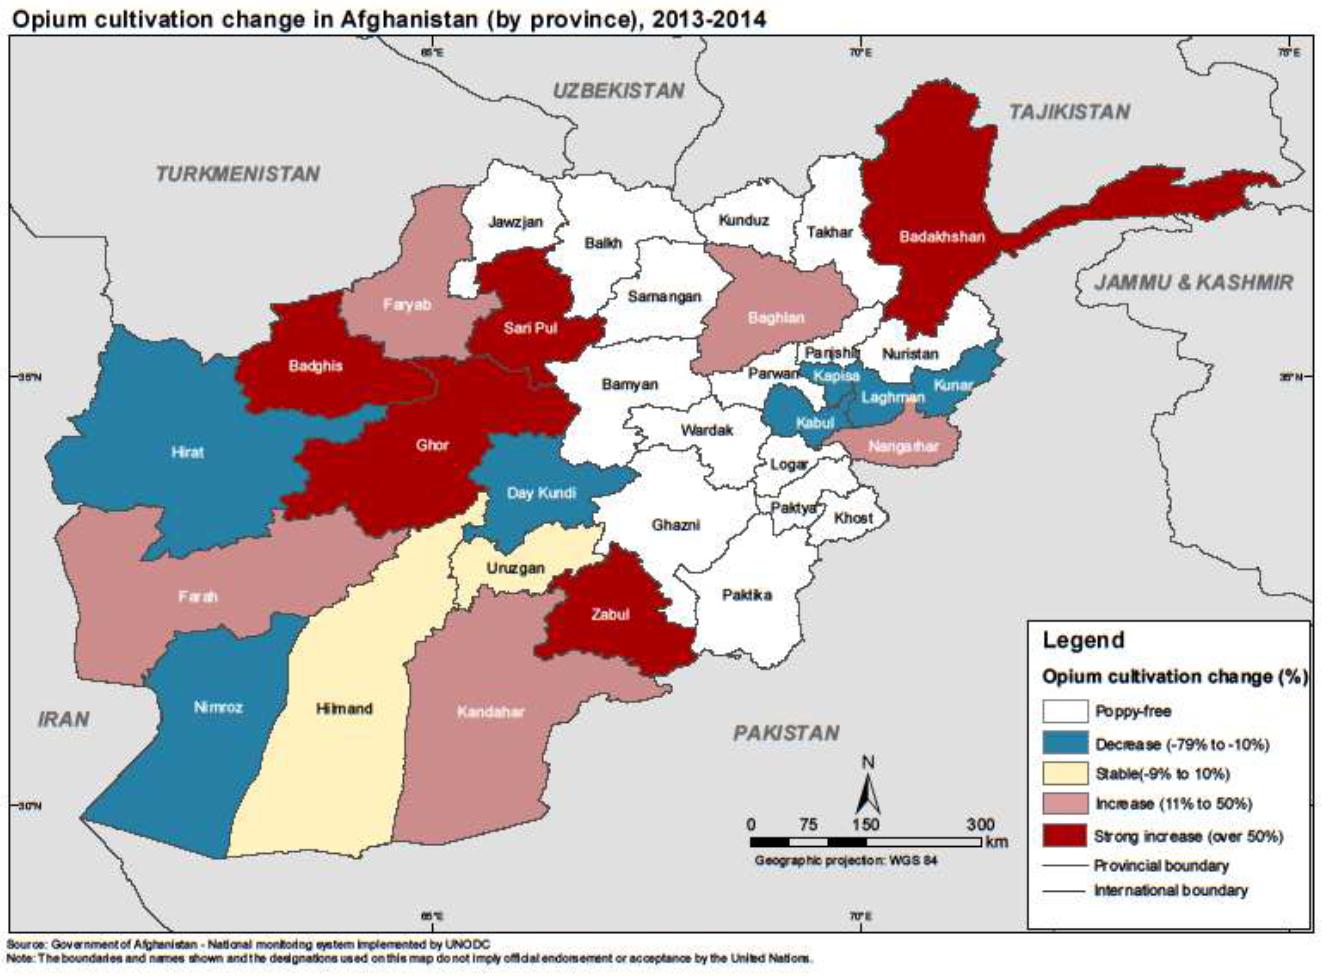
Click to enlargeOpium cultivation change in Afghanistan (by province), 2013-2014

Click to enlargeThe Afghanistan Opium Survey is implemented annually by the Ministry of Counter Narcotics (MCN) of Afghanistan in collaboration with the United Nations Office on Drugs and Crime (UNODC). The survey team collects and analyses information on the location and extent of opium cultivation, potential opium production and the socio-economic situation in rural areas. Since 2005, MCN and UNODC have also been involved in the verification of opium eradication conducted by provincial governors and poppy-eradication forces. The results provide a detailed picture of the outcome of the current year's opium season and, together with data from previous years, enable the identification of medium- and long-term trends in the evolution of the illicit drug problem. This information is essential for planning, implementing and monitoring the impact of measures required for tackling a problem that has serious implications for Afghanistan and the international community.
The opium survey is implemented within the technical framework of the UNODC Illicit Crop Monitoring Programme (ICMP). The objective of ICMP is to assist the international community in monitoring the extent and evolution of illicit crops in the context of the Plan of Action adopted by the United Nations (the 53rd session of the Commission on Narcotic Drugs in March 2009). Under ICMP, monitoring activities currently supported by UNODC also exist in other countries affected by illicit crop cultivation: in Asia, Myanmar and the Lao People's Democratic Republic; in Latin America, the Plurinational State of Bolivia, Colombia, Ecuador, Mexico and Peru; in Africa, Nigeria.
The Afghanistan Opium Survey 2014 was implemented under project AFG/F98, "Monitoring of Opium Production in Afghanistan", with financial contributions from the Governments of Germany, Norway, the United Kingdom of Great Britain and Northern Ireland, and the United States of America.
2.1 National and regional opium cultivation trends
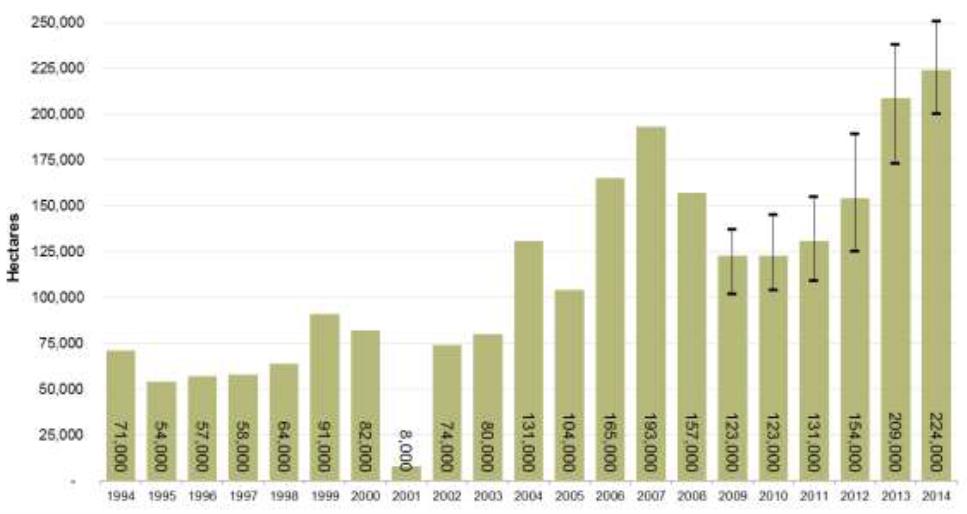
The total area under opium poppy cultivation in Afghanistan was estimated to be 224,000 hectares (200,000-250,500) in 2014, which represents a 7% increase from 2013.
In 2014, 98% of total opium cultivation in Afghanistan took place in the Southern, Eastern and Western regions of the country: in the Southern region, 67% was concentrated in Day Kundi, Hilmand, Kandahar, Uruzgan and Zabul provinces; in the Western region, 22% was concentrated in Badghis, Farah, Hirat and Nimroz provinces; in the Eastern region, 9% was concentrated in Nangarhar, Kunar, Laghman and Kapisa provinces. These are the most insecure provinces, with a security risk classified as "high" or "extreme" by the United Nations Department of Safety and Security (UNDSS), and they are mostly inaccessible to the United Nations and NGOs. Day Kundi is the only province in the South where security is generally good, with the exception of Kejran district.
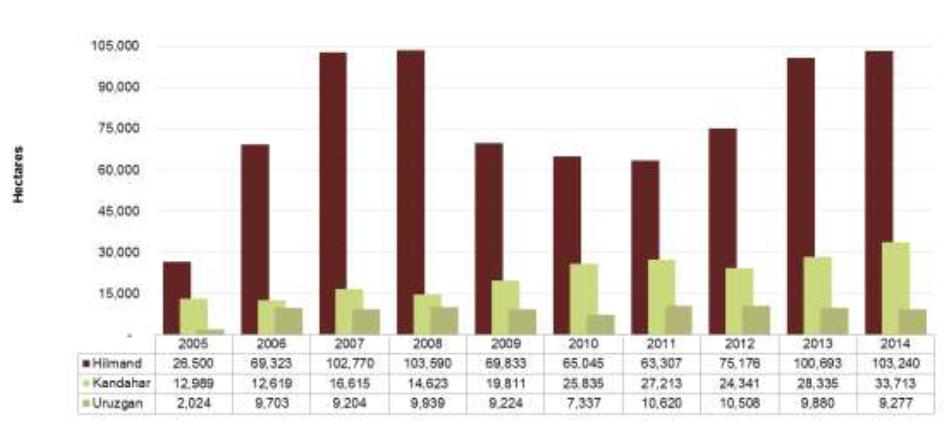
Hilmand remained the country's major opium-cultivating province (103,240 hectares), followed by Kandahar (33,713 hectares), Farah (27,513 hectares), Nangarhar (18,227 hectares), Nimroz (14,584 hectares), Uruzgan |5| (9,277 hectares), Badghis (5,721 hectares), Badakhshan (4,204 hectares), Zabul (2,894 hectares), Laghman (901 hectares), Kunar (754 hectares), Hirat (738 hectares) Day Kundi |6| (587 hectares), Ghor (493 hectares), Kapisa (472 hectares), Kabul (233 hectares) and Sari Pul (195 hectares).
Figure 1: Opium cultivation in Afghanistan, 1994-2014 (Hectares)
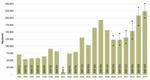
Click to enlargeSources: UNODC and UNODC/MCN opium surveys 1994-2014. The high-low lines represent the upper and lower bounds of the 95% confidence interval.
With the exception of the Central region, all regions experienced an increase in poppy-cultivation levels in 2014, with the largest relative increase being in the North-eastern region (79%; mainly driven by increases in Badakhshan), followed by the Eastern (9%), Western (8%) and Northeastern regions (4%). However, the vast majority (89%) of total opium cultivation took place in nine provinces in Afghanistan's Southern and Western regions.
Opium cultivation increased in most of the main opium poppy-growing provinces, including Badakhshan, Badghis, Nangarhar, Kandahar, Farah, Hilmand, whereas it decreased in Nimroz and Uruzgan provinces.
The number of poppy-free provinces in Afghanistan remained stable in 2014. In the Northern region, Balkh regained its poppy-free status, whereas Sari Pul lost its poppy-free status.
Table 1: Regional distribution of opium cultivation, 2013-2014 (Hectares)
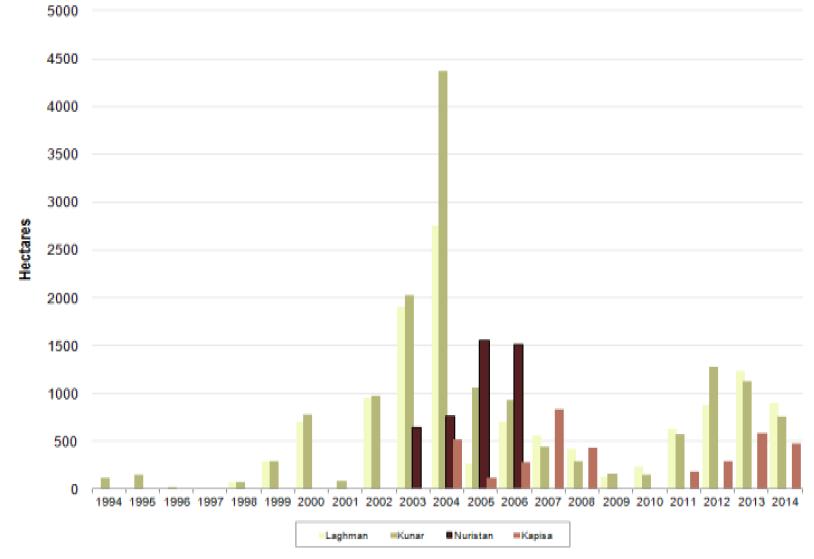
Region 2013 (ha) 2014 (ha) Change 2013-2014 (%) 2013 (ha) as % of total 2014 (ha) as % of total Southern 141,779 149,711 +6% 68% 67% Western 45,557 49,049 +8% 22% 22% Eastern 18,665 20,353 +9% 9% 9% North-eastern 2,374 4,253 +79% 1% 2% Central 298 233 -22% 0.1% 0.1% Northern 710 738 4% 0.3% 0.3% Rounded total 209,000 224,000 +7% 100% 100% In the Eastern region, cultivation decreased in Kunar, Laghman and Kapisa provinces by 33%, 27% and 19%, respectively, but increased in Nangarahar province by 16%. Cultivation in Nangahar again reached the level it had before becoming poppy-free in 2007. Only 34 hectares of opium poppy cultivation were eradicated in Nangarhar province in 2014.
In the North-Eastern region, Badakhshan saw a 77% increase in opium poppy cultivation, from 2,374 hectares in 2013 to 4,204 hectares in 2014. This happened despite the eradication of 1,411 hectares of opium poppy in 2014.
In the Northern region, Balkh province regained its poppy-free status. However, Sari Pul province lost its poppy-free status, though its level of cultivation remained very low. Opium cultivation in Baghlan province increased by 19%, to 168 hectares in 2014 from 141 hectares in 2013.
In the Southern region, with increases of 117%, 34%, 19% and 3% in Zabul, Kandahar and Hilmand provinces, respectively, opium cultivation increased in most provinces. Hilmand remained the country's principal opium-cultivating province in 2014, accounting for 46% of total opium cultivation. Poppy cultivation in Uruzgan and Day Kundi provinces in 2013 and 2014 cannot be compared with previous years because cultivation in Gizab district, which was previously part of Day Kundi province, was considered in the 2014 area estimation of Uruzgan.
In the Western region, the main poppy-cultivating provinces in 2014 were Farah and Nimroz. The area under opium cultivation in Farah province increased from 24,492 hectares in 2013 to 27,513 hectares in 2014 (an increase of 12%). With 14,584 hectares under cultivation, Nimroz province remained the second largest opium-cultivating province in the Western region in 2014, even though opium cultivation in Nimroz decreased by 10% from its 2013 level.
In 2014, no eradication took place in the Western region, except in Ghor province where a total of 8 hectares was eradicated.
Table 2: Number of provinces by opium cultivation trends, 2006-2014
Opium cultivation trend Number of provinces 2006 2007 2008 2009 2010 2011 2012 2013 2014 Increase 14 8 1 6 7 13 14 14 11 Decrease 2 11 11 7 7 4 2 5 8 Stable 12 2 4 1 0 0 1 0 0 Poppy-free 6 13 18 20 20 17 17 15 15 Table 3: Main opium-cultivating provinces in Afghanistan, 2007-2014 (Hectares)
Province 2008 2009 2010 2011 2012 2013 2014 Change 2013-2014 2014 (ha) as % of total Hilmand 103,590 69,833 65,045 63,307 75,176 100,693 103,240 +3% 46% Kandahar 14,623 19,811 25,835 27,213 24,341 28,335 33,713 +19% 15% Farah 15,010 12,405 14,552 17,499 27,733 24,492 27,513 +12% 12% Uruzgan* 9,939 9,224 7,337 10,620 10,508 9,880 9,277 NA 4% Nangarhar Poppy-free 294 719 2,700 3,151 15,719 18,227 +16% 8% Badakhshan 200 557 1,100 1,705 1,927 2,374 4,204 +77% 2% Badghis 587 5,411 2,958 1,990 2,363 3,596 5,721 +59% 3% Day Kundi* 2,273 3,002 1,547 1,003 1,058 1,536 587 NA 0% Nimroz 6,203 428 2,039 2,493 3,808 16,252 14,584 -10% 7% Rest of the country 4,828 2,131 1,383 2,535 4,417 6,585 7,271 +10% 3% Rounded total 157,000 123,000 123,000 131,000 154,000 209,000 224,000 7% 100% * In 2014, Gizab district of Day Kundi province was considered under Uruzgan province, as per presidential decree. The 2014 poppy-cultivation estimates of Day Kundi and Uruzgan are therefore not comparable with previous years.
Table 4: Opium cultivation (2010-2014) and eradication (2013-2014) in Afghanistan (Hectares)
PROVINCE Cultivation 2012 (ha) Cultivation 2013 (ha) Cultivation 2014 (ha) Change 2013-2014 (%) Estimation method 2014 Eradication in 2013 (ha) Eradication in 2014 (ha) Kabul 120 298 233 -22% T 0 0 Khost Poppy-free Poppy-free Poppy-free NA V 0 0 Logar Poppy-free Poppy-free Poppy-free NA V 0 0 Paktya Poppy-free Poppy-free Poppy-free NA V 0 0 Panjshir Poppy-free Poppy-free Poppy-free NA V 0 0 Parwan Poppy-free Poppy-free Poppy-free NA V 0 0 Wardak Poppy-free Poppy-free Poppy-free NA V 0 0 Ghazni Poppy-free Poppy-free Poppy-free NA V 0 0 Paktika Poppy-free Poppy-free Poppy-free NA V 0 0 Central Region 120 298 233 -22% 0 0 Kapisa 290 583 472 -19% T 11 26 Kunar 1,279 1,127 754 -33% S 108 75 Laghman 877 1,236 901 -27% T 20 1 Nangarhar 3,151 15,719 18,227 +16% S 157 34 Nuristan Poppy-free Poppy-free Poppy-free NA V 0 0 Eastern Region 5,596 18,665 20,353 9% 296 136 Badakhshan 1,927 2,374 4,204 +77% S 2,798 1,411 Takhar Poppy-free Poppy-free Poppy-free NA T 60 1 Kunduz Poppy-free Poppy-free Poppy-free NA V 0 9 North-eastern Region 1,927 2,374 4,204 77% 2,858 1,421 Baghlan 177 141 168 19% T 34 3 Balkh Poppy-free 410 Poppy-free NA T 80 35 Bamyan Poppy-free Poppy-free Poppy-free NA V 0 0 Faryab Poppy-free 158 211 33% T 7 10 Jawzjan Poppy-free Poppy-free Poppy-free NA T 0 0 Samangan Poppy-free Poppy-free Poppy-free NA V 0 0 Sari Pul Poppy-free Poppy-free 195 NA T 0 43 Northern Region 177 710 574 -19% 121 91 Hilmand 75,176 100,693 103,240 +3% S 2,162 787 Kandahar 24,341 28,335 33,713 +19% S 1,083 68 Uruzgan* 10,508 9,880 9,277 NA S 352 163 Zabul 424 1,335 2,894 +117% S 0 12 Day Kundi* 1,058 1,536 587 NA S 9 6 Southern Region 115,507 141,779 149,711 6% 3,606 1,036 Badghis 2,363 3,596 5,721 +59% S 3 0 Farah 27,733 24,492 27,513 +12% S 262 0 Ghor 125 264 493 +87% T 6 0 Hirat 1,080 952 738 -23% T 77 0 Nimroz 3,808 16,252 14,584 S 120 0 Western Region 35,109 45,557 49,049 8% 468 8 Total (rounded) 154,000 209,000 224,000 7% 7,348 3,692 Area estimation method: S=remote sensing sample survey, T=remote sensing target survey, V=village sample survey and field observation. See Methodology section for detailed description of methods used. A province is defined as poppy-free when it is estimated to have less than 100 hectares of opium cultivation.
* In 2014, Gizab district of Day Kundi province was considered under Uruzgan province as per presedential decree. The 2014 poppy cultivation estimates of Day Kundi and Uruzgan are therefore not comparable with previous years.
2.2.1 Central region
(Ghazni, Kabul, Khost, Logar, Paktika, Paktya, Panjshir, Parwan, Wardak)Opium cultivation in the Central region decreased by 22% in 2014, with the total area cultivated decreasing to 233 hectares from 298 hectares in 2013. Opium cultivation was limited to the Uzbeen valley of Surobi district in Kabul province, where security is extremely poor. There was no eradication in Kabul province in 2013 and 2014. With the exception of Kabul, all provinces in the Central region have been poppy-free since 2008 and remained so in 2014.
Table 5: Opium cultivation and eradication in the Central region, 2011-2014 (Hectares)
PROVINCE Cultivation 2011 (ha) Cultivation 2012 (ha) Cultivation 2013 (ha) Cultivation 2014 (ha) Change 2011-2012 (%) Eradication in 2013 (ha) Eradication in 2014 (ha) Kabul 220 120 298 233 -22% 0 0 Khost Poppy-free Poppy-free Poppy-free Poppy-free NA 0 0 Logar Poppy-free Poppy-free Poppy-free Poppy-free NA 0 0 Paktya Poppy-free Poppy-free Poppy-free Poppy-free NA 0 0 Panjshir Poppy-free Poppy-free Poppy-free Poppy-free NA 0 0 Parwan Poppy-free Poppy-free Poppy-free Poppy-free NA 0 0 Wardak Poppy-free Poppy-free Poppy-free Poppy-free NA 0 0 Ghazni Poppy-free Poppy-free Poppy-free Poppy-free NA 0 0 Paktika Poppy-free Poppy-free Poppy-free Poppy-free NA 0 0 Central region 220 120 298 233 -22% 0 0 2.2.2 Eastern region
(Kapisa, Kunar, Laghman, Nangarhar, Nuristan)The Eastern region experienced a 9% increase in opium cultivation in 2014. A total of 20,353 hectares of opium was cultivated in the Eastern region, whereas only 136 hectares were eradicated.
Table 6: Opium cultivation and eradication in the Eastern region, 2011-2014 (Hectares)
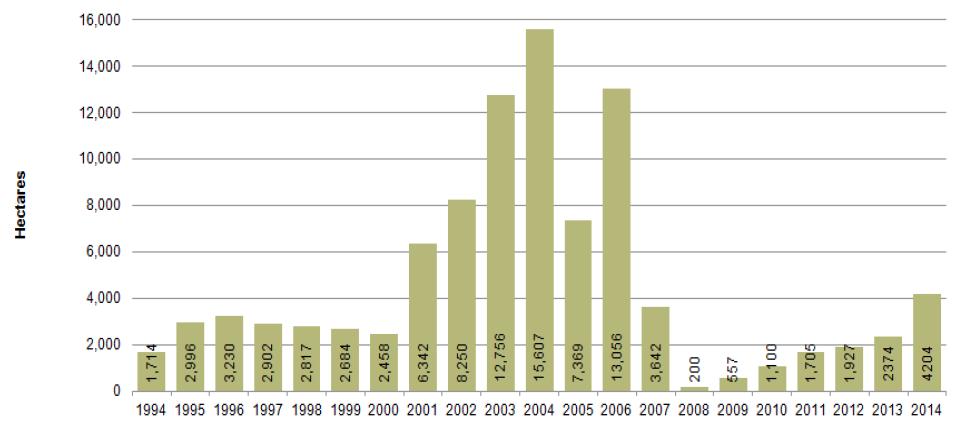
PROVINCE Cultivation 2011 (ha) Cultivation 2012 (ha) Cultivation 2013 (ha) Cultivation 2014 (ha) Change 2011-2012 (%) Eradication in 2013 (ha) Eradication in 2014 (ha) Kapisa 181 290 583 472 -19% 11 26 Kunar 578 1,279 1,127 754 -33% 108 75 Laghman 624 877 1,236 901 -27% 20 1 Nangarhar 2,700 3,151 15,719 18,227 +16% 157 34 Nuristan Poppy-free Poppy-free Poppy-free Poppy-free NA 0 0 Eastern region 4,082 5,596 18,665 20,353 +9% 296 136 Traditionally an important poppy-growing province, Nangarhar experienced an increase in opium cultivation of 16% in 2014, to 18,227 hectares from 15,719 hectares in 2013, which was almost back to its 2007 level (18,739 hectares). Opium cultivation increased significantly in Sherzad, Achin, Pachir Wagam Chaparhar, Kot and Lalpoor districts, where security was very poor.
Due to strong resistance by Anti-Government elements (AGE), only 34 hectares of opium cultivation were eradicated by Governor-led eradication in the province in 2014.
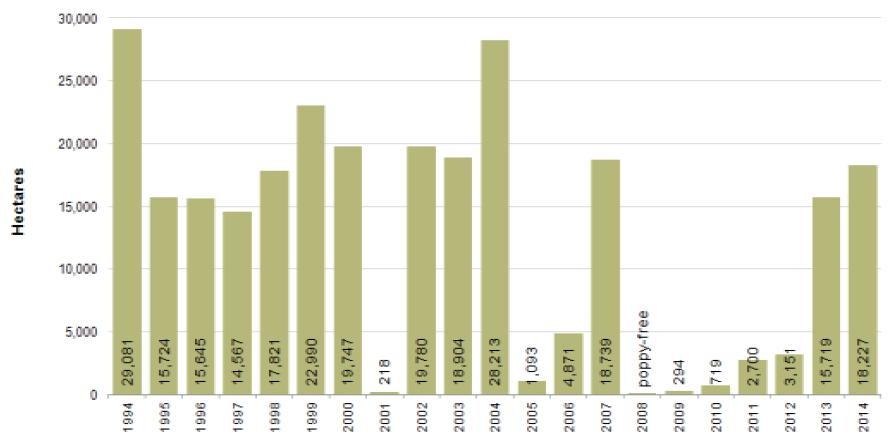
Figure 2: Opium cultivation in Nangarhar province, 1994-2014 (Hectares)
Click to enlargeNote: a sampling approach was introduced in Nangarhar province in 2013, which increased the area under observation significantly in comparison to previous years when a target approach was employed.
In Laghman province, opium cultivation decreased by 27%, from 1,236 hectares in 2013 to 901 hectares in 2014. At the district level, significant decreases occurred in Dowlat Shah (-97%), Alisheng (-41%) and Alingar (-5%). However, cultivation increased to 137 hectares (15%) in Mehterlam district.
In Kunar province, opium cultivation decreased by 33% in 2014, with the main opium-cultivation districts being Asada bad, Dara-i-Pech and Shigal Wa Sheltan.
Opium cultivation in Kapisa province decreased by 19% in 2014, from 583 hectares to 472 hectares, with Tagab its main opium-cultivating district. Nuristan maintained the poppy-free status it achieved in 2007.
Figure 3: Opium cultivation in Laghman, Kunar, Nuristan and Kapisa provinces, 1994-2014 (Hectares)

Click to enlarge2.2.3 North-eastern region
(Badakhshan, Kunduz and Takhar)Opium cultivation in the North-eastern region reached 4,204 hectares in 2014, an increase of 77% from 2013. However, the increase only occurred in Badakhshan province as the two other provinces in the region, Kunduz and Takhar, have been poppy-free since 2007 and 2008, respectively.
Table 7: Opium cultivation and eradication in the North-eastern region, 2011-2014 (Hectares)
PROVINCE Cultivation 2011 (ha) Cultivation 2012 (ha) Cultivation 2013 (ha) Cultivation 2014 (ha) Change 2013-2014 (%) Eradication in 2013 (ha) Eradication in 2014 (ha) Badakhshan 1,705 1,927 2,374 4,204 +77% 2,798 1,411 Kunduz Poppy-free Poppy-free Poppy-free Poppy-free NA 0 1 Takhar Poppy-free Poppy-free Poppy-free Poppy-free NA 60 9 North-eastern region 1,705 1,927 2,374 4,204 +77% 2,858 1,421 Opium cultivation in Badakhshan increased by 77% in 2014, to 4,204 hectares from 2,374 hectares in 2013, and was mostly confined to rain-fed areas cultivated in spring, mainly in Argo and Darayim districts where opium cultivation increased by 262% (2,046 hectares) and 87% (1,282 hectares), respectively. A total of 1,411 hectares of opium cultivation was eradicated and verified by MCN/UNODC in Badakhshan province in 2014.
Figure 4: Opium cultivation in Badakhshan province, 1994-2014 (Hectares)
Click to enlargeKunduz province has been poppy-free since 2007 and is well known for growing a wide range of licit crops, from fruit and vegetables to cotton. An insignificant amount of cultivation has been observed in this province in recent years, and it remained under 100 hectares in 2014, the threshold for obtaining poppy-free status.
Also poppy-free since 2008, Takhar province maintained its poppy-free status in 2014. Only one hectare was eradicated there in 2014.
2.2.4 Northern region
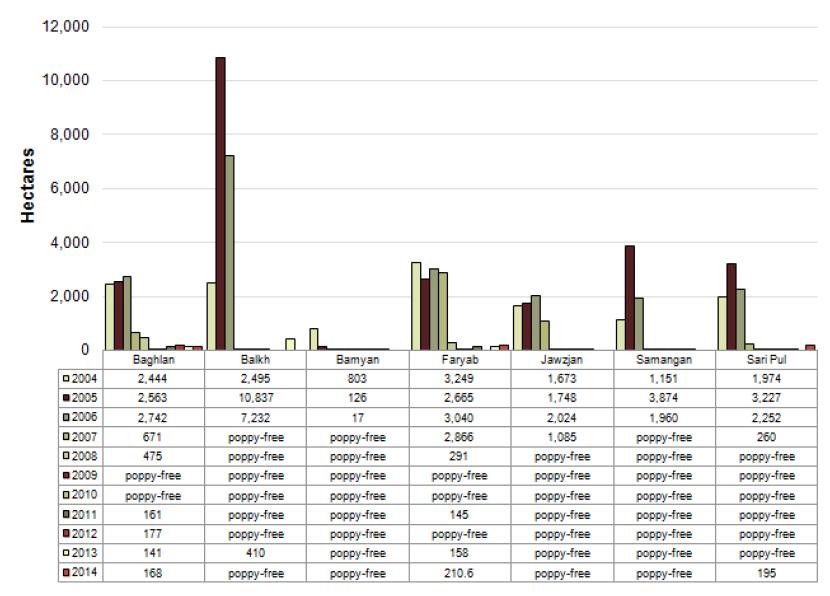
(Baghlan, Balkh, Bamyan, Faryab, Jawzjan, Samangan, Sari Pul)Opium cultivation increased by 19% in Baghlan province in 2014, though the level of opium cultivation was still low. The main opium-cultivating districts were Pul-i-Hisar and Deh Salah, where opium cultivation increased by 11% and 65%, respectively.
Poppy-free from 2007 to 2012, Balkh province lost its poppy-free status in 2013 due to the 410 hectares cultivated in Chimtal district. However, the province regained its poppy-free status in 2014.
Faryab province was poppy-free in 2009, 2010 and 2012, but lost its poppy-free status in 2013. In 2014, opium cultivation increased by a further 33%, to 211 hectares from 151 hectares in 2013. Opium cultivation mainly took place in Kohistan, Qaysar and Gurziwan.
Samangan and Bamyan have been poppy-free since 2007 and remained so in 2014.
Due to its 195 hectares of opium cultivation in 2014, which mainly took place in Sayed district, Sari Pul lost the poppy-free status it obtained in 2008. Jawzjan province has been poppy-free since 2008 and maintained its poppy-free status in 2014.
Table 8: Opium cultivation and eradication in the Northern region, 2011-2014 (Hectares)
PROVINCE Cultivation 2011 (ha) Cultivation 2012 (ha) Cultivation 2013 (ha) Cultivation 2014 (ha) Change 2013-2014 (%) Eradication in 2013 (ha) Eradication in 2014 (ha) Baghlan 161 177 141 168 19% 34 3 Balkh Poppy-free Poppy-free 410 Poppy-free NA 80 35 Bamyan Poppy-free Poppy-free Poppy-free Poppy-free NA 0 0 Faryab 145 Poppy-free 158 211 33% 7 10 Jawzjan Poppy-free Poppy-free Poppy-free Poppy-free NA 0 0 Samangan Poppy-free Poppy-free Poppy-free Poppy-free NA 0 0 Sari Pul Poppy-free Poppy-free Poppy-free 195 NA 0 43 Northern region 305 177 710 574 -19% 121 91 Figure 5: Opium cultivation in the Northern region, 2004-2014 (Hectares)
Click to enlarge2.2.5 Southern region
(Day Kundi, Hilmand, Kandahar, Uruzgan, Zabul)Accounting for 67% of total opium cultivation in Afghanistan, 149,711 hectares of opium poppy were cultivated in the Southern region in 2014, an increase of 6% from 2013.
Gizab district, formerly part of Day Kundi province, was considered under Uruzgan province in 2014. The 2014 poppy cultivation estimates for Day Kundi and Uruzgan are therefore not comparable with previous years. However, opium cultivation in Day Kundi was 587 hectares in 2014, and the province's main opium-cultivating districts were Kajran, Sang-i-Takht and Shahristan.
Table 9: Opium cultivation and eradication in the Southern region, 2011-2014 (Hectares)
PROVINCE Cultivation 2011 (ha) Cultivation 2012 (ha) Cultivation 2013 (ha) Cultivation 2014 (ha) Change 2013-2014 (%) Eradication in 2013 (ha) Eradication in 2014 (ha) Day Kundi 1,003 1,058 1,536 587 NA 9 6 Hilmand 63,307 75,176 100,693 103,240 +3% 2,162 787 Kandahar 27,213 24,341 28,335 33,713 +19% 1,083 68 Uruzgan 10,620 10,508 9,880 9,277 NA 352 163 Zabul 262 424 1,335 2, 894 +117% 0 12 Southern region 102,405 111,507 141,779 149,711 +6% 3,606 1,036 * In 2014, Gizab district of Day Kundi province was considered under Uruzgan province. The 2014 poppy cultivation estimates of Day Kundi and Uruzgan are therefore not comparable with previous years.
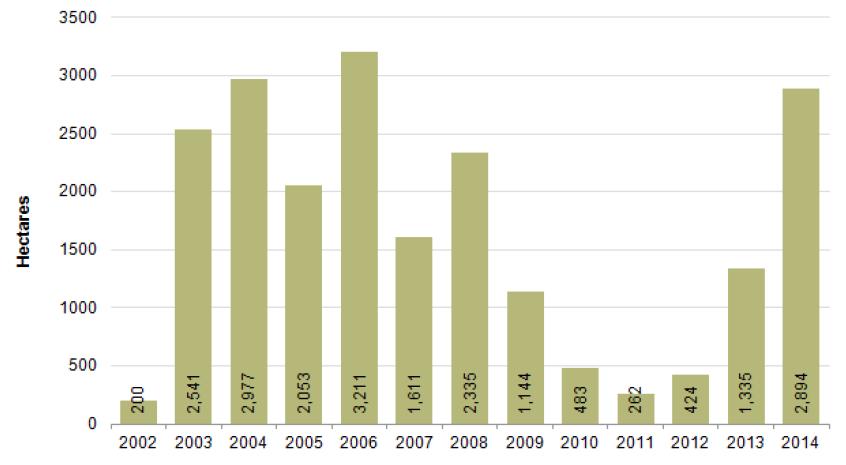
Figure 6: Opium cultivation in Zabul province, 2002-2014
Click to enlargeWith 103,240 hectares (46% of total opium cultivation in Afghanistan), an increase of 3% from 2013 (100,693 hectares), Hilmand remained Afghanistan's single largest opium-cultivating province in 2014, though it had the smallest rate of increase of all the provinces in the Southern region.
The "Food Zone" alternative livelihood programme in Hilmand province came to an end in 2012, but significant differences could still be observed between the areas inside and outside the zone in 2014. Opium cultivation inside the former Food Zone increased by 13% in 2014 (from 36,244 hectares in 2013 to 41,089 hectares), representing roughly a fifth of the Food Zone's total agricultural area, but the extent of poppy cultivation was far greater outside the former Food Zone. More than a third of available land outside the Food Zone was under poppy cultivation in 2014, showing that, despite the increase following the end of the programme, opium cultivation was still relatively smaller inside the Food Zone than outside it. However, outside the Food Zone, where increases in poppy cultivation were mainly achieved by increasing the amount of agricultural land, the area under poppy cultivation slightly decreased.
Table 10: Poppy cultivation inside and outside the former Hilmand "Food Zone", 2012-2014
Cultivation 2012 (ha) Cultivation 2013 (ha) Cultivation 2014 (ha) Change 2013-2014 (%) % of agricultural land with poppy Inside the Food Zone 24,241 36,244 41,089 13% 22% Outside the Food Zone 50,935 64,449 62,151 -4% 31% Total province 75,176 100,693 103,240 3% 27% The Food Zone estimates refer to an area in ten districts of Hilmand (the "Food Zone" as of 2011, where farmers were provided with fertilizers, certified wheat seeds and high-value horticulture seeds in the poppy planting seasons for the 2009-2012 harvests. See Afghanistan Opium Survey 2009 and Methodology section.
At the district level, opium cultivation levels in 2014 were highest in Nad Ali, Naher-i-Saraj, Kajaki, Nawzad, Garmser, Musa Qala, Regi-i-Khan Nishin, Sangin Qala, Baghran, Washer and Dishu districts. Significant increases from 2013 (230%, 85%, 44% and 40%, respectively) occurred in opium cultivation in Nawa-i-Barukzai, Garmser, Sangin Qala and Lashkargah districts (see district overview in the Annex).
A total of 787 hectares of Governor-led opium poppy eradication was verified by MCN/UNODC in 2014, which corresponds to only 0.3% of estimated opium cultivation.
In Kandahar province, opium cultivation reached 33,713 hectares in 2014, an increase of 19% from its 2013 level (28,335 hectares). The main opium cultivation districts were Maiwand, Zhire and Panjway.
Figure 7: Opium cultivation in Hilmand, Kandahar and Uruzgan provinces, 2004-2014 (Hectares)
Click to enlargeOpium cultivation in Uruzgan province was 9,277 hectares in 2014, with the province accounting for 4% of total Afghan opium cultivation. The 2013 and 2014 estimates cannot be compared, as Gizab district was considered under Uruzgan province in 2014 and not under Day Kundi province as in previous years.
Dihrawud, Shahidi Hassas and Tirin Kot (provincial centre) were the main opium poppy-cultivating districts in Uruzgan province. However, opium cultivation decreased in Dehrawud, Shahidi Hasas and Chorah districts by 33%, 41% and 18%, respectively.
Opium cultivation in Zabul province saw a significant increase of 117% in 2014, to reach 2,894 hectares, whereas it stood at 1,335 hectares in 2013 and 424 hectares in 2012. The main opium-cultivating districts in Zabul were Kakar and Mizan, where security was poor and opium cultivation was 1,168 hectares and 544 hectares, respectively.
2.2.6 Western region
(Badghis, Farah, Ghor, Hirat, Nimroz)In the Western region, opium cultivation increased by 8% in 2014, to reach 49,049 hectares, whereas it was 45,557 hectares in 2013. This increase took place in three provinces, namely Badghis, Ghor and Farah, with Ghor and Badghis seeing the strongest increases (87% and 59%, respectively). Eradication was not carried out in the Western region, except in Ghor province where only 8 hectares of opium poppy were eradicated in 2014.
The Western region consistently shows very high levels of opium cultivation. Insecurity continues to be a major problem as it compromises the rule of law and limits counter-narcotics interventions.
Table 11: Opium cultivation and eradication in the Western region, 2011-2014 (Hectares)
PROVINCE Cultivation 2011 (ha) Cultivation 2012 (ha) Cultivation 2013 (ha) Cultivation 2014 (ha) Change 2013-2014 (%) Eradication in 2013 (ha) Eradication in 2014 (ha) Badghis 1,990 2,363 3,596 5,721 +59% 3 0 Farah 17,499 27,733 24,492 27,513 +12% 262 0 Ghor Poppy-free 125 264 493 +87% 6 8 Hirat 366 1,080 952 738 -+23% 77 0 Nimroz 2,493 3,808 16,252 14,584 -+10% 120 0 Western region 22,348 35,109 45,557 49,049 +8% 468 8 Note: Since 2013, the Dilaram area, previously a district of Farah province, was reintegrated into Nimroz province. This reversed a boundary change that happened in 2009 when the Dilaram area, which had previously been part of Nimroz, was moved into Farah province.
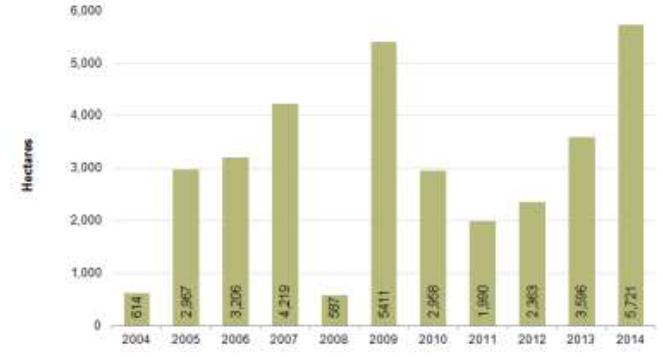
Opium poppy cultivation in Badghis jumped to 5,721 hectares in 2014 from 3,596 hectares in 2013, an increase of 59%. Its main opium-growing districts were Ghormach, Balamurghab and Jawand.
Figure 8: Opium cultivation in Badghis province, 2004-2014 (Hectares)
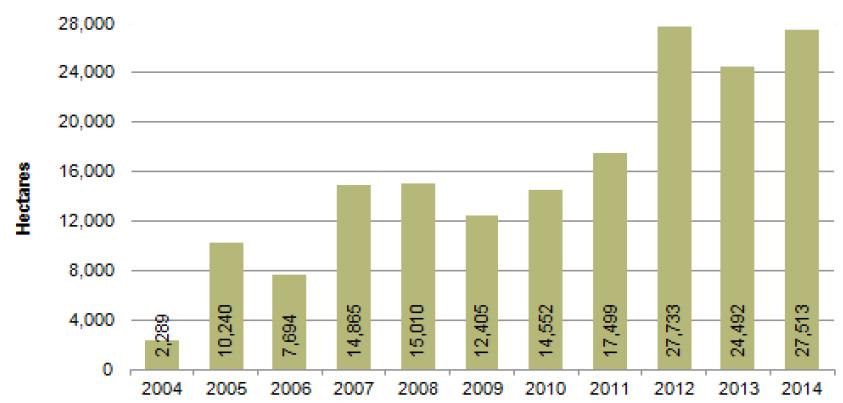
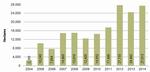
Click to enlargeIn 2014, opium cultivation in Farah province was 27,513 hectares. However, due to administrative boundary changes, the 2013 and 2014 estimates are not comparable to those of 2012.
The main opium-cultivating districts in Farah, where security is very poor, were Bakwah, Bala Buluk, Gulistan, Khak-i-Safed Farah (provincial centre), Pusht-Rod and Shib Koh in 2014. Increases in opium cultivation occurred in Bakwah (43%), Purchaman (304%) and Bala Buluk (40%). Decreases of 85%, 67%, 47% and 61% were also observed in Lash-i-Juwayn, Anar Darah, Gulistan and Qala-i-Kah districts, respectively.
Figure 9: Opium cultivation in Farah province, 1994-2014 (Hectares)
Click to enlargePoppy cultivation in Ghor increased by 87% in 2014, from 264 hectares to 493 hectares (Ghor was poppy-free in 2011). Only 8 hectares of eradication took place in Ghor province in 2014, which was not enough for the province to regain poppy-free status.
In Hirat province, the level of opium poppy cultivation decreased by 22%, to 738 hectares in 2014 from 952 hectares in 2013. The only district in Hirat province where opium cultivation took place was Shindand, where security is very poor.
In 2014, the level of opium poppy cultivation in Nimroz province decreased by 10% to 14,584 hectares. The main poppy cultivating district was Khash-Rod.
3.1 Poppy eradication decreased by 63% in 2014
A total of 2,692 hectares of verified poppy eradication was carried out by the provincial Governors in 2014, representing a decrease of 63% from 2013 when 7,348 hectares of Governor-led eradication (GLE) was verified by MCN/UNODC.
In 2014, MCN/UNODC field surveyors verified the eradication of 10,221 fields in 480 villages in 17 provinces, whereas in 2013 MCN/UNODC verifiers visited 814 villages (20,374 poppy fields) in 18 provinces where eradication had been carried out by Governor-led eradication teams.
Quality control of eradication verification was carried out using satellite data in Badakhshan, Balkh, Hilmand, Kandahar, Kapisa, Nangarhar, Sari Pul and Uruzgan provinces. Final figures for eradication in these provinces are confirmed after checking with high-resolution satellite imageries supported by GPS tracking file, ground and Heli-pictures. For the provinces of Day Kundi, Kunar, Baghlan, Faryab, Ghor, Kunduz, Takhar, Laghman and Zabul provinces, the quality checks for eradication verification were made by scrutinizing the survey forms, checking the area measurement calculations and with the help of field photographs.
Major observations on eradication campaigns in 2013 and 2014 are given below (see tables also):
- Governor-led poppy eradication campaigns were less active in all regions of Afghanistan in 2014 than in 2013.
- A total of 2,692 hectares of Governor-led poppy eradication was carried out in 2014, which corresponds to a decrease of 63% from 2013, when 7,348 hectares were eradicated in the the same 17 provinces. These provinces were: Badakhshan, Baghlan, Balkh, Day Kundi, Faryab, Ghor, Hilmand, Kandahar, Kapisa, Kunduz, Kunar, Laghman, Nangarhar, Sari Pul, Takhar, Uruzgan and Zabul.
- The Governor-led poppy eradication campaign commenced on 3 March 2014 in Hilmand province and on 16 April 2014 in Kandahar province, while the 2013 eradication activities began on 23 February 2013 in Hilmand and on 5 March 2013 in Kandahar province.
- The largest amount of poppy eradication was verified in Badakhshan province (1,411 hectares), a decrease of 50% from the eradication carried out in 2013 in the same province (2,798 hectares). Furthermore, the quality of eradication was very poor in Badakhshan province.
- In 2014, no eradication took place in Badghis, Farah, Hirat, Kabul and Nimroz provinces.
- The security situation continued to be unfavorable for Governor-led eradication campaigns in 2014 in all provinces where eradication was carried out. Resistance against poppy eradication operations was manifested in different ways, such as direct attacks on eradication teams and mine explosions.
- In 2014, 13 lives were lost (8 police, 3 members of the Afghan National Army and 2 farmers) and 26 persons were injured (13 Police, 2 Afghan Local Police, 8 members of the Afghan National Army, one farmer, one tractor driver and one verifier).
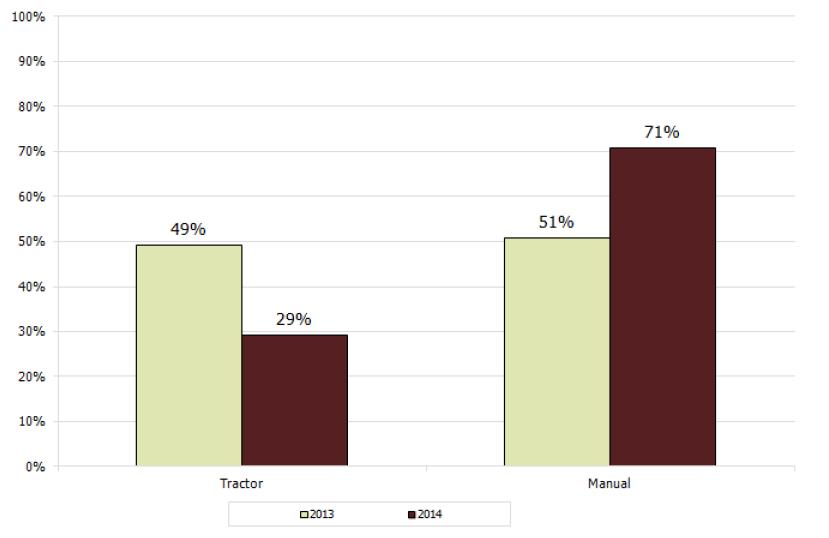
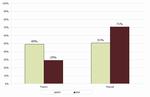
- Among other eradication methods, GLE teams mainly used tractors and manual eradication (sticks, blades, hands and uprooting) in 2014, with 49% of GLE being carried out by tractor/ATV and 51% by manual methods.
Table 12: Governor-led eradication, by province, 2014
Province Eradication verification (ha) Reported no. of eradicated fields No. of villages where eradication reported Day Kundi 6 65 4 Badakhshan* 1,411 6,741 238 Baghlan 3 24 4 Balkh* 35 176 5 Faryab 10 123 12 Ghor 8 63 11 Hilmand* 787 1,451 109 Kandahar* 68 58 8 Kapisa* 26 311 13 Kunar 75 209 17 Kunduz 9 47 4 Laghman 1 25 1 Nangarhar* 34 191 17 Sar-e-Pul* 43 135 6 Takhar 1 51 1 Uruzgan* 163 577 24 Zabul 12 20 6 Grand total 2,692 10,221 480 * Provinces checked with satellite imagery.
Table 13: Governor-led eradication, 2013-2014 (Hectares and percentage change)
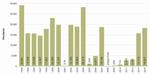
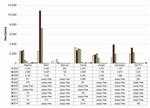
Province Eradication verification (ha) 2013 Eradication verification (ha) 2014 % Change Badghis 3 0 -100% Day Kundi 9 6 -37% Farah 262 0 -100% Hilmand 2,162 787 -64% Hirat 77 0 -100% Kabul 0 0 0% Kandahar 1,083 68 -94% Kapisa 11 26 136% Kunar 108 75 -31% Laghman 20 1 -93% Nangarhar 157 34 -78% Nimroz 120 0 -100% Uruzgan 352 163 -54% Zabul 0 12 100% Badakhshan 2,798 1,411 -50% Baghlan 34 3 -91% Balkh 80 35 -56% Faryab 7 10 43% Ghor 6 8 33% Kunduz 0 9 100% Sari Pul 0 43 100% Takhar 60 1 -99% Grand total 7,348 2,692 -63% Figure 10: Percentage of total opium poppy eradication, by province, 2013-2014

Click to enlargeTable 14: Poppy eradication and cultivation in Afghanistan, 2007-2014 (Hectares)
Year 2007 2008 2009 2010 2011 2012 2013 2014 Number of provinces where eradication was carried out 26 17 12 11 18 18 18 17 Governor-led eradication (GLE), (ha) 15,898 4,306 2,687 2,316 3,810 9,672 7,348 2,692 Poppy Eradication Force (PEF), (ha) * 3,149 1,174 2,663 0 0 0 0 0 Total eradication (ha) 19,047 5,480 5,351 2,316 3,810 9,672 7,348 2,692 Cultivation (ha) ** 193,000 157,000 123,000 123,000 131,000 154,000 209,000 224,000 % Poppy in insecure provinces of South and West 80% 98% 99% 95% 95% 95% 89% 89% Poppy-free provinces 13 18 20 20 17 17 15 15 * The "Poppy Eradication Force " (PEF), a centrally-directed eradication force, ceased operations in 2009.
** Net opium cultivation after eradication.
Figure 11: Area of opium poppy eradication, by different methods, 2013-2014 (Percentage of total)
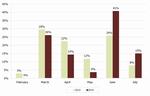
Click to enlargeFigure 12: Area of opium poppy eradication, per month, 2013-2014 (Percentage of total)
Click to enlargeTable 15: Start and end dates of Governor-led eradication (GLE), 2014
Region Province Eradication start date Eradication end date Eradication (ha) Central Kapisa 05-May-14 10-May-14 26 Easterm Kunar 29-Apr-14 19-May-14 75 Laghman 29-Apr-14 03-May-14 1 Nangarhar 23-Apr-14 15-May-14 34 Southern Day Kundi 30-Apr-14 04-May-14 6 Hilmand 03-Mar-14 21-Apr-14 787 Kandahar 16-Apr-14 24-Apr-14 68 Uruzgan 20-Apr-14 04-May-14 163 Zabul* 17-Apr-14 21-Apr-14 12 Western Ghor 6-Jul-2014 9-Jul-2014 8 Northern Baghlan 1-Jun-2014 24-Jun-2014 3 Faryab 11-May-2014 19-May-2014 10 Sari Pul 26-May-2014 1-Jun-2014 43 Balkh 11-May-2014 17-May-2014 35 North-eastern Badakhshan 24-May-2014 19-Jul-2014 1411 Takhar 18-Jun-2014 19-Jun-2014 1 Kunduz 26-Apr-2014 28-Apr-2014 9 3.2 Quality control of reported eradication with satellite images
As in previous years, in 2014, MCN/UNODC procured high-resolution satellite images based on the field coordinates recorded by verifiers in eradicated poppy fields to validate the authenticity of reports and generate more accurate area figures by on-screen digitization of the eradicated fields.
The Governor-led eradication of opium poppy in Badakhshan, Balkh, Hilmand, Kandahar, Kapisa, Nangarhar, Sari Pul and Uruzgan provinces was checked with satellite images. Satellite images were supported with heli-pictures collected during over-flights.
Since 2013, surveyors have generated a GPS track around eradicated fields that provides both the location and shape of the fields. These tracks have helped verification of eradicated fields with satellite imagery.
In 2014, satellite images of eradicated fields were interpreted and compared with the figures available on the ground and, in general, a good match was observed between them.
Badakhshan province was an exception, as 554 hectares of eradication was over-reported and the province's final eradication figure was corrected to 1,411 hectares. The quality of eradication was very poor in Badakhshan province: less than 80% of the area of most fields was eradicated.
In Kandahar province, over-reporting to the extent of 26 hectares was observed, which led to a corrected eradication figure of 68 hectares.
Eradication reported by verifiers in Hilmand province was checked with satellite imagery and over-reporting to the extent of 114 hectares was confirmed. The final eradication figure in Hilmand province was thus corrected to 787 hectares. The quality of eradication seen on both satellite images and heli-pictures was generally very good and effective in most places in Hilmand province.
In Nangarhar province, eradication reported by verifiers was checked with satellite images and over-reporting to the extent of 8.8 hectares was confirmed. The final eradication figure in Nangarhar province was corrected to 34 hectares.
Eradication reported by verifiers in Uruzgan province was checked with satellite images and over-reporting to the extent of 58 hectares was confirmed. The final eradication figure in Uruzgan province was corrected to 163 hectares. Eradication was mainly carried out with sticks and, based on field measurement with satellite imagery and the quality of eradication reported by verifiers, the final eradication area was calculated. Most of the fields were only partially eradicated.
In Kapisa province, eradication reported by verifiers was checked with satellite images and 2 hectares of under-reporting was confirmed. The final eradication figure in Kapisa province was corrected to 26 hectares.
4 Potential opium yield and production
4.1 Potential opium yield and production increased in 2014 |7|
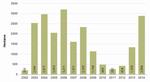
In 2014, estimated potential opium production in Afghanistan amounted to 6,400 tons (5,1007,800 tons), an increase of 17% from its 2013 level (5,500 tons). Average opium yield amounted to 28.7 kilograms per hectare in 2014, which was 9% more than in 2013 (26.3 kilograms per hectare).
The increase in production was mainly the result of an increase in opium cultivation and yield. The 27% increase in yield in the Southern region, in particular, caused an increase in overall production. However, as in the previous year, adverse weather conditions in parts of the Western and Southern regions affected poppy plants, thereby reducing the yield in comparison to the relatively unaffected 2011 yield (44.5 kilograms per hectare). In the Southern region, for example, the yield survey showed a reduction of more than 39% from its 2011 level.
In 2014, a total of 135 poppy fields was surveyed for the purpose of estimating opium yield. As in 2012, the yield survey was limited to low-risk areas where the security situation allowed access and enough time to carry out all measurements. Together with close supervision of field work, this ensured a very high degree of compliance with the yield survey protocol. |8| All yield data obtained in 2014, except for the data relating to one field collected in Badakhshan, met the strict quality criteria introduced in 2011.
Table 16: Opium yield, by region, 2013-2014 |9| (Kilograms per hectare)
REGION 2013 average yield (kg/ha) 2014 average yield (kg/ha) % Change Central 48.5 48.5 0% Eastern 45.1 39.6 -12% North-eastern 42.8 38.2 -11% Northern 34.7 34.5 -1% Southern 23.2 29.5 27% Western 26.9 20.4 -24% Weighted national average 26.3 28.7 9% The Southern region continued to produce the vast majority of opium in Afghanistan in 2014, representing 69% of national production. The Western region was the country's second most important opium-producing region (16%). The rest of the country contributed 15% of total opium production.
Regional opium cultivation and production in Afghanistan, 2014
Click to enlargeTable 17: Opium production in Afghanistan 2009-2014, by province (Tons)
Province Production 2009 (mt) Production 2010 (mt) Production 2011 (mt) Production 2012 (mt) Production 2013 (mt) Production 2014 (mt) Change 2013-2014 (mt) Change 2013-2014 (%) REGION Kabul 7 8 9 4 14 11 -3 -22% Central Khost Poppy-free Poppy-free Poppy-free Poppy-free Poppy-free Poppy-free NA NA Central Logar Poppy-free Poppy-free Poppy-free Poppy-free Poppy-free Poppy-free NA NA Central Paktya Poppy-free Poppy-free Poppy-free Poppy-free Poppy-free Poppy-free NA NA Central Panjshir Poppy-free Poppy-free Poppy-free Poppy-free Poppy-free Poppy-free NA NA Central Parwan Poppy-free Poppy-free Poppy-free Poppy-free Poppy-free Poppy-free NA NA Central Wardak Poppy-free Poppy-free Poppy-free Poppy-free Poppy-free Poppy-free NA NA Central Ghazni Poppy-free Poppy-free Poppy-free Poppy-free Poppy-free Poppy-free NA NA Central Paktika Poppy-free Poppy-free Poppy-free Poppy-free Poppy-free Poppy-free NA NA Central Central Region 7 8 9 4 14 11 -3 -22% Kapisa Poppy-free Poppy-free 7 11 26 19 -8 -29% East Kunar 6 8 23 49 51 30 -21 -41% East Laghman 5 12 25 34 56 36 -20 -36% East Nangarhar 11 37 110 122 709 721 +12% +2% East Nuristan Poppy-free Poppy-free Poppy-free Poppy-free Poppy-free Poppy-free NA NA East Eastern Region 21 56 166 216 842 805 -37 -4% Badakhshan 19 56 39 86 102 161 +59% +58% North-East Takhar Poppy-free Poppy-free Poppy-free Poppy-free Poppy-free Poppy-free 49 NA North-East Kunduz Poppy-free Poppy-free Poppy-free Poppy-free Poppy-free Poppy-free NA NA North-East North-eastern Region 19 56 39 86 102 161 +59 +58% Baghlan Poppy-free Poppy-free 7 7 5 6 1 18% North Balkh Poppy-free Poppy-free Poppy-free Poppy-free 14 Poppy-free -14 NA North Bamyan Poppy-free Poppy-free Poppy-free Poppy-free Poppy-free Poppy-free NA 0% North Faryab Poppy-free Poppy-free 6 Poppy-free 6 7 2 32% North Jawzjan Poppy-free Poppy-free Poppy-free Poppy-free Poppy-free Poppy-free 80 NA North Samangan Poppy-free Poppy-free Poppy-free Poppy-free Poppy-free Poppy-free NA 0% North Sari Pul Poppy-free Poppy-free Poppy-free Poppy-free Poppy-free 7 195 NA North Northern Region Poppy-free Poppy-free 12 7 25 20 -5 -20% Hilmand 4,085 1,933 3,044 1,699 2,339 3,048 +708 30% South Kandahar 1,159 768 1,308 550 658 995 +337 51% South Uruzgan* 540 218 511 237 229 274 +44 19% South Zabul 67 14 13 10 31 85 +54 176% South Day Kundi* 176 46 48 24 36 17 -+18 -51% South Southern Region 6,026 2,979 4,924 2,520 3,293 4,420 +1127 34% Badghis 238 71 61 55 97 117 +20% 21% West Farah 545 349 536 651 658 561 -97 -15% West Ghor Poppy-free Poppy-free Poppy-free 3 7 10 +3 42% West Hirat 24 9 11 25 26 15 -11 -41% West Nimroz 19 49 76 89 437 297 -139 -32% West Western Region 825 478 685 824 1,224 999 -224 -18% Provinces are defined as poppy-free when they are estimated to contain less than 100 hectares of opium cultivation.
* In 2014, Gizab district of Day Kundi province has been considered under Uruzgan province. The 2014 poppy cultivation estimates of Day Kundi and Uruzgan are therefore not comparable with previous years.
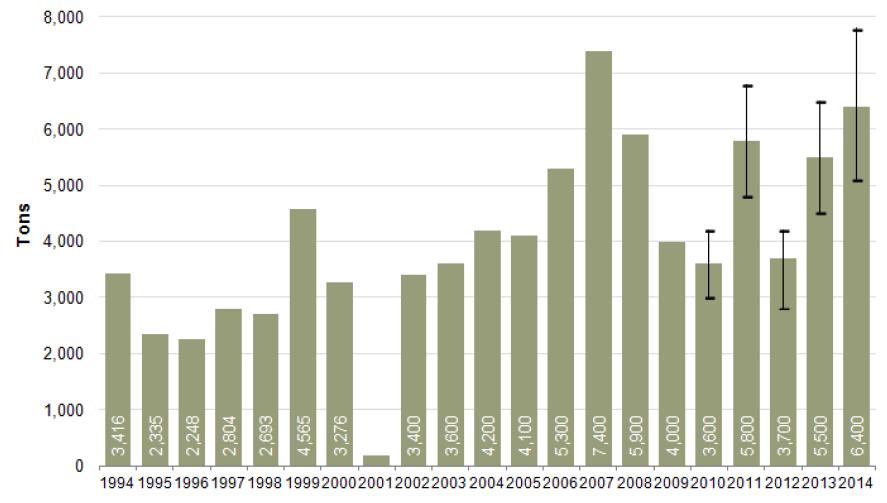
Figure 13: Potential opium production in Afghanistan, 1997-2014 (Tons)
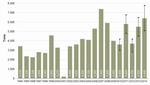
Click to enlargeSources: UNODC and UNODC/MCN opium surveys, 1994-2014. The high-low lines represent the upper and lower bounds of the confidence interval of the estimates. Figures refer to oven-dry opium. Production figures for 2006 to 2009 have been revised; see UNODC/MCN Afghanistan opium survey 2012.
Table 18: Potential opium production, by region, 2013-2014 (Tons)
Region Production 2013 Production 2014 Change 2013-2014 (%) Central 14 11 -19% Eastern 842 805 -4% North-eastern 102 161 58% Northern 25 20 -21% Southern 3,293 4,420 34% Western 1,224 999 -18% Total (rounded) 5,500 6,400 17% Table 19: Potential opium production, by region, with ranges, 2014 (Tons)
REGION Best estimate Lower bound Upper bound Central 34 31 38 Eastern 786 352 1,192 North-eastern 163 27 378 Northern 25 20 31 Southern 4,420 3,594 5,096 Western 999 647 1,174 National 6,428 5,128 7,756 National (rounded) 6,400 5,100 7,800 4.2 Potential heroin production in Afghanistan
All the opium produced in Afghanistan each year is either exported as raw opium or heroin/morphine, consumed domestically in various forms, seized, stored for later use or lost (for example, due to mould, disposal to avoid seizures, etc.).
Hence, the critical components needed for estimating the potential heroin of certain purity yielded from one year's opium production are:
- the share of raw opium produced that is converted to heroin (for the domestic market or for export)
- the amount of heroin/morphine yielded from the amount of raw opium converted
- the purity of the heroin considered
- the shares of opium in the form of raw opium or heroin that are seized or lost, and the remainder (if any), which does not enter the market in the year of interest.
There is a clear understanding of the approximate amount of opium produced. However, the shares converted to morphine and heroin and the purities of these substances are much less clear as only secondary data can be used as a proxy. In the case of seizures, for example, the purity of the heroin seized is often not known. Likewise, the purity of heroin consumed domestically may differ substantially from the purity of heroin destined for export. Furthermore, little is known about when and where the conversion of morphine to heroin takes place.
One component, the amount of raw opium needed to produce a kilogram of heroin/morphine, has been under investigation by UNODC/MCN, and recent results on the morphine content of Afghan opium led to an update of the quantity of opium needed to do so.
In the following sections, all the factors related to the conversion ratio of opium to pure heroin base are discussed. The concept of heroin of export quality (impure heroin), which is the more adequate measure for describing the opiate economy of Afghanistan, is then introduced. Based on these results, the potential heroin production yielded from the 2014 opium production is subsequently estimated.
4.2.1 Average morphine content of Afghan opium has declined: updating the conversion ratio from opium to heroin base
Prior to this update, UNODC used a conversion ratio of opium to heroin of unknown purity for estimating the amount of heroin produced from a year's harvest of opium. The ratio described the amount of opium needed for producing a kilogram of heroin, without specifying the purity of the heroin yielded. With this update, UNODC no longer uses the concept "heroin of unknown purity", but instead introduces two different concepts for estimating heroin production: "conversion to pure heroin base" and "conversion to heroin of export quality" (impure heroin).
Until 2005, UNODC used a conversion ratio of 10:1 for all opium-producing countries (10 kilograms of opium needed to produce 1 kilogram of heroin base of unknown purity). In 2005, the conversion ratio of Afghan opium was changed from 10:1 to 7:1. This change was based on research made on the morphine content of 39 opium samples collected between 2000 and 2003, as well as key informant interviews and some scientific studies undertaken by third parties. |10|
The morphine content of opium harvested in Afghanistan has decreased since 2005, which is the reason for updating the conversion ratio of opium to heroin. Data on morphine content is available from the annual investigations undertaken from 2000 to 2005, and 2010 to 2012. |11|
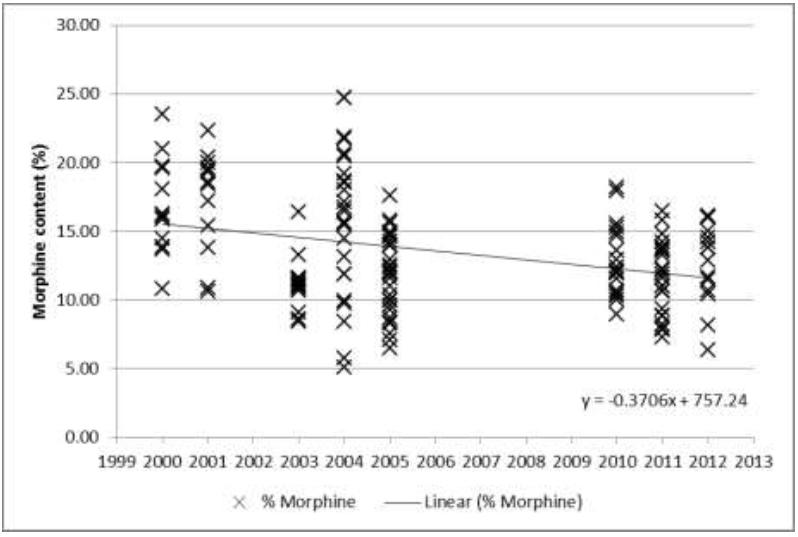
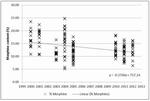
Figure 14 shows the morphine content of all opium samples collected between 2000 and 2012 with a linear trend line. Between 2000 and 2003, 39 opium samples from different regions of Afghanistan, which contained an average of 15.0% morphine content (95% confidence interval �1.32), |12| were analysed. In 2004 and 2005, a total of 56 opium samples was collected and analysed, which had an average morphine content of 13.6% (95% confidence interval �1.2). |13| From 2010 to 2012, 57 opium samples from all regions of Afghanistan were collected and analysed, which presented a statistically significant |14| lower average morphine content of 12.3% (95% confidence interval �0.7) |15| than the average from 2000 to 2005. A trend analysis of all yearly data reveals a statistically significant |16| declining trend of average morphine content.
Based on recent trends, the simple |17| average of the morphine content of all samples collected between 2010 and 2012 was used (12.3%) for the calculations in this section. When more data becomes available, the morphine content will be updated.
Figure 14: Morphine content (%) of all samples analysed between 2000 and 2012, with linear trend line.
Click to enlargeSource: UNODC, UNODC/MCN.
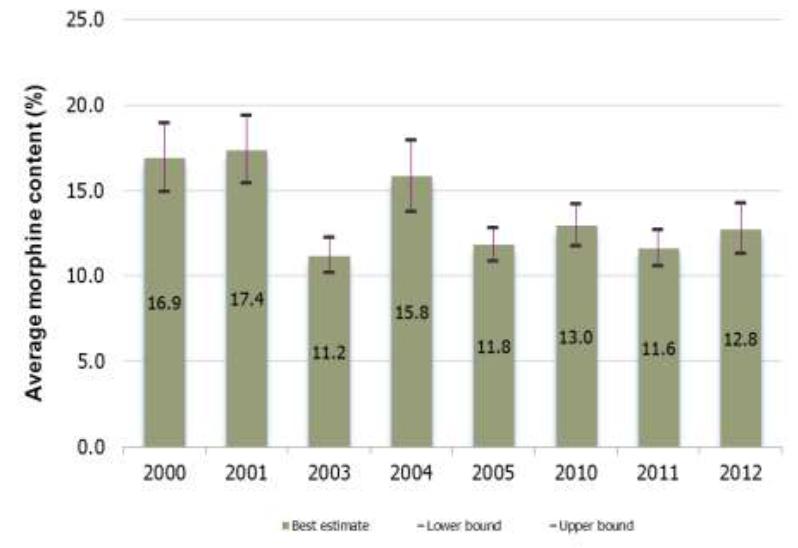
Figure 15: Average morphine content (%) in Afghan samples of oven-dry opium gum, 2000-2012
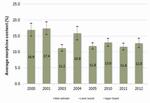
Click to enlargeNote: the error bars reflect the 95% confidence intervals of the annual means.
4.2.2 Estimation of the conversion ratio of opium to pure heroin base
The amount of raw opium needed for producing pure heroin base depends on two main factors: |18|
- the average morphine content of opium
- the efficiency of the heroin laboratory in extracting morphine from opium and in converting the yielded morphine to pure heroin base (laboratory efficiency).
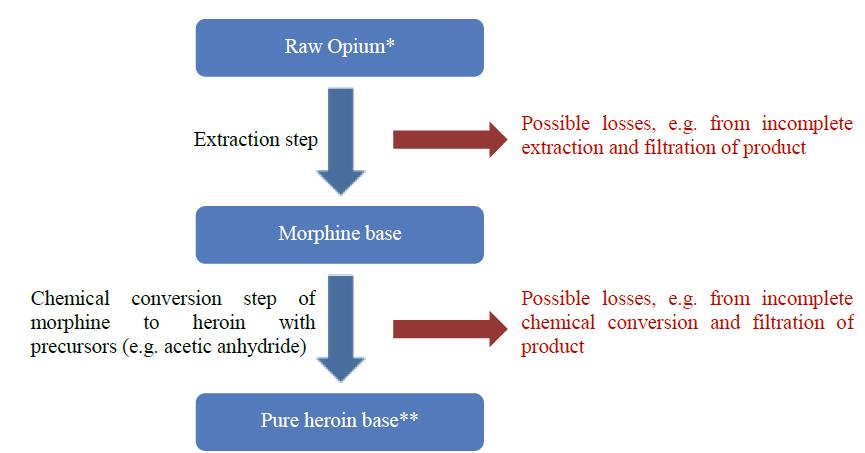
Raw opium is converted into heroin base in two main steps (see Figure 16 for a simplified flow chart). In the first step (the extraction step), morphine (and other alkaloids) are extracted from raw opium by adding hot water and chemicals such as calcium oxide and ammonium chloride. Theoretically, 100 kilograms of opium with an average morphine content of 12.3% |19| can yield 12.3 kilograms of pure morphine (12.3% of 100). However, in reality, traffickers are not well trained chemists and do not work under optimal conditions, thus it is unlikely that the full potential of raw opium is used, and a certain percentage of potential morphine production is lost at this stage.
Figure 16: Simplified flow chart illustrating the main stages of processing pure heroin base from opium.
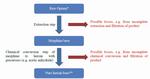
Click to enlargeNote: *oven-dried values are used in estimation; **For the purpose of comparability, 100% pure heroin base is considered.
In the second step, morphine base is converted to heroin base by adding precursor substances such as acetic anhydride. During this step, when it becomes pure heroin base, the morphine molecule gains two additional "acetyl groups" from the acetic anhydride. These additional molecules add weight to the morphine base: in an optimal scenario, when morphine is completely converted into pure heroin base, the heroin output is 1.29 |20| times heavier than the morphine used as input. Thus, 1 kilogram of pure morphine can theoretically yield 1.29 kilograms of pure heroin, if the reaction goes to completion. But this reflects only a potential weight gain as losses also occur at this stage.
The combined losses in both steps are reflected in "laboratory efficiency", which is a measure of the ability of traffickers and clandestine chemists to extract morphine from opium and to convert it into heroin. Laboratory efficiency is expressed as the percentage of actual amount of pure heroin base produced over the theoretically possible, maximum output (potential amount). Laboratory efficiency can vary substantially, depending on factors such as the skills and efforts of the chemists producing the heroin, the availability and quality of precursor substances, and the equipment used.
The number of kilograms of raw opium needed to produce a kilogram of pure heroin base is thus given by the inverse of the product of
average morphine content (%) x chemical conversion ratio (1.29) x laboratory efficiency (%).
While there is updated information on morphine content available, little is known about the laboratory efficiency of heroin laboratories in Afghanistan.
When the opium/heroin conversion ratio was revised in 2005, the underlying assumption was a laboratory efficiency of 60-70% together with a heroin purity range of 45-85%. These percentages were based on interviews with key informants and seizure data (purity).
In the same year, a study |21| conducted by the Federal Criminal Police Office, Wiesbaden, Germany was published, in which white heroin hydrochloride was produced by using locally seized substances and equipment. In this experiment, a laboratory efficiency |22| of 34% was achieved in the conversion of raw opium of low quality (8.5% morphine content) to pure heroin base. This is the only study available to date that has investigated laboratory efficiency in Afghanistan |23| under local conditions.
The main uncertainty surrounding the conversion ratio of opium to pure heroin base is thus due to a lack of information on the average efficiency of heroin laboratories in Afghanistan: the processing of illicit heroin from opium is normally carried out with readily available equipment such as buckets, barrels, pots and cloth. |24| Precursors and chemicals used, such as acetic anhydride, ammonium chloride, acids, bases and solvents, are of unknown purities. Furthermore, laboratory operators may be experienced but seldom have any background in chemistry. All these factors considered, laboratory efficiency can vary anywhere from 30% to 70% efficiency and an assumption of either percentage could be either a gross under- or over-estimation.
When estimating the quantity of pure heroin base yielded from annual Afghan opium production, UNODC/MCN uses a laboratory efficiency of 34% for the estimation of the conversion ratio of opium to pure heroin base.
Table 20: Conversion ratios of opium to pure heroin base corresponding to various morphine contents and a laboratory efficiency of 34% |25| (Kilograms of raw opium needed to produce a kilogram of pure heroin base)
Morphine content (%) Conversion ratio 12.3%
(average 2010-2012)18.5:1 15.0%
(average 2000-2003)15.2:1 Note: 12.3% is the average morphine content of all samples collected between 2010 and 2013; 15% is the average morphine content of all samples collected between 2000 and 2003 and was the basis for the 7:1 ratio introduced in 2005.
Table 21: Updated conversion ratio of opium to pure heroin base (Kilograms of raw opium needed to produce a kilogram of pure heroin base)
Estimate Conversion ratio Midpoint 18.5:1
(12.3% morphine content)Lower bound 19.6:1
(uses the lower limit of average morphine content)Upper bound 17.5:1
(uses the upper limit of average morphine content)As only a few studies on Afghan heroin processing have been undertaken so far, and only one considered laboratory efficiency, more research on heroin processing procedures and laboratory efficiencies in Afghanistan is needed for estimating a more accurate opium/heroin conversion ratio. Moreover, the collection of data on morphine content should be continued and the heroin conversion ratio should be updated at least once every five to ten years, so that the annual Afghanistan heroin production estimate is based on the most current available data.
4.2.3 Heroin of export quality
The amount of pure heroin produced can only be a theoretical measure of the heroin output of Afghanistan opium production: heroin is rarely traded in its pure form and comes as brown heroin base or white heroin (heroin hydrochloride). It is also cut with diluents such as caffeine, chloroquine, phenolphthalein and paracetamol. |26| When aiming to reflect local markets and estimate heroin availability for consumption, an estimate of the amount of heroin of export quality (quality of heroin traded by traffickers at the wholesale level) produced in a given year is a more informative measure. Pure heroin can only give a crude indication of market size.
Scarce data is available for the purity of heroin exported from Afghanistan. In 2012, Tajikistan reported purities of heroin at the wholesale level of 0.3% to 65%. |27| In 2013, the range was even larger (0.4% to 79%), but a typical range of 20% to 35% was also reported. |28| Kazakhstan (Republic of), reported ranges of 1.0% to 39.9% and 0.1% to 36.5% in 2011 and 2012, |29| respectively. In 2013, Kazakhstan reported a typical range of 20% to 25%. |30| No official data on the purity of heroin seizures in Afghanistan are available.
The United Kingdom, on the other hand, a destination country for heroin which receives Afghan heroin directly from Pakistan, reported purities of brown heroin of typically 45% (from 20% to 70%) in 2012. In the same year, Turkey, a transit country for the Afghan opiate trade to Europe, reported 52% (from 0.1% to 78%) purity of brown heroin. |31|
Table 22: Heroin purities at the wholesale level, as reported by selected countries
Country Heroin purity at the wholesale level (year) Kazakhstan* 0.1% to 36.5% (2012); Typical range: 20% to 25% (2013) Tajikistan* 0.4% to 79% (2013) Turkey** 52% (0.1% to 78% in 2012) United Kingdom** 45% (20% to 70% in 2012) Sources: *Paris Pact Initiative and **World Drug Report 2014;
Numbers in parenthesis are minimum and maximum values.
Heroin of high purity is smaller in volume than heroin of low purity, so it is easier to transport. Drug traffickers therefore have an incentive to traffic heroin of high purity and to cut it only when it gets close to its destination country. When estimating the amount of heroin of export quality produced, an average purity of 52% for wholesale is thus assumed (purity reported by Turkey in 2012).
Based on the conversion ratios of opium to pure heroin base, the amount of opium with a 12.3% morphine content needed to produce 1 kilogram of 52% pure heroin is 9.6 kilograms (9.1 to 10.2 kilograms), yielding a 9.6:1 ratio for converting opium to heroin of export quality.
Table 23: Amount of opium needed to produce a kilogram of heroin base of export quality (52% purity) with opium of 12.3% morphine content and 34% laboratory efficiency (Kilograms of raw opium needed to produce a kilogram of pure heroin base)
Kilograms of opium needed to produce a kilogram of heroin of export quality 9.6:1 (9.1:1 to 10.2:1) 4.2.4 Estimation of 2014 potential heroin production with updated heroin conversion ratio
Apart from morphine content, none of the factors in the opium-to-heroin estimation chain are well researched. The use of an average laboratory efficiency of 34% for the estimation of the conversion ratio of opium to pure heroin base is based on very little evidence, as only one study is available. Even less is known about the average purity of heroin produced in Afghanistan. The following has therefore to be considered as a rough estimate and more as an indication of the order of magnitude than as a precise measurement.
Based on information from 2011-2013 on the distribution of opium, morphine and heroin seizures in Afghanistan and neighbouring countries, and assuming a 52% purity of heroin of export quality, it can be estimated that out of every 100 kilograms of opium, 62 kilograms are converted into heroin of export quality and 38 kilograms are left unprocessed. |32|
The following table shows potential production of pure heroin and of heroin of export quality if 62% of potential opium production is converted to heroin and if all opium is converted to heroin.
Table 24: Potential heroin production from Afghan opium, 2014
If 62% of potential opium production converted (tons) If total potential opium production converted (tons) Pure heroin base 210
(160-270)350
(260-440Heroin of export quality (52% purity) 410
(350-470)670
(560-760)Unprocessed opium 2,450
(1,960-2,970)- A ratio of 18.5:1 (17.5:1 - 19.6:1) is used for converting opium to pure heroin base. For converting opium to 52% pure heroin, 9.6 kilograms (9.1 to 10.2 kilograms) of opium are assumed to be needed.
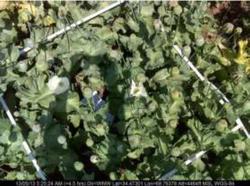
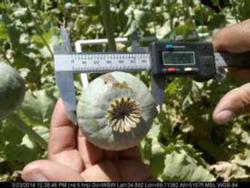
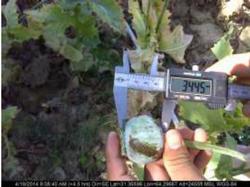
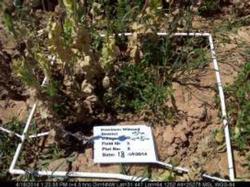
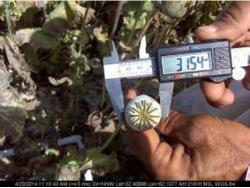
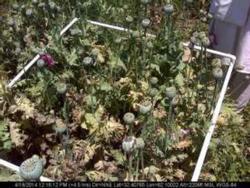
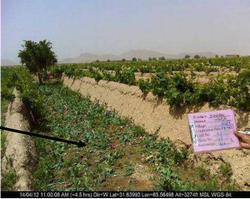
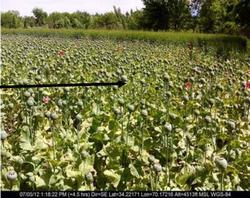
Figure 17: Photographs of yield survey 2014
Yield survey in Kabul province (Central region), 2014
Yield survey in Hilmand province (Southern region), 2014
Yield survey in Farah province (Western region), 2014
5 Opium prices and farm-gate value of opium
Opium prices remained high in 2014 but decreased in all regions of Afghanistan, making 2014 the third year to show a decreasing trend since the price hike caused by the 2010 poppy disease.
MCN/UNODC has monitored opium prices in selected provinces of Afghanistan on a monthly basis since 1994 (18 provinces as of September 2011). In 2008/2009, opium prices were at a low level but increased after that, most noticeably in the Eastern, Southern and Western regions, before reaching a maximum in 2011 after the unusually poor harvest caused by a disease of the opium poppy.
In 2011, opium prices started to decrease around harvest time in some regions, but remained volatile and at a higher level than in any year since 2005 (in absolute terms, not adjusted for inflation). This decrease can be explained by the relatively good 2011 harvest, since when reported opium prices have shown a decreasing trend in all regions, with an overall decrease of 23% between 2013 July and 2014 July. Dry opium prices reported by traders showed the same decreasing trend in all regions, with an overall decrease of 29% in the same period.
Table 25: Regional farm-gate prices of dry opium at harvest time, reported by farmers through the price-monitoring system, 2013-2014 (US dollars per kilogram)
Region Average dry opium price (US$/kg) 2013 Average dry opium Price (US$/kg) 2014 Change 2013-2014 (%) Central 221 142 -36% Eastern 171 113 -34% North-eastern 89 60 -33% Northern 109 112 3% Southern 161 129 -20% Western 209 178 -15% National average weighted by production* 172 133 -23% Figure 18: Regional average price of dry opium reported by traders, January 2005 to August 2014 (US dollars per kilogram)
Click to enlargeSource: MCN/UNODCMonthly Price Monitoring System.
Table 26: Dry opium prices reported by traders, by region, August 2013-August 2014 (US dollars per kilogram)
Region Regional average price
(US$/kg) August-2013Regional average price
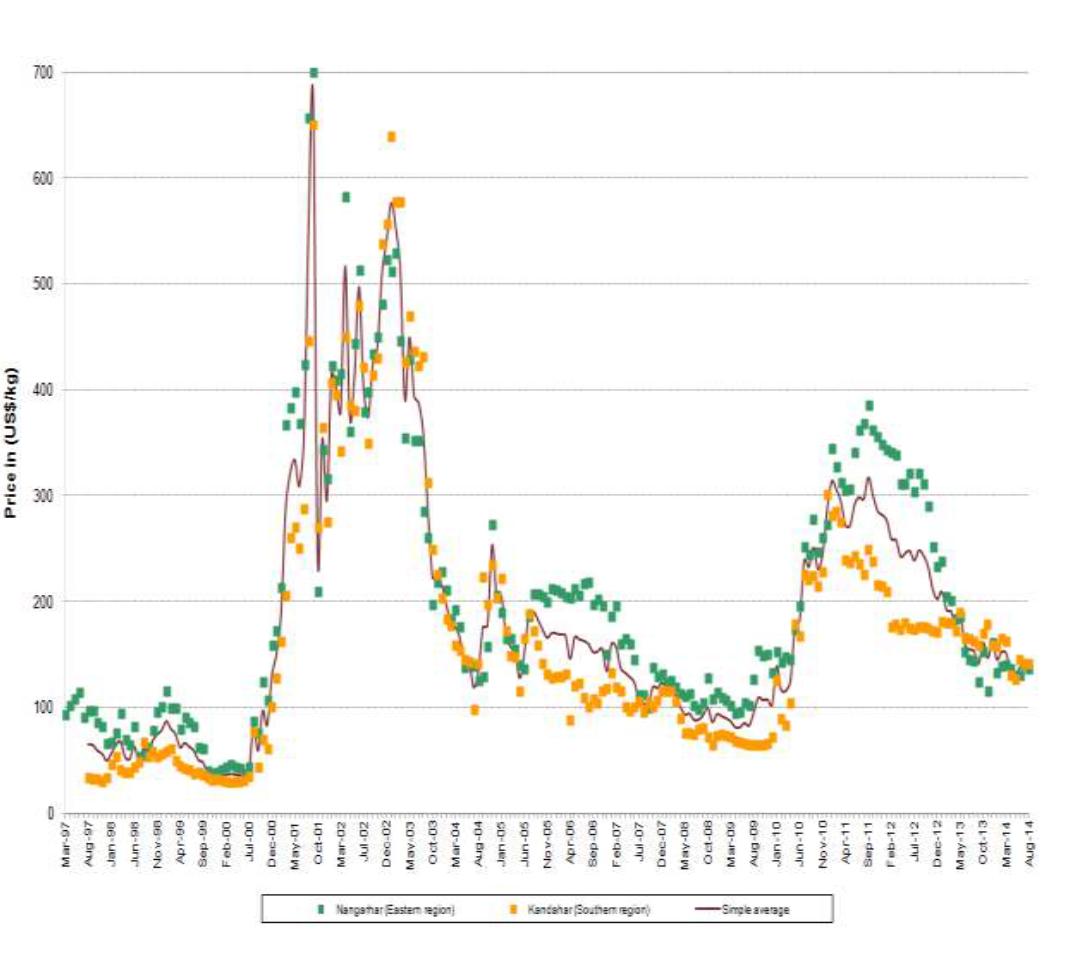
(US$/kg) August-2014Change 2013-2014 (%) Trader Trader Eastern region (Kunar, Laghman, Nangarhar) 145 129 -11% Southern region (Hilmand, Kandahar) 163 146 -10% Western region (Badghis, Farah, Ghor, Hirat, Nimroz) 192 210 9% North-eastern region (Badakhshan, Kunduz, Takhar) 107 89 -17% Northern region (Balkh, Faryab, Kunduz) 112 112 0% Average 144 137 -5% Figure 19: Monthly prices of dry opium in Kandahar and Nangarhar province, as collected from March 1997 to August 2014 (US dollars per kilogram)
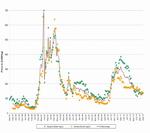
Click to enlargeSource: MCN/UNODC Monthly Price Monitoring System.
5.2 Farm-gate value of opium production
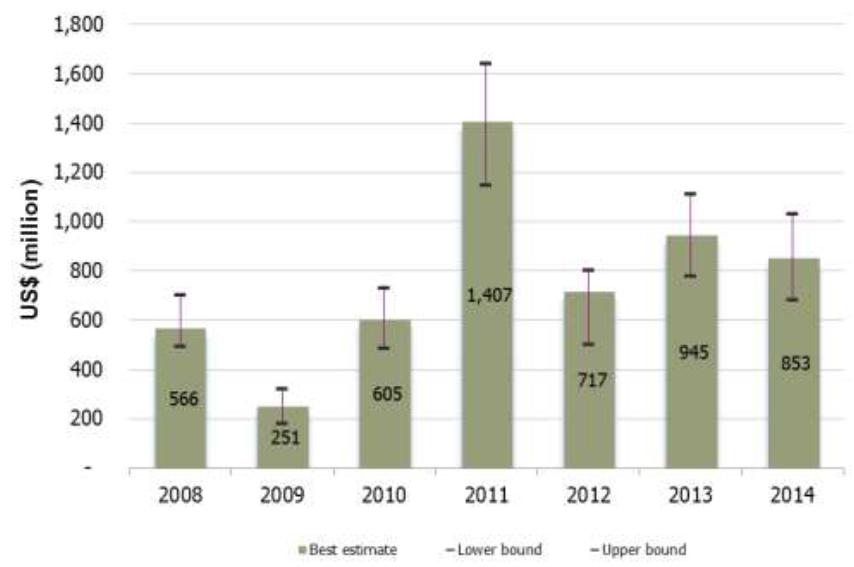
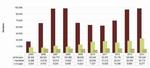
Amounting to US$ 853 million (US$ 680-1,030 million), the farm-gate value of opium production in 2014 decreased by 13% from its 2013 level. The decrease in farm-gate value was mainly due to the 23% price decrease.
Farmers in Hilmand, the country's largest opium-producing province, earned some US$ 394 million, which was equivalent to 46% of the total farm-gate value of opium production in Afghanistan in 2014; a decrease of 13% from 2013 (US$ 945 million).
Figure 20: Farm-gate value of opium production in Afghanistan, 2008-2013 (Million US dollars)
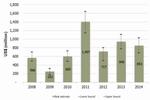
Click to enlargeFigures for 2008 and 2009 were recalculated from the revised opium production estimates, see MCN/UNODC Afghanistan Opium Survey 2012. Ranges were calculated proportionally to the previously published estimate.
This chapter covers various methodological aspects regarding survey design and estimation procedure.
6.1 Estimation of area under opium cultivation
Remote sensing methodologies have been used by UNODC since 2002 to monitor the extent of opium cultivation in Afghanistan. Changes in the location of opium poppy cultivation and the increased security difficulties involved in accessing the area under scrutiny require continuous improvements of the sampling designs applied.
A sampling approach is used to cover those provinces where most of the poppy is found, whereas a targeted approach is used in provinces with a low level of opium cultivation. "Targeted approach" means that a certain area of a province is fully covered by satellite imagery.
In 2014, out of 34 provinces in Afghanistan, 11 were sampled and 11 were targeted. The remaining 12 provinces were considered to be poppy-free |33| based on information from the field. These provinces were not covered by the remote sensing survey, but were covered by the village survey.
Table 27: Area estimation method, by province, 2014
Region Targeted approach Sampling approach Village survey only Central Kabul Ghazni, Khost, Logar, Paktya, Panjshir, Parwan, Wardak, Paktika Eastern Kapisa, Laghman, Nuristan Kunar, Nangarhar Nuristan Northern Baghlan, Balkh, Faryab, Jawzjan, Sari-Pul Bamyan, Samangan North-eastern Takhar Badakhshan Kunduz Southern Day Kundi, Hilmand, Kandahar, Uruzgan, Zabul Western Ghor, Hirat Badghis, Farah, Nimroz 6.1.1 Area estimation based on sampling methods and targeted approaches
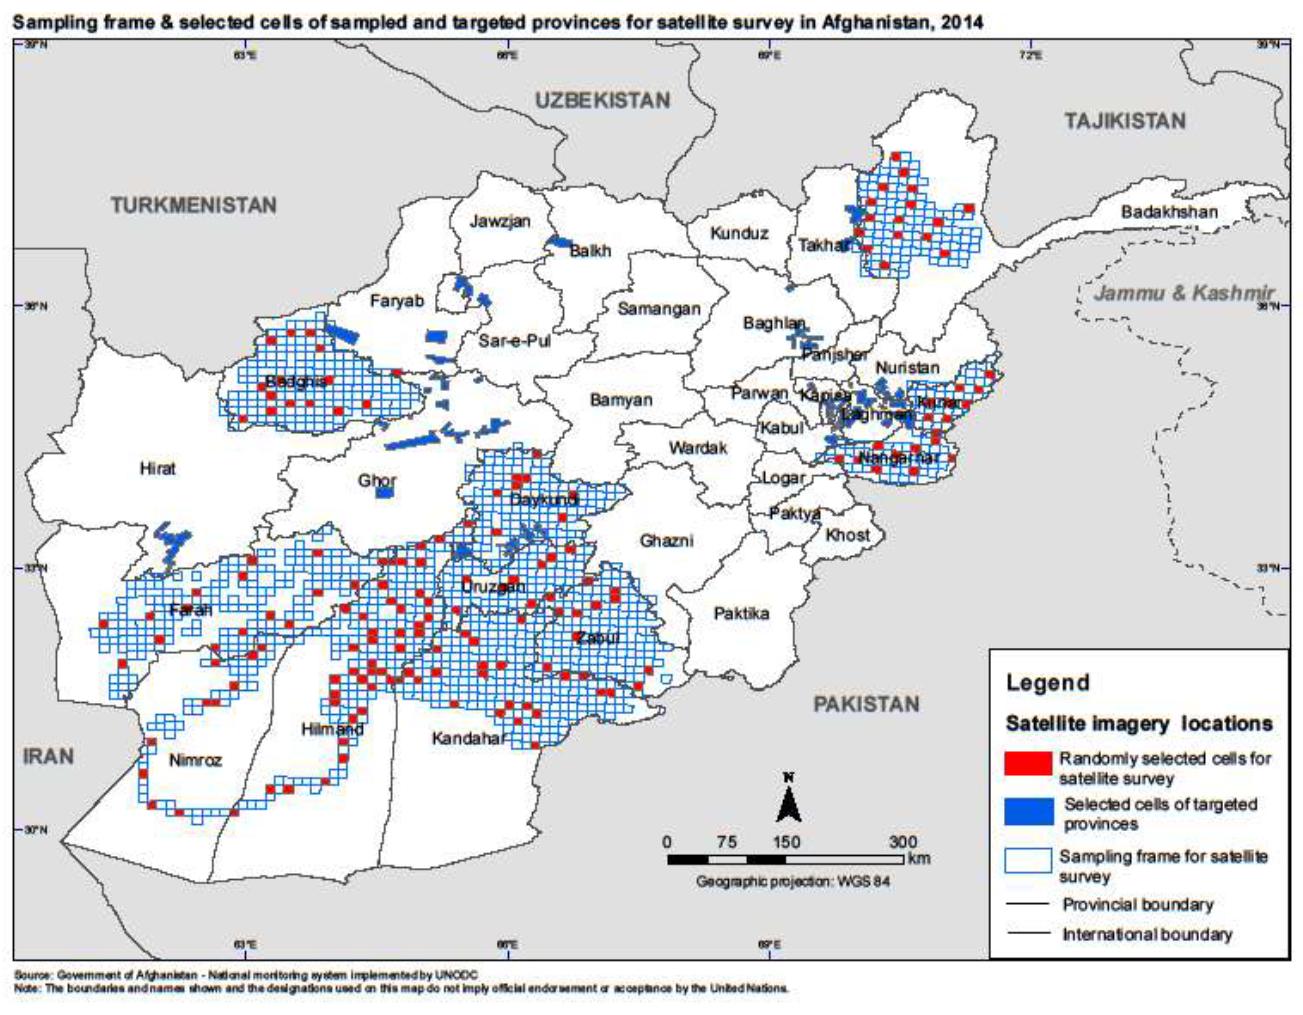
6.1.1.1 Sampling frame
The area available for agriculture was updated based on Landsat 8 ETM images and DMC images. The total estimated agricultural area in Afghanistan in 2014 amounted to 78,753.04 km2. The sampling frame was established by extracting the area of land potentially available for opium cultivation in 11 provinces. This area was divided into regular 10 km by 10 km grids, which constituted the sampling frame. The final sampling frame, from which the satellite images were randomly selected, consisted of 1,463 cells in 11 provinces. In the case of images that cut across provincial boundaries, only the part falling into a particular province was considered to be in that province.
The area available for agriculture in the sampling frame covers irrigated and rain-fed land. The total area in the 11 provinces was 23,563 km2, which is equivalent to 30% of all potential agricultural land in Afghanistan. Potential land refers to all land available for cultivation and also includes land that is currently fallow.
Cells containing less than 1 km2 of potential agricultural land were excluded from the sampling frame in order to reduce the likelihood of choosing cells with very little arable land. In total, the exclusions represented less than 2% of the total potential agricultural land.
In 2014, high-resolution satellite images were acquired for 163 sampled locations 10 km by 10 km in size, covering a total of 11 provinces and 65 locations, for the 11 target provinces in Afghanistan.
Table 28: Sample size, agricultural land and sampling ratio, by province, 2014
Province Total arable land (km2) Total Selected % of selected cells over total cells Arable land in selected cells Sample size (% of arable land in selected cells) # cells # cells (km2) Badakhshan 3,983 130 16 12% 587 15% Badghis 6,515 180 15 8% 808 12% Day Kundi* 585 140 8 6% 55 9% Farah 1,868 187 16 9% 146 8% Hilmand 3,872 199 40 20% 927 24% Kandahar* 2,938 214 22 10% 165 6% Kunar 240 57 9 16% 51 21% Nangarhar 804 59 9 15% 126 16% Nimroz 948 68 10 15% 176 19% Uruzgan* 770 84 10 12% 93 12% Zabul* 1,040 145 8 6% 43 4% Total 25,563 1,463 163 11% 3177 13% * The sampling locations were changed or newly introduced in these provinces.
The sample size (meaning the number of images acquired in each province) was approximately proportional to the square root of the area of potential agricultural land. This allocation methodology is one form of compromise between the appropriate allocations for producing national estimates and for producing provincial estimates. A minimum number of eight sample cells was set. The total number of images was constrained by cost considerations and the maximum number of images that the satellite provider could handle given the limited time window for each image.
The same image locations as in 2013 were used in 2014 for 7 out of the 11 sampled provinces. To account for the dynamics of poppy cultivation and the re-allocation of Gizab district from Day Kundi to Uruzgan, the provinces of Day Kundi, Kandahar, Uruzgan and Zabul were re-sampled.
In greater detail, the following methods were used:
In the provinces of Day Kundi, Farah, Hilmand, Kandahar, Nimroz, Uruzgan and Zabul, the study area ("frame") was divided into compact geographical strata of approximately equal area by applying a clustering algorithm ("k-means") in the statistical software R. In each stratum, two sampling locations were selected by simple random sampling. This method ensured a good geographical coverage by sampling locations while allowing for an unbiased estimation of the variance. In Hilmand and Nimroz, the area was additionally separated in two substrata: in Hilmand, this accounted for the lower poppy cultivation density in the former "Food Zone"; in Nimroz, it accounted for the high concentration of poppy cultivation in Dilaram district. This allowed the provision of two separate poppy estimates in Hilmand: one for the total area under cultivation in the province; and one for the area under cultivation within the former (2012) Food Zone. Gizab district was targeted.
In Badakhshan Nangarhar and Kunar provinces, a one-stage systematic random sampling approach was employed in which a sampling rule was applied that ensured good geographic coverage. Starting from a randomly chosen cell, every kth element from then onwards was chosen, where k is determined by the number of cells in the frame and the desired sample size (the actual sample size might differ slightly). To avoid adjacent cells, every other line was skipped.
In Nangarhar province, the districts Dara-e-Nur, Kuzkunar, Kama, Behsud, Jalalabad and partially Surkhrod were excluded from the frame.
In the remaining provinces, a historically grown, non-random sample was used. It is also planned to apply a new sampling strategy in these provinces in 2015.
6.1.2 Area estimation in sampled provinces
The estimation of the extent of opium poppy cultivation is a ratio estimate for each of the provinces, using potential agricultural land as an auxiliary variable. The national estimate was obtained by adding up the provincial estimates in what is known as a separate ratio estimate.
The Hansen-Hurwitz estimator is one method of estimating the extent of opium poppy cultivation when the probability of selecting sampling units is not equal.
An unbiased estimate of the area of opium poppy cultivation, Ak, within province k:
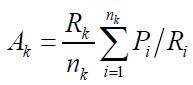
where nk is the number of satellite image locations within the province.
Pi is the area of poppy cultivation in image i.
Ri is the area of land potentially available for poppy cultivation (risk area) in image i.
Rs is the total potential land available for poppy cultivation (risk area) from the sampling frame in province k.In the newly sampled provinces with equal inclusion probability, a slightly different ratio estimate that uses agricultural area as regressor was used. An unbiased estimate of the area of opium poppy cultivation, Ak, within province k
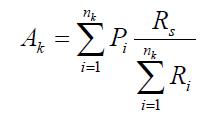
with the same notation, as above.
Sampling frame & selected cells of sampled and targeted provinces for satellite survey in Afghanistan, 2014
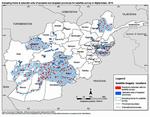
Click to enlarge6.1.2.1 Uncertainty
In Day Kundi, Farah, Hilmand, Kandahar, Nimroz, Uruzgan and Zabul, the confidence intervals were calculated following statistical practice. |34|
In all remaining provinces where no unbiased estimator for the variance was available, confidence intervals were calculated using the bootstrap method with 100,000 iterations. Bootstrapping consists of re-sampling with replacements from the original sample. After each iteration, the area under cultivation is estimated. After 100,000 iterations a distribution of cultivation areas can be observed and the 95% confidence interval is derived by using the 2.5 and 97.5 percentiles.
In Badakhshan the lower confidence interval was calculated by summing up the poppy in the sample and subtract eradicated area.
Table 29: Area estimates of sample provinces with 95% confidence interval, 2014 (Hectares)
Province Point estimate (Hectares) Lower bound (Hectares) Upper bound (Hectares) Badakhshan 4,204 1,269 11,225 Badghis 5,721 1,171 13,619 Day Kundi 587 192 841 Farah 27,513 13,722 41,305 Hilmand 103,240 91,026 114,063 Kandahar 33,713 24,850 42,712 Kunar 754 346 1,467 Nangarhar 18,227 8,690 26,634 Nimroz 14,584 10,420 18,744 Uruzgan 9,277 2,803 18,705 Zabul 2,894 668 5,145 Target provinces 3,623 NA NA National 224,337 196,443 246,805 National (rounded) 224,000 200,000 200,500 To express the uncertainty associated with the national area estimation, which includes the provinces covered by the targeted approach and the sample provinces, but excludes provinces with an estimate of less than 100 hectares (which are considered "poppy-free" and not counted), a range was calculated by adding the poppy area figures of the target provinces to the upper and lower limits of the 95% confidence interval at the national level.
6.1.3 Area estimation in target provinces
The consensus view of those working in Afghanistan was that the MCN/UNODC surveillance system developed in the provinces can identify sites where poppy was grown, with further inputs being obtained from the survey of village headmen. Fieldworkers visited potential poppy-growing sites to confirm the situation and provided GPS references for the sites. If geographical clusters of sites were identified, targeted satellite images were obtained to measure the areas involved. The total poppy area of a target province is equal to the poppy area measured on the imagery without any further calculation. For a list of provinces for which the target approach was used see Table 4.
In provinces where satellite images were targeted, the estimated area under opium cultivation is not affected by sampling errors, although they may be affected by the omission of areas with very little cultivation. Area estimates of target provinces should therefore be considered as a minimum estimate.
6.1.4 District level estimation
District level results are indicative only. A combination of different methods is used. If districts are covered by sampled cells, the average value of these cells is used. In the case of districts where sampled cells were not available, two methods were used to calculate district estimates. If the agricultural area of a district with a sample grid extended into a neighbouring district(s) without interruption, the poppy proportion of the sample grid was also used for the neighbouring district(s). For districts with isolated, non-contiguous agricultural areas, the average poppy proportion of the province was applied. The methodology and sample was not designed to produce results at the district level.
6.1.5 Accuracy assessment
Due to the difficult security situation in many parts of Afghanistan, which prevented surveyors from carrying GPS and mapping equipment, an insufficient number of ground segments could be visited in order to conduct a systematic accuracy assessment.
6.1.6 Estimation of the net cultivation area
The area figure presented is the net harvestable opium poppy cultivation area. The effect of poppy eradication activities was taken into account based on data from the eradication verification survey, which provides exact GPS coordinates of all eradicated fields supplemented with additional information. The gross cultivation areas would be the net cultivation plus eradication.
In provinces where the poppy area is estimated with a sampling approach, the first step is to calculate the gross poppy cultivation area. The total area eradicated in those provinces is then deducted from the mid-point estimate of the provincial cultivation estimate to obtain the net cultivation area. If eradication activities were carried out after the date of the image acquisition, no adjustment is necessary as the poppy present in the image reflects the gross poppy area. If eradication activities were carried out in a sample block before the date of the image acquisition, the area interpreted as poppy would not reflect the gross area. Therefore, the eradicated fields are added to the interpreted fields. The adjusted poppy area figure for the block is then used for the provincial estimate.
In provinces where the poppy areas is estimated with a targeted approach (census), eradication activities that happened before the date of the image acquisition are already reflected, as these fields no longer appear as poppy in the image. Fields that were eradicated after the date of the images acquisition are simply deleted.
6.2 Satellite image interpretation
6.2.1 Acquisition of satellite images
The acquisition of satellite images at the appropriate growth stage of the opium poppy is key to the successful identification of opium poppy fields on satellite images. Satellite data is collected at two stages: the pre-harvest (flowering) stage and the post-harvest (post-lancing) stage. In recent years, detailed information on the crop growth cycle of each district has been collected in the form of a phenological chart, which is useful for deciding on appropriate dates for satellite data acquisition. First-dated images of the Southern, Eastern and Western regions are collected during March and April due to the early cultivation and maturity of crops in those regions. The crop growth cycle begins later as one goes northward. Images of the North and North-eastern region are acquired during May, June and July. Second-dated satellite images are collected approximately two months after the first images are collected.
The normal time window for satellite data acquisition is one month, depending on the scheduled passing of satellite and weather conditions. The time window for first-dated image acquisition begins at the full flowering stage and continues through the capsule stage. Second-dated image acquisition begins towards the end of the lancing stage and continues until the opium poppy fields are ploughed. Images acquired in the middle of the prescribed time window facilitate optimum discrimination between opium poppy and other crops.
The figure below illustrates the spectral characteristics (Normalized Difference Vegetation Index; NDVI) of opium poppy and other crops between February and June. Wheat and opium poppy have the same growth cycle between March and June, as illustrated. The spectral differences between those two crops are more pronounced in February, which marks the beginning of the capsule stage of the crop in this example. Poppy fields are ploughed immediately after the harvest, whereas wheat fields are not. That is why two-dated images (pre-harvest and post-harvest) are collected for the same location.
Figure 21: Spectral reflectance of opium poppy and other crops
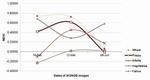
Click to enlargeThe figure above illustrates the growth cycles of opium poppy, wheat and clover from February to June, with the help of ground photographs. Note that maximum visual discrimination between opium poppy and other crops is possible during the flowering/capsule stage and after capsule lancing. The different phenological stages described above are shown in the figure on the previous page (field photographs of opium poppy, wheat and clover on different dates).
Figure 22: Image classification methodology for estimating opium cultivation area
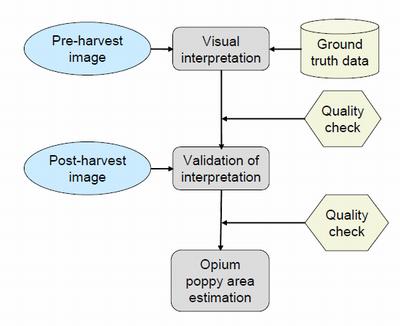
6.2.2 Interpretation of opium cultivation from satellite images
First-dated images were acquired during the flowering or capsule stage and second-dated images were acquired after the opium harvest. For example, wheat appears mostly in bright red on the first date image in false colour composite (full coverage with vegetation appears in red; bare soil in grey/green), while opium poppy fields are shown in tones of pink. Although there can be some confusion between opium poppy and wheat in the first-dated images, the acquisition of second-dated images makes it possible to distinguish opium poppy from other crops, because the opium poppy crop has been harvested and the fields appear in grey/green.
Visual interpretation was used to delineate opium poppy fields by interpreting IKONOS images covering a 10 km by 10 km area. Ortho-rectified IKONOS, QUICKBIRD, WORLD-VIEW2 and GEO-EYE images of 1 m resolution and 0.5 m resolution (PAN-sharpened) were used for this purpose. Opium poppy was initially identified using first-dated high resolution images. Ground truth information collected in the form of segment maps and GPS points was also useful in identifying opium poppy fields. The interpretation based on first-dated images was improved using patterns of observation in second-dated images. Aerial photographs of the poppy fields were acquired using helicopters in the provinces of Kandahar and Hilmand during the eradication season, as well as in Kabul, Kapisa, Kunar, Laghman and Nangarhar provinces during the flowering and capsule stages. These photographs were tagged by latitude and longitude and facilitated to locate the poppy areas on satellite images, and were very helpful in confirming the poppy areas in the satellite images. Poppy field boundaries in 2012 were delineated by an onscreen digitization method.
6.2.2.1 Band combination for opium poppy identification
Two kinds of band combination were used to detect opium poppy. True-colour combination (blue, green, red) was used in areas where land use is dominated by opium (for example, Hilmand and Kandahar) and in cases where images were obtained during the flowering and lancing stages of opium poppy. False-colour combination (infra-red, red, green) was used in almost all cases. Analysts used both combinations simultaneously to optimize discrimination between opium poppy and other crops.
Some of the images could not be acquired at the appropriate time due to weather conditions and/or the time at which the satellite passed. The delayed acquisition of images makes it difficult to detect opium poppy, since fields may be at the senescence stage due to the lancing of capsules and can therefore be confused with fallow fields. In such cases, second-dated images are often useful in confirming opium poppy fields, since harvest patterns are different for wheat and opium poppy.
6.2.2.2 Ground reference information
Ground reference data were collected in the form of GPS points, field photographs and aerial photographs. Some 1,854 GPS points of poppy fields, supported with pictures, were collected from the provinces of Takhar, Sari Pul, Baghlan, Balkh, Faryab, Kapisa.
GPS point data were superimposed over the ortho-rectified satellite images to facilitate identification of poppy fields during visual interpretation.
Figure 23: Use of geo-referenced ground photos for image interpretation
Satellite image (infra-red) Field photograph (natural colour) Natural colour aerial photographs acquired from helicopters were co-related with the satellite images to identify poppy from other crops, as shown below.
Figure 24: Use of aerial photos for image interpretation
Satellite image (infra-red) Aerial photograph (natural colour) 6.2.2.3 Advantage of two-dated images
Visual interpretation of single-dated very high-resolution images was a relatively easy task in Hilmand, Kandahar, Uruzgan, Farah and Nimroz provinces. This was due to larger field sizes and timely acquisition of the images. Interpretation in target provinces Nangarhar, Laghman, Kunar, Kabul, Kapisa, Hirat, Ghor, Baghlan, Faryab and Badakhshan was easy with the help of GPS points and aerial photographs. Interpretation of images in Badghis and Zabul was more difficult since the spectral signatures of opium poppy were not as clear as in Hilmand, Kandahar, Uruzgan and Nangarhar. The second-dated images were useful to distinguish poppy from barley, wheat and grapes in certain provinces, namely Kabul, Kandahar and Nangarhar, particularly where the first-dated images were acquired late during the senescence stage. The second-dated (post-harvest) images were therefore useful in confirming whether the opium poppy on the first-dated images had been correctly identified. Image acquisition at two different times (pre- and post-harvest) is thus proven to be essential in such cases.
Figure 25: Advantage of two-dated images, Kabul and Kandahar, 2009
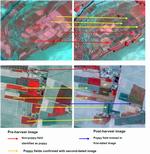
Click to enlarge6.2.2.4 Quality control
A quality control mechanism was applied to the image interpretation process, with each analyst's work being checked by two other experts. Both first-dated and second-dated images were crosschecked.
All fields determined as likely to be under opium cultivation (potential opium poppy fields) were delineated on the basis of the interpretation of first-dated satellite imagery. In some cases a second-dated image was acquired for the purpose of confirmation. The corrections involved a few commissions and omissions.
6.3 Opium yield and production
6.3.1 Estimating opium yield
The relationship between poppy capsule volume per square metre and dry opium yield is used to estimate opium production. |35| It takes the form of a non-rectangular hyperbola.
Non-rectangular hyperbola formula for opium yield as function of capsule volume:
Y = [(VC + 1495) - ((VC + 1495)2 - 395.259 VC)0.5] / 1.795
where
Y = Dry opium gum yield (kg/ha), and
VC = Mature capsule volume (cm3/m2).
In the yield survey, data on the number of yield capsules per plot and capsule volume are collected. The survey follows the procedure established in the UNODC Guidelines for Yield Assessment.
An imaginary transect was drawn on each surveyed field, along which three one-metre square plots were selected. In each plot, the number of flower buds, flowers, immature capsules and mature capsules that were expected to yield opium were counted, and the diameter and height of 10 to 15 opium-yielding capsules were measured with a calliper. The capsule volume per square metre was calculated with these data and entered into the formula for the yield calculation. Each plot thus provided one yield observation. The simple average of the three plots in a field is the field yield. The simple average of all fields in a region is the regional yield. A range was calculated to express the uncertainty of the yield estimate due to sampling with the 95% confidence interval.
Table 30: Regional opium yield values with 95% confidence intervals, 2014 (Kilograms per hectare)
REGION Best estimate Lower bound Upper bound Central 48.5 43.6 53.5 Eastern 39.6 28.3 50.8 North-eastern 38.2 34.1 42.4 Northern 34.5 27.1 41.9 Southern 29.5 25.0 34.0 Western 20.4 16.9 23.9 National weighted by opium cultivation 28.7 23.8 33.6 6.3.2 Changes to the yield survey and data quality
Since 2012, the yield survey has been significantly reduced in comparison to previous years. Due to the increasingly difficult security situation, only fields where it was possible to complete the survey without time pressure were visited. Furthermore, training was improved and surveyors worked in pairs rather than alone. The survey is therefore no longer statistically representative.
To further enhance data quality, data quality checks developed with external experts were applied. The statistical tests developed in 2011 |36| were applied to the capsule measurements, i.e. to the values reported regarding height and diameter, and thus the resulting capsule volumes. Regarding the number of capsules contributing to yield per plot, no systematic tests are available.
The results showed that data continued to be of a high quality. In 2014, only data collected in one single village in Badakhsan (3 fields) had to be excluded. MCN and UNODC continue to work on improving the yield surveys.
Table 31: Yield survey villages and fields surveyed (all data), 2009-2014
2009 2010 2011 2012 2013 2014 Number of villages 248 240 232 41 48 45 Number of fields (max. 3 per village) 699 685 685 114 142 134 Number of plots (3 per field) 2,415 2,040 2,055 342 426 401 Number of capsules measured 26,901 20,474 20,769 3,211 4,009 3,474 6.3.3 Estimating opium production
Opium production was calculated by the estimated regional area under opium cultivation being multiplied by the corresponding regional opium yield. All opium estimates in this report are expressed in oven-dry opium equivalent, i.e. the opium is assumed to contain 0% moisture. The same figure expressed in air-dry opium, i.e. opium under "normal" conditions as traded, would be higher as such air-dry opium contains some moisture.
The point estimates and uncertainties of the opium production estimate due to sampling of the area under poppy cultivation and yield can be expressed as ap � Δa and yp � Δy, respectively, where the uncertainty is determined from the 95% confidence intervals.
These uncertainties will impact on the estimate of production (pp � Δp, or equivalently expressed as the range (pp - Δp , pp+ Δp)), where the best estimate pp = apyp, such that
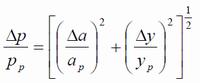
expresses the error in production, Δp, resulting from uncertainty in the estimates for cultivation area and yield.
For targeted regions there is no sampling error in the area under cultivation. In such cases, the error in production relates only to the uncertainty in the yield and is given by Δp = ppΔy / yp
6.3.4 Estimating heroin production
The proportion of opium converted into morphine and heroin was derived from seizure data in Afghanistan and its neighbouring countries. A three-year average of all reported amounts was taken. In order to estimate the share of opium converted to heroin, all heroin and morphine seizures are converted into opium equivalents by applying the opium to heroin conversion ratio for heroin of export quality.
As seizures are often driven by pure chance and seizure data have some inherent uncertainties, changes should be interpreted with caution. Information from the CNPA laboratory indicates that not all assumed seizures of heroin turn out to actually contain heroin, or they contain heroin in combination with various other substances. |37| This is rather typical for seizures and not specific only to Afghanistan.
Table 32: Proportions of opiate seizures in Afghanistan and neighbouring countries (Percentage)
Distribution 2010 2011 2012 Average 2010-2012 weighted by amounts seized Opium 63% 50% 41% 52% Heroin and morphine combined 37% 50% 59% 48% 6.4 Verification of Governor-led eradication (GLE)
UNODC/MCN has improved field-based verification activities since 2010 by enhancing the control mechanism. The areas verified by eradication verifiers were randomly checked by the team leader and UNODC/MCN survey coordinators for validation of the reported figures. A total of 124 eradication verifiers were trained in eradication verification techniques and deployed in a phased manner to provinces where eradication activities were envisaged. The eradication verifiers were part of the eradication teams led by the respective provincial governor. Verifiers reported to the office of Provincial Governors in the last week of February 2013.
Verification methodology for GLE:
- Eradication verifiers were part of the Governor-led eradication teams.
- The verifiers took measurements of each eradicated field by their pace length, converted them into metres and calculated the area in jerib (1 jerib=2000 m2), collected field coordinates using new GPS cameras and took photographs.
- The verifiers drew sketch maps of each field as a reference for area calculations.
- The verification-reporting officers in Kabul obtained the provisional data from the verifiers by telephone (mobile/satellite phones) and updated the database on a daily basis.
- The verifiers filled in hardcopy survey forms and submitted them to UNODC regional offices. The forms were then sent to the Kabul office for data entry. Quality control was undertaken by MCN/UNODC survey coordinators at the regional level. Eradicated fields were revisited randomly by team leaders and MCN/UNODC survey coordinators to check the accuracy of the reports. Further validation of the results was done using data obtained through helicopter flights, as well as from satellite imagery, to calculate the final area of eradicated poppy fields wherever possible.
- In Hilmand province, the area calculations of the eradicated poppy fields was facilitated by calculating the area of fields automatically using a standard template in Excel file, thus avoiding manual calculation errors at the field level.
- MCN/UNODC published periodical reports on a weekly basis to inform stakeholders of eradication activities. The eradication figures provided in these reports were considered provisional until they were finalized based on field checks and/or checks based on the satellite image interpretation.
6.5 Average farm-gate price and farm-gate value of opium production
Since 2009, farm-gate prices at harvest time have been derived from the opium price monitoring system and refer to the month when opium harvesting actually took place in the different regions of the country, which is thought to reflect opium prices at harvest time better. To calculate the national average price, regional price averages were weighted by regional opium production. The opium price in the Central region was calculated from the annual village survey, as there is no monthly opium price monitoring in that region.
The farm-gate value of opium production is the product of potential opium production at the national level multiplied by the weighted average farm-gate price of dry opium at harvest time. The upper and lower limits of the range of the farm-gate value were determined by using the upper and lower opium production estimate.
[Source: United Nations Office on Drugs and Crime, Ministry of Counter Narcotics of the Islamic Republic of Afghanistan, Vienna and Kabul, Nov14]
ABBREVIATIONS
AGE Anti-Government elements ANP Afghan National Police CNPA Counter Narcotics Police of Afghanistan GLE Governor-led eradication ICMP Illicit Crop Monitoring Programme (UNODC) ISAF International Security Assistance Force MCN Ministry of Counter-Narcotics UNODC United Nations Office on Drugs and Crime
ANNEX I: OPIUM POPPY CULTIVATION PER PROVINCE, 2002-2013 (HECTARES)
PROVINCE 2002 2003 2004 2005 2006 2007 2008 2009 2010 2011 2012 2013 2014 Change 2013-2014 (ha) Change 2013-2014 (%) Badakhshan 8,250 12,756 15,607 7,370 13,056 3,642 200 557 1,100 1,705 1,927 2,374 4,204 +1830 +77% Badghis 26 170 614 2,967 3,205 4,219 587 5,411 2,958 1,990 2,363 3,596 5,721 +2125 +59% Baghlan 152 597 2,444 2,563 2,742 671 475 Poppy-free Poppy-free 161 177 141 168 +27 +19% Balkh 217 1,108 2,495 10,837 7,232 - Poppy-free Poppy-free Poppy-free Poppy-free Poppy-free 410 Poppy-free -410 NA Bamyan - 610 803 126 17 - Poppy-free Poppy-free Poppy-free Poppy-free Poppy-free Poppy-free Poppy-free NA NA Day Kundi - 2,445 3,715 2,581 7,044 3,346 2,273 3,002 1,547 1,003 1,058 1,536 587 -949 -62% Farah 500 1,700 2,288 10,240 7,694 14,865 15,010 12,405 14,552 17,499 27,733 24,492 27,513 +3021 +12% Faryab 28 766 3,249 2,665 3,040 2,866 291 Poppy-free Poppy-free Poppy-free Poppy-free 158 211 +53 +33% Ghazni - - 62 9 - - Poppy-free Poppy-free Poppy-free 145 Poppy-free Poppy-free Poppy-free NA NA Ghor 2,200 3,782 4,983 2,689 4,679 1,503 Poppy-free Poppy-free Poppy-free Poppy-free 125 264 493 +229 +87% Hilmand 29,950 15,371 29,353 26,500 69,324 102,770 103,590 69,883 65,045 63,307 75,176 100,693 103,240 +2547 +3% Hirat 50 134 2,531 1,924 2,287 1,525 266 556 360 366 1,080 952 738 -214 -22% Jawzjan 137 888 1,673 1,748 2,024 1,085 Poppy-free Poppy-free Poppy-free Poppy-free Poppy-free Poppy-free Poppy-free NA NA Kabul 58 237 282 - 80 500 310 132 152 220 120 298 233 -65 -22% Kandahar 3,970 3,055 4,959 12,989 12,619 16,615 14,623 19,811 25,835 27,213 24,341 28,335 33,713 +5378 +19% Kapisa 207 326 522 115 282 835 436 Poppy-free Poppy-free 181 290 583 472 -111 -19% Khost - 375 838 2 133 - Poppy-free Poppy-free Poppy-free Poppy-free Poppy-free Poppy-free Poppy-free NA NA Kunar 972 2,025 4,366 1,059 932 446 290 164 154 578 1,279 1,127 754 -373 -33% Kunduz 16 49 224 275 102 - Poppy-free Poppy-free Poppy-free Poppy-free Poppy-free Poppy-free Poppy-free NA NA Laghman 950 1,907 2,756 274 710 561 425 135 234 624 877 1,236 901 -335 -27% Logar - - 24 - - - Poppy-free Poppy-free Poppy-free Poppy-free Poppy-free Poppy-free Poppy-free NA NA Nangarhar 19,780 18,904 28,213 1,093 4,872 18,739 0 294 719 2,700 3,151 15,719 18,227 +2508 +16% Nimroz 300 26 115 1,690 1,955 6,507 6,203 428 2,039 2,493 3,808 16,252 14,584 -1668 -10% Nuristan - 648 764 1,554 1,516 0 Poppy-free Poppy-free Poppy-free Poppy-free Poppy-free Poppy-free Poppy-free NA NA Paktika - - - - - - Poppy-free Poppy-free Poppy-free Poppy-free Poppy-free Poppy-free Poppy-free NA NA Paktya 38 721 1,200 - - - Poppy-free Poppy-free Poppy-free Poppy-free Poppy-free Poppy-free Poppy-free NA NA Panjshir - - - - - - Poppy-free Poppy-free Poppy-free Poppy-free Poppy-free Poppy-free Poppy-free NA NA Parwan - - 1,310 - 124 - Poppy-free Poppy-free Poppy-free Poppy-free Poppy-free Poppy-free Poppy-free NA NA Samangan 100 101 1,151 3,874 1,960 - Poppy-free Poppy-free Poppy-free Poppy-free Poppy-free Poppy-free Poppy-free NA NA Sari Pul 57 1,428 1,974 3,227 2,252 260 Poppy-free Poppy-free Poppy-free Poppy-free Poppy-free Poppy-free 195 NA NA Takhar 788 380 762 1,364 2,178 1,211 Poppy-free Poppy-free Poppy-free Poppy-free Poppy-free Poppy-free Poppy-free NA NA Uruzgan 5,100 4,698 7,365 2,024 9,703 9,204 9,939 9224 7,337 10,620 10,508 9,880 9,277 -603 -6% Wardak - 2,735 1,017 106 - - Poppy-free Poppy-free Poppy-free Poppy-free Poppy-free Poppy-free Poppy-free NA NA Zabul 200 2,541 2,977 2,053 3,210 1,611 2,335 1,144 483 262 424 1,335 2,894 +1559 +117% Total (rounded) 74,000 80,000 131,000 104,000 165,000 193,000 157,000 123,000 123,000 131,000 154,000 209,000 244,00 +15,000 +7%
ANNEX II: INDICATIVE DISTRICT LEVEL ESTIMATES OF OPIUM CULTIVATION, 2002-2014 (HECTARES) |38|
Province District 2001 2002 2003 2004 2005 2006 2007 2008 2009 2010 2011 2012 2013 2014 Badakhshan Arghanj Khwah 54 0 0 0 0 0 0 0 Badakhshan Argo 210 60 204 327 617 610 565 2046 Badakhshan Baharak 645 180 5,544 1,635 710 0 14 2 0 0 43 322 41 Badakhshan Darayim 682 43 145 289 662 898 684 1282 Badakhshan Darwaz-i Payin (mamay) 0 0 0 0 0 0 0 0 0 Badakhshan Darwaz-i- Bala (nesay) 0 0 0 0 0 0 0 0 Badakhshan Faiz abad (Provincial Center) 868 2,370 3,109 2,362 3,111 7,154 83 64 11 10 64 7 48 65 Badakhshan Eshkashim 0 0 0 0 0 0 0 0 0 Badakhshan Jurm 2,897 2,690 4,502 4,818 1,460 2,027 170 6 6 2 43 98 196 85 Badakhshan Khash 999 7 6 4 46 0 0 0 Badakhshan Khwahan 0 0 0 0 0 0 0 5 21 Badakhshan Kishim 2,191 2,840 4,530 2,883 1,076 3,165 0 2 68 204 73 45 141 117 Badakhshan Kohistan 0 0 0 0 0 2 0 11 Badakhshan Kuf Ab 0 0 0 0 0 0 0 0 Badakhshan Kiran wa Munjan 48 0 10 0 0 0 0 0 0 0 Badakhshan Raghistan 0 400 0 0 0 0 19 9 26 Badakhshan Shahri Buzurg 41 170 615 39 0 313 0 2 3 3 36 148 59 Badakhshan Shighnan 0 0 0 0 0 0 0 0 0 Badakhshan Shiki 0 0 0 0 0 0 0 0 Badakhshan Shuhada 0 0 0 0 0 12 86 236 Badakhshan Tagab 93 0 0 0 0 22 36 101 Badakhshan Tashkan 136 0 57 163 145 73 107 92 Badakhshan Wakhan 0 0 0 0 0 0 0 0 0 Badakhshan Wardooj 9 3 14 1 1 0 0 0 Badakhshan Yaftal-i-Sufla 305 0 43 97 50 32 18 12 Badakhshan Yamgan 10 0 0 0 1 0 5 10 Badakhshan Yawan 166 0 0 0 0 30 0 0 Badakhshan Zaybak 0 0 0 0 0 0 0 0 0 Badakhshan Total 6,342 8,250 12,756 15,607 7,369 13,056 3,642 200 557 1,100 1,705 1,927 2,374 4,204 Badghis Ab Kamari 127 0 11 161 16 5 14 24 0 Badghis Ghomach 4 101 944 624 250 328 299 486 1485 1005 2395 1009 Badghis Jawand 226 134 431 66 13 1,090 130 106 187 850 797 Badghis Muqur 220 149 7 102 81 9 61 26 47 Badghis Bala Murghab 22 69 345 1,889 1,034 3,557 81 2,754 2055 284 870 0 3762 Badghis Qadis 391 198 146 906 135 92 152 264 57 Badghis Qala-i-Now (Provincial Center) 43 378 0 0 99 55 9 75 37 49 Badghis Total 0 26 170 614 2,967 3,205 4,219 587 5,411 2,958 1,990 2,363 3,596 5,721 Baghlan Andarab 81 31 301 564 548 947 130 475 0 0 18 5 3 4 Baghlan Baghlan* 120 16 154 374 72 0 0 0 0 0 0 0 Baghlan Baghlan-i-Jadeed 81 248 371 287 0 0 0 0 0 0 0 Baghlan Bruka 198 424 39 31 0 0 0 0 0 4 1 Baghlan Dahana-i- Ghuri 37 200 24 35 0 0 0 0 0 0 0 0 Baghlan Deh Salah 14 0 0 0 113 33 37 60 Baghlan Dushi 89 116 174 68 0 0 0 0 0 0 0 Baghlan Firing Wa Gharu 0 0 0 0 0 0 0 0 Baghlan Gozargah-i-Noor 30 0 0 0 0 0 0 0 Baghlan Kahmard * 527 263 255 0 0 0 0 0 0 0 Baghlan Khinjan 9 21 92 137 23 0 0 0 0 0 0 0 Baghlan Khost Wa Firing 21 0 295 442 56 0 0 0 0 0 0 0 Baghlan Khwajah Hijran (Jalgah) 10 0 0 0 0 0 0 0 Baghlan Nahreen 1 63 276 35 36 0 0 0 0 0 0 0 0 Baghlan Pul-i-Hisar 0 0 0 0 30 139 97 103 Baghlan Pul-i-Khumri (Provincial Center) 1 37 173 224 81 21 0 0 0 0 0 0 0 Baghlan Talah wa Barfak 113 161 102 153 0 0 0 0 0 0 0 0 Baghlan Total 82 152 597 2,444 2,563 2,742 671 475 p-f p-f 161 177 141 168 Balkh Balkh 1 22 332 411 2,786 1,975 0 0 0 0 0 0 0 0 Balkh Chahar Bolak 68 877 2,701 799 0 0 0 0 0 0 0 0 Balkh Chahar Kent 23 25 16 0 0 0 0 0 0 0 0 Balkh Chimtal 153 617 258 1,878 2,074 0 0 0 0 0 0 400 0 Balkh Dowlat abad 3 - 141 202 181 0 0 0 0 0 0 0 0 Balkh Dehdadi 8 35 16 990 307 0 0 0 0 0 0 0 0 Balkh Kaldar (Shahrak-i-Hairatan) 152 395 123 0 0 0 0 0 0 0 0 Balkh Khulm 50 367 0 0 0 0 0 0 0 0 0 Balkh Kishindeh 111 290 189 0 0 0 0 0 0 0 0 Balkh Marmul 3 18 12 0 0 0 0 0 0 0 0 Balkh Mazar-i-Sharif 50 119 78 0 0 0 0 0 0 0 0 Balkh Nahr-i-Shahi 14 30 139 425 833 0 0 0 0 0 0 0 0 Balkh Sholgarah 19 28 256 543 245 0 0 0 0 0 0 0 0 Balkh Shortepa 8 98 401 0 0 0 0 0 0 0 0 Balkh Zari 0 0 0 0 0 0 0 0 Balkh Total 4 217 1,108 2,495 10,837 7,233 p-f p-f p-f p-f p-f p-f 410 p-f Bamyan Bamyan (Provincial Center) 20 93 19 17 0 0 0 0 0 0 0 0 Bamyan Panjab 250 31 0 0 0 0 0 0 0 0 0 Bamyan Saighan 0 0 0 0 0 0 0 0 Bamyan Shebar 36 492 107 0 0 0 0 0 0 0 0 0 Bamyan Waras 191 64 0 0 0 0 0 0 0 0 0 Bamyan Yakawlang 112 123 0 0 0 0 0 0 0 0 0 Bamyan Total 610 803 126 17 p-f p-f p-f p-f p-f p-f p-f p-f Day Kundi Gizab 0 - 776 1,109 1,243 1,054 665 810 722 621 864 727 Part of Uruzgan Day Kundi Ishtarlay 535 214 239 9 9 9 6 8 Day Kundi Kajran 0 - 418 189 1,633 366 357 704 622 153 288 700 320 Day Kundi Khedir 531 289 160 5 8 9 4 6 Day Kundi Kiti 282 168 284 134 151 14 0 0 Day Kundi Mir Amor 512 281 703 19 22 5 12 16 Day Kundi Nili (Provincial Center) 0 214 5 5 9 16 3 0 Day Kundi Sang-i-Takht 2 1 68 10 15 8 30 150 Day Kundi Shahristan 1 - 415 421 2,220 64 85 29 21 13 25 53 87 Day Kundi Total 1 0 1,609 1,719 2,581 5,096 3,346 2,273 3,002 1,547 1,003 1,058 1,536 587 Farah Anar Darah 91 1,828 143 16 239 79 1 9 3 314 104 Farah Bakwah 39 390 1,093 3,458 3,090 3,570 1,936 800 5,822 8844 12651 Farah Bala Buluk 513 336 1,665 1,669 5,312 1,509 2,705 2,586 3,157 3,951 1947 2730 Farah Delaram 3,011 4,404 4,263 8,899 part of Nimroz part of Nimroz Farah Farah (Provincial Center) 87 729 905 1,328 1,013 1,142 51 0 129 4451 4760 Farah Gulistan 1,187 447 163 202 1,132 4,756 1,355 2,661 4,565 3,920 3759 2000 Farah Khaki-Safed 84 432 537 99 609 232 645 1,103 2,220 1186 1726 Farah Lash-i-Juwayn 41 1,568 215 233 109 45 3 6 2 179 27 Farah Pur Chaman 409 293 363 1,549 1,046 96 2,175 3,512 2,164 230 930 Farah PushtRod 554 2,482 1,709 1,314 1,588 46 61 46 505 2521 2214 Farah Qala-i-Kah 189 407 506 337 888 47 11 39 117 914 354 Farah Shib Koh 12 283 352 87 163 77 18 0 0 149 17 Farah Total 0 500 1,700 2,289 10,240 7,694 14,865 15,010 12,405 14,552 17,499 27,733 24,492 27,513 Faryab Almar 239 57 338 213 0 0 0 0 0 0 0 Faryab Andkhoy 15 13 31 0 0 0 0 0 0 0 0 Faryab Bil Chiragh 26 232 24 322 620 102 0 0 0 0 0 0 Faryab Dowlat abad 78 133 27 0 0 0 0 0 0 0 0 Faryab Gurziwan 101 0 0 0 75 0 46 40 Faryab Khani ChaharBagh 205 6 490 0 0 0 0 0 0 0 0 Faryab Khwajah Sabz Poshi Wali 129 451 375 238 0 0 0 0 0 0 0 Faryab Kohistan 640 50 84 152 10 0 0 49 0 65 69 Faryab Maimanah 248 218 66 10 0 0 0 0 0 0 Faryab Pashtun Kot 1 281 429 97 60 249 0 0 0 9 0 1 0 Faryab Qaram Qul 55 138 43 0 0 0 0 0 0 0 0 Faryab Qaisar 150 1,050 579 880 303 168 0 0 13 0 46 102 Faryab Qurghan 0 0 0 0 0 0 0 0 Faryab Shirin Tagab 103 137 1,141 172 924 0 0 0 0 0 0 0 Faryab Total 0 28 766 3,249 2,665 3,040 2,866 291 p-f p-f 146 p-f 158 211 Ghazni Ab Band 0 0 0 0 0 0 0 0 0 Ghazni Ajristan - 62 0 0 0 0 0 0 0 0 0 Ghazni Andar 0 0 0 0 0 0 0 0 0 Ghazni Bahram-e Shahid (Jaghatu) 9 0 0 0 0 0 0 0 0 0 Ghazni Deh Yak 0 0 0 0 0 0 0 0 0 Ghazni Gelan 0 0 0 0 0 0 0 0 0 Ghazni Ghazni (Provincial Center) 0 0 0 0 0 0 0 0 0 Ghazni Giro 0 0 0 0 0 0 0 0 0 Ghazni Jaghatu * 0 0 0 0 0 0 0 0 Ghazni Jaghuri 0 0 0 0 0 0 0 0 0 Ghazni Khwajah Omari 0 0 0 0 0 0 0 0 0 Ghazni Malistan 0 0 0 0 0 0 0 0 0 Ghazni Muqur 0 0 0 0 0 0 0 0 0 Ghazni Nawa 0 0 0 0 0 0 0 0 0 Ghazni Nawur 0 0 0 0 0 0 0 0 0 Ghazni Qara Bagh 0 0 0 0 0 0 0 0 0 Ghazni Rashidan 0 0 0 0 0 0 0 0 0 Ghazni Waghaz 0 0 0 0 0 0 0 0 0 Ghazni Wali Muhammad Shadid Khugyani 0 0 0 0 0 0 0 0 0 Ghazni Zanakhan 0 0 0 0 0 0 0 0 0 Ghazni Total 0 0 0 62 9 0 p-f p-f p-f p-f p-f p-f p-f p-f Ghor Chaghcharan (Provincial Center) 700 1,189 872 1,149 1,233 910 0 0 0 0 71 72 222 Ghor Chahar Sadah 41 0 0 0 0 0 64 95 Ghor Dowlatyar 132 0 0 0 0 5 82 117 Ghor Do Lainah 131 0 0 0 0 16 9 9 Ghor Lal Wa Sarjangal 1,055 718 771 200 0 0 0 0 0 0 9 Ghor Pasaband 700 805 175 48 241 17 0 0 0 0 0 0 0 Ghor Saghar 300 256 340 120 283 18 0 0 0 0 0 0 0 Ghor Shahrak 640 902 18 1,398 0 0 0 0 0 33 37 41 Ghor Taywara 500 808 649 240 608 39 0 0 0 0 0 0 0 Ghor Tulak 84 990 396 145 16 0 0 0 0 0 0 0 Ghor Total 2,200 3,782 4,983 2,689 4,679 1,503 p-f p-f p-f p-f 125 264 493 Hilmand Baghran 1,800 2,309 2,232 2,507 2,890 4,287 4,279 3,343 4,049 6,739 2,788 4,037 4553 Hilmand Dishu - 369 911 851 1,160 688 475 119 481 1,601 4,161 3338 Hilmand Garm Ser 2,020 462 1,922 1,912 6,168 6,523 8,000 5,789 6,333 4,342 1,246 4,527 8394 Hilmand Kajaki 2,640 1,392 1,676 1,639 6,760 5,807 6,240 3,696 3,299 6,435 9,065 10,611 10836 Hilmand Lashkargah (Provincial Center) 1,140 605 1,380 1,332 4,008 6,320 7,857 4,379 2,014 649 1,469 1,828 2562 Hilmand Musa Qala 3,690 2,455 2,404 1,664 6,371 8,854 12,687 8,603 8,415 10,340 7,235 10,586 8320 Hilmand Nad Ali 5,880 870 4,177 2,356 11,652 20,045 20,824 17,063 18,646 5,413 8,038 19,136 22256 Hilmand Marja 0 2,629 2,046 part of Nad Ali
part of Nad Ali
Hilmand Naher-i-Saraj 1,850 1,575 6,486 3,548 10,386 22,769 13,270 9,598 11,517 12,638 22,468 18,701 16984 Hilmand Nowzad 2,650 3,096 1,051 3,737 2,707 6,192 3,863 6,473 2,845 4,694 10,822 11,944 9839 Hilmand Nawa-i-Barukzai 2,730 1,240 3,506 2,552 10,168 6,314 13,978 4,416 1,328 1,610 41 97 319 Hilmand Reg-i-Khan Nishin 1,940 1,893 2,772 3,765 8,484 4,720 2,056 2,292 2,120 2,718 5,912 6781 Hilmand Sangin Qala 2,810 777 1,365 1,184 2,862 5,150 5,532 2,754 2,631 2,941 2,882 3,709 5349 Hilmand Washer 800 590 892 386 735 865 1,653 1,188 1,555 2,275 2,757 5,445 3710 Hilmand Total 0 29,950 15,371 29,353 26,500 69,323 102,770 103,590 69,833 65,045 63,307 75,176 100,693 103,240 Hirat Adraskan 133 9 99 196 22 1 0 0 0 3 10 Hirat Chiisht-i-Sharif 166 42 42 0 0 0 0 0 0 0 0 Hirat Fersi 134 28 110 111 0 0 0 0 0 0 0 0 Hirat Ghoryan 60 238 204 302 0 0 0 0 0 0 0 Hirat Gulran 240 33 32 0 0 0 0 0 0 0 0 Hirat Guzara 88 231 233 0 0 0 0 0 0 0 0 Hirat Hirat 0 16 16 0 0 0 0 0 0 0 0 Hirat Enjil 41 394 382 0 0 0 0 0 0 0 0 Hirat Karrukh 265 124 121 0 0 0 0 0 0 0 0 Hirat Kohsan 4 72 73 146 0 0 0 0 0 0 0 Hirat Kushk (Rabat-i-Sangi) 73 64 50 367 43 0 0 0 0 0 0 Hirat Kusk-i-Kohnah 3 15 15 0 0 0 0 0 0 0 0 Hirat Obe 842 144 131 0 0 0 0 0 0 0 0 Hirat Pashtun Zarghun 154 249 242 0 0 0 0 0 0 0 0 Hirat Shindand 427 54 408 516 201 555 360 366 1,080 949 729 Hirat Zendah Jan 7 128 129 0 0 0 0 0 0 0 0 Hirat total 0 50 134 2,531 1,924 2,288 1,526 266 556 360 366 1,080 952 738 Jawzjan Aqchah 47 171 247 631 30 0 0 0 0 0 0 0 0 Jawzjan Darzab 625 272 16 806 0 0 0 0 0 0 0 Jawzjan Faizabad 24 280 218 112 473 21 0 0 0 0 0 0 0 Jawzjan Khamyab 30 51 40 68 2 0 0 0 0 0 0 0 0 Jawzjan Khanaqa 0 0 0 0 0 0 0 0 Jawzjan Khwajah DuKoh 19 15 271 0 0 0 0 0 0 0 0 Jawzjan Mardyan 4 228 174 21 348 62 0 0 0 0 0 0 0 Jawzjan Mingajik 7 64 101 77 38 0 0 0 0 0 0 0 0 Jawzjan Qarqin 24 58 151 43 17 0 0 0 0 0 0 0 0 Jawzjan Qush Tepah 43 0 0 0 0 0 0 0 Jawzjan Sheberghan (Provincial Center) 1 36 98 508 828 156 0 0 0 0 0 0 0 Jawzjan Total 0 137 888 1,673 1,748 2,023 1,086 p-f p-f p-f p-f p-f p-f p-f Kabul Bagrami 0 0 0 0 0 0 0 0 0 Kabul Chahar Asyab 0 0 0 0 0 0 0 0 0 Kabul DehSabz 0 0 0 0 0 0 0 0 0 Kabul Farzah 0 0 0 0 0 0 0 0 Kabul Gulara 0 0 0 0 0 0 0 0 0 Kabul Estalef 0 0 0 0 0 0 0 0 0 Kabul Kabul 0 0 0 0 0 0 0 0 0 Kabul Kalakan 0 0 0 0 0 0 0 0 0 Kabul Khak-i-Jabar 0 0 0 0 0 0 0 0 0 Kabul Mir Bacha Kot 0 0 0 0 0 0 0 0 0 Kabul Musahi 0 0 0 0 0 0 0 0 0 Kabul Paghman 0 0 0 0 0 0 0 0 0 Kabul Qara Bagh 0 0 0 0 0 0 0 0 0 Kabul Shakar Dara 0 0 0 0 0 0 0 0 0 Kabul Surubi 29 58 237 282 80 500 310 132 152 220 120 298 233 Kabul Total 29 58 237 282 0 80 500 310 132 152 220 120 298 233 Kandahar Arghandab 330 139 261 287 735 1,016 57 158 22 84 114 18 512 Kandahar Arghistan 80 14 651 2,449 784 310 28 43 7 42 90 155 1515 Kandahar Daman 190 357 895 775 183 375 19 119 0 0 0 0 1227 Kandahar Ghorak 380 166 241 233 336 1,445 232 628 1,466 1,165 952 676 269 Kandahar Kandahar (Provinclal Center) 640 293 0 1,367 1,220 590 425 108 262 11 46 0 Kandahar Khakrez 560 312 145 185 217 132 1,224 1,474 1,215 1,190 794 1006 867 Kandahar Maruf - 63 117 150 464 914 182 36 33 31 28 49 275 Kandahar Maiwand 1,090 353 514 1,281 1,362 2,878 3,375 6,524 9,966 10,114 12,690 16382 16228 Kandahar Miya Neshin 322 1,603 158 44 45 30 162 632 Kandahar Nesh 432 3,284 1,717 2,842 2,096 620 1057 405 Kandahar Panjwayee 150 482 864 4,687 4,714 1,564 2,982 4,914 4,780 984 3315 Kandahar Reg 0 327 4 0 0 0 0 0 0 0 Kandahar Shah Wali Kot 260 489 923 2,379 1,593 1,258 560 911 813 615 242 474 1471 Kandahar Shorabak 111 45 19 409 308 4 0 0 0 0 102 0 Kandahar Spin Boldak 290 227 303 218 454 768 541 650 1,359 1,368 121 207 1889 Kandahar Zhire 5,232 2,923 5,405 4,978 5,288 3,867 7017 5108 Kandahar Total 0 3,970 3,055 4,959 12,990 12,618 16,615 14,623 19,811 25,835 27,213 24,341 28,335 33,713 Kapisa AlaSai 77 82 0 367 0 0 0 3 34 33 125 Kapisa Hisah-i-Awal Kohistan 0 0 0 0 0 0 0 0 Kapisa Hisah-i-Duwumi Kohistan 0 0 0 0 0 0 0 0 Kapisa Koh Band 111 33 0 0 0 0 0 9 16 20 46 Kapisa Kohistan* 116 0 0 0 0 0 0 0 0 Kapisa Mahmood-i-Raqi (Provincial Center) 10 0 0 0 0 0 0 0 1 0 Kapisa Nijrab 92 0 0 0 0 0 14 21 20 30 Kapisa Tagab 0 207 326 116 282 468 436 0 0 155 219 508 270 Kapisa Total 0 207 326 522 115 282 835 436 p-f p-f 181 290 582 472 Khost Bak 0 14 0 0 0 0 0 0 0 0 Khost Gurbuz 47 10 0 0 0 0 0 0 0 0 Khost Jaji Maidan 8 16 0 0 0 0 0 0 0 0 Khost Khost Matun (Provincial Center) 0 0 0 0 0 0 0 0 0 0 Khost Manduzay (Ismyel Khel) 125 0 0 0 0 0 0 0 0 0 Khost Musa Khel (Mangal) 86 0 0 0 0 0 0 0 0 0 Khost NadirShah Kot 75 0 0 0 0 0 0 0 0 0 Khost Qalandar 39 0 0 0 0 0 0 0 0 0 Khost Sabari (Yaqubi) 0 0 0 0 0 0 0 0 0 0 Khost Shamul (Dzadran) 0 0 0 0 0 0 0 0 Khost Spera 118 0 5 0 0 0 0 0 0 0 0 Khost Tanay 6 257 458 2 88 0 0 0 0 0 0 0 0 Khost Terayzai (Ali Sher) 0 0 0 0 0 0 0 0 0 0 Khost Total 6 0 375 838 2 133 p-f p-f p-f p-f p-f p-f p-f p-f Kunar Asad Abad (Provincial center 1 140 396 841 270 356 42 252 4 0 0 61 342 290 Kunar Bar Kunar (Asmar) 31 40 163 52 14 10 111 7 9 7 18 62 83 57 Kunar Chapa Dara 535 147 23 0 0 0 12 42 0 0 0 Kunar Dangam 4 49 44 22 9 90 0 9 0 43 30 46 46 Kunar Dara-i-Pech 11 263 310 585 76 183 0 0 1 5 170 298 254 82 Kunar Ghazi Abad 5 0 0 4 13 0 0 0 Kunar Khas Kunar 70 298 41 18 8 1 0 0 0 57 79 21 Kunar Mara warah 345 170 22 33 6 0 84 0 2 4 1 0 Kunar Narang wa Badil 10 100 173 425 55 25 57 0 4 1 1 41 22 4 Kunar Nari 1 - 60 0 19 0 80 15 1 0 0 21 18 7 Kunar Noor Gal 9 70 353 460 58 88 7 0 4 20 20 101 0 79 Kunar Sar Kani 8 100 141 385 50 75 11 6 1 0 0 14 25 0 Kunar Shigal wa Sheltan 5 0 36 73 102 459 212 155 Kunar Sawkai 8 140 83 571 284 111 19 9 4 33 30 124 0 50 Kunar Watapoor 3 0 6 0 137 7 46 45 Kunar Total 74 832 1,942 3,795 775 820 446 290 164 155 578 1,279 1,127 754 Kunduz Ali Abad 3 5 41 0 0 0 0 0 0 0 0 0 Kunduz Dashti-i-Archi 9 102 0 0 0 0 0 0 0 0 Kunduz Chahar Darah 6 15 37 0 0 0 0 0 0 0 0 0 Kunduz Hazrati Imam Sahib 28 0 0 0 0 0 0 0 0 0 Kunduz Khanabad 11 70 0 0 0 0 0 0 0 0 0 Kunduz Kunduz (Provincial Center) 3 9 32 0 0 0 0 0 0 0 0 0 Kunduz Qala-i-Zal 5 8 7 275 0 0 0 0 0 0 0 0 0 Kunduz Total 0 16 49 224 275 102 p-f p-f p-f p-f p-f p-f p-f p-f Laghman Alingar 3 146 354 593 107 259 23 13 1 48 343 303 503 477 Laghman Alisheng 0 104 148 597 69 192 237 370 1 65 124 335 472 278 Laghman Dowlat Shah 12 - 571 233 44 118 124 3 0 31 52 158 142 5 Laghman Mehterlam (Provincial Center) 240 366 580 25 0 0 16 43 90 104 69 119 137 Laghman Qarghayee 0 460 468 753 30 140 177 23 90 0 0 12 0 5 Laghman Total 15 950 1,907 2,756 274 709 561 425 135 234 624 877 1,236 901 Logar Azra 0 0 0 0 0 0 0 0 Logar Baraki Barak 0 0 0 0 0 0 0 0 0 Logar Charkh 0 0 0 0 0 0 0 0 0 Logar Kharwar 0 0 0 0 0 0 0 0 Logar Khoshi 0 0 0 0 0 0 0 0 0 Logar Muhammad Aghah 0 0 0 0 0 0 0 0 0 Logar Pul-i-Alam 0 0 0 0 0 0 0 0 0 Logar Total 0 0 0 0 0 0 p-f p-f p-f p-f p-f p-f p-f p-f Nangarhar Achin 1 940 2,131 1,907 198 1,274 1,797 0 14 10 254 580 2224 3004 Nangarhar Bati Kot 2,390 1,994 4,683 166 550 1,774 0 0 0 0 0 0 0 Nangarhar Behsud 0 0 0 0 0 0 0 0 Nangarhar Chaparhar 2 990 1,169 1,818 20 209 878 0 0 0 12 19 1452 1866 Nangarhar Darah-i- Noor 380 24 472 2 0 322 0 0 0 0 0 0 162 Nangarhar Deh Bala 11 650 927 358 17 68 1,075 0 0 0 0 14 0 0 Nangarhar Dur Baba 40 31 99 5 19 36 0 0 0 0 0 0 0 Nangarhar Goshta 99 150 13 217 10 41 109 0 0 0 0 0 19 95 Nangarhar Hesarak 2 620 1,016 1,392 64 283 295 0 18 5 178 89 0 775 Nangarhar Jalalabad 90 4 1,658 77 0 0 0 0 0 0 0 0 0 Nangarhar Kama 1,120 558 1,898 82 0 0 0 0 0 0 0 0 14 Nangarhar Khugyani 3 2,640 2,986 2,269 117 750 3,253 0 108 131 557 1,481 5746 4755 Nangarhar Kot 0 0 0 0 0 0 993 2040 Nangarhar Kuzkunar 500 102 801 37 151 153 0 0 0 0 0 0 0 Nangarhar Lalpoor 95 250 1 362 17 68 356 0 5 59 185 0 798 712 Nangarhar Mohmand Dara 720 19 1,170 54 221 995 0 0 1 1 0 155 175 Nangarhar Nazyan 150 98 168 8 160 266 0 1 0 0 0 0 0 Nangarhar Pachir wagam 3 420 1,142 1,091 35 143 594 0 0 0 3 418 1672 1588 Nangarhar Rodat 2,760 3,313 3,633 50 0 3,755 0 0 0 0 0 11 946 Nangarhar Sherzad 2 1,470 1,641 1,229 57 430 864 0 148 513 1,510 550 2650 1876 Nangarhar Shinwar 2,060 1,616 1,759 79 504 2,218 0 0 0 0 0 0 0 Nangarhar Surkh Rud 0 1,440 118 1,229 0 0 0 0 0 0 0 0 219 Nangarhar Total 218 19,780 18,904 28,213 1,093 4,871 18,739 0 294 719 2,700 3,151 15,719 18,227 Nimroz Asl-i-Chakhansur 0 0 0 1 0 183 855 98 9 0 Nimroz Chahar Burjak 65 526 1,119 87 4 84 144 181 696 511 250 Nimroz Kang 0 40 0 0 0 10 31 36 0 0 Nimroz Khash Rod 26 50 1164 661 6,421 6,197 326 1,621 1,323 2,536 15,731 14334 Nimroz Zaranj (Provincial Center) 135 0 0 17 81 102 442 1 0 Nimroz Total 0 300 26 115 1,690 1,955 6,507 6,202 428 1,856 2,493 3,808 16,252 14,584 Nuristan Barg-i-Matal 2 535 522 0 0 0 0 0 0 0 0 Nuristan Du Ab 0 0 0 0 0 0 0 0 Nuristan Kamdesh 210 307 269 262 0 0 0 0 0 0 0 0 Nuristan Mandol 0 731 713 0 0 0 0 0 0 0 0 Nuristan Noor Gram 0 0 0 0 0 0 0 0 Nuristan Nuristan Paroon (Provincial Center) 438 185 19 19 0 0 0 0 0 0 0 0 Nuristan Wama 66 0 0 0 0 0 0 0 0 0 Nuristan Waygal 205 0 0 0 0 0 0 0 0 0 Nuristan Total 648 765 1554 1516 p-f p-f p-f p-f p-f p-f p-f p-f Paktika Barmal 0 0 0 0 0 0 0 0 0 Paktika Dilah wa Khwoshamand 0 0 0 0 0 0 0 0 0 Paktika Giyan 0 0 0 0 0 0 0 0 0 Paktika Gomal 0 0 0 0 0 0 0 0 0 Paktika Jani Khel 0 0 0 0 0 0 0 0 Paktika Mata Khan 0 0 0 0 0 0 0 0 0 Paktika Nika 0 0 0 0 0 0 0 0 0 Paktika Omna 0 0 0 0 0 0 0 0 0 Paktika Sar Rowza 0 0 0 0 0 0 0 0 0 Paktika Sharan (Provincial Center) 0 0 0 0 0 0 0 0 0 Paktika Surubi 0 0 0 0 0 0 0 0 0 Paktika Turwo 0 0 0 0 0 0 0 0 Paktika Urgun 0 0 0 0 0 0 0 0 0 Paktika Wazahkhwah 0 0 0 0 0 0 0 0 0 Paktika Wor Mamay 0 0 0 0 0 0 0 0 0 Paktika Yahya Khel 0 0 0 0 0 0 0 0 Paktika Yosuf Khel 0 0 0 0 0 0 0 0 Paktika Zarghun Shahr 0 0 0 0 0 0 0 0 0 Paktika Ziruk 0 0 0 0 0 0 0 0 0 Paktika Total 0 0 0 0 0 0 p-f p-f p-f p-f p-f p-f p-f p-f Paktya Azra* 1 38 419 603 0 0 0 0 0 0 0 0 0 Paktya Ahmadabad* 0 0 0 0 0 0 Paktya Samkani 0 - 76 275 0 0 0 0 0 0 0 0 0 Paktya Dand Patan 175 0 0 0 0 0 0 0 0 0 Paktya Gardez (Provincial Center) 0 0 0 0 0 0 0 0 0 Paktya Woza Jadran 0 0 0 0 0 0 0 0 0 0 Paktya Jaji 0 - 185 11 0 0 0 0 0 0 0 0 0 Paktya Jani Khel 18 0 0 0 0 0 0 0 0 0 Paktya Laja Ahmad Khel 0 0 0 0 0 0 Paktya Lija Mangal 0 - 118 0 0 0 0 0 0 0 0 0 0 Paktya Sayyid Karam 0 - 41 0 0 0 0 0 0 0 0 0 0 Paktya Shamul* 0 0 0 0 0 0 0 0 0 Paktya Shwak 0 0 0 0 0 0 0 0 0 0 Paktya Zurmat 0 0 0 0 0 0 0 0 0 0 Paktya Total 1 38 721 1200 0 0 p-f p-f p-f p-f p-f p-f p-f p-f Panjshir Bazarak (Provincial Center) 0 0 0 0 0 0 0 0 Panjshir Darah 0 0 0 0 0 0 0 0 Panjshir Hissa-i-Awal(Khinj) 0 0 0 0 0 0 0 0 0 0 Panjshir Hisa-i-Duwumi 0 0 0 0 0 0 0 0 0 0 Panjshir Panjshir 0 0 0 0 0 0 0 0 0 0 Panjshir Paryan 0 0 0 0 0 0 0 0 Panjshir Rukhah 0 0 0 0 0 0 0 0 Panjshir Shutul 0 0 0 0 0 0 0 0 Panjshir Unaba 0 0 0 0 0 0 0 0 Panjsher Total 0 0 p-f p-f p-f p-f p-f p-f p-f p-f Parwan Bagram 274 0 0 0 0 0 0 0 0 0 Parwan Charikar (Provincial Center) 181 0 0 0 0 0 0 0 0 0 Parwan Syahgird (Ghorband) 141 0 0 0 0 0 0 0 0 0 Parwan Jabalussaraj 21 0 0 0 0 0 0 0 0 0 Parwan Koh-i-Safi 41 124 0 0 0 0 0 0 0 0 Parwan Salang 0 0 0 0 0 0 0 0 0 0 Parwan Sayyid Khel 0 0 0 0 0 0 0 0 Parwan Shaykh Ali 263 0 0 0 0 0 0 0 0 0 Parwan Shinwari 389 0 0 0 0 0 0 0 0 0 Parwan Surkh-i-Parsa 0 0 0 0 0 0 0 0 0 0 Parwan Total 0 0 0 1310 0 124 p-f p-f p-f p-f p-f p-f p-f p-f Samangan Aybak (Provincial Center) 14 27 0 0 0 0 0 0 0 0 0 0 Samangan Darah-i-Soof-i-Bala 614 34 196 1454 1182 0 0 0 0 0 0 0 0 Samangan Darah-i-Suf-i-Payin 0 0 0 0 0 0 0 0 Samangan Fayroz Nakhcheer 0 0 0 0 0 0 Samangan Hazrat-i-Sultan 29 85 280 90 0 0 0 0 0 0 0 0 Samangan Khuram wa Sar Bagh 0 24 238 307 99 0 0 0 0 0 0 0 0 Samangan Roi-Do-Ab 605 1833 589 0 0 0 0 0 0 0 0 Samangan Total 614 100 101 1151 3874 1960 p-f p-f p-f p-f p-f p-f p-f p-f Sari Pul Balkhab 453 204 95 188 0 0 0 0 0 0 0 0 Sari Pul Gosfandi 0 0 0 0 0 0 0 0 Sari Pul Kohistanat 471 1424 377 0 0 0 0 0 0 0 0 Sari Pul Sangcharak 687 441 1122 16 0 0 0 0 0 0 0 Sari Pul Sari Pul (Provincial Center) 595 476 959 415 203 0 0 0 0 0 0 0 Sari Pul Sayyad 23 52 25 41 0 0 0 0 0 0 195 Sari Pul Sozma Qala 0 57 380 113 256 124 0 0 0 0 0 0 0 0 Sari Pul Total 0 57 1428 1974 3227 2251 260 p-f p-f p-f p-f p-f p-f 195 Takhar Baharak 0 0 0 0 0 0 0 0 Takhar Bangi 0 20 13 0 79 0 0 0 0 0 0 0 Takhar Chahab 19 4 27 70 0 0 0 0 0 0 0 0 Takhar Chal 20 30 15 9 0 0 0 0 0 0 0 Takhar Darqad 15 0 0 0 0 0 0 0 0 0 Takhar DashtiQala 0 0 0 0 0 0 0 0 Takhar Fashkar 26 43 27 43 118 32 0 0 0 0 0 22 0 Takhar Hazar Sumuch 32 0 0 0 0 0 0 0 Takhar Eshkamish 19 77 40 2 47 0 0 0 0 0 0 0 Takhar Kalafgan 27 77 69 609 318 0 0 0 0 0 21 0 Takhar Khwaja Bahawuddin 0 0 0 0 0 0 0 0 Takhar Khwaja Ghar 32 26 35 109 0 0 0 0 0 0 0 0 0 Takhar Namak Ab 0 0 0 0 0 0 0 0 0 Takhar Rustaq 24 34 194 1,321 816 118 0 0 0 0 0 25 0 Takhar Taloqan (Provincial Center) 16 14 115 77 577 0 0 0 0 0 2 0 Takhar Warsaj 10 14 66 46 0 0 0 0 0 0 0 0 Takhar Yangi Qala 20 71 131 317 0 0 0 0 0 0 0 0 Takhar Total 211 788 380 762 1,364 2,179 1,211 p-f p-f p-f p-f p-f p-f p-f Uruzgan Chorah 0 1,330 975 1,402 259 2,024 71 316 306 221 301 349 611 502 Uruzgan Dihrawud 0 1,340 1,282 2,523 209 1,704 3,538 2,849 2,038 145 3,438 4,375 3,321 2214 Uruzgan Khas Uruzgan 0 - 580 358 338 886 173 304 407 230 384 38 123 1074 Uruzgan Nesh* 0 490 59 426 352 614 0 0 0 0 0 0 Uruzgan Shahidi Hasas 0 1,190 1,333 782 646 1,127 3,109 4,403 2,445 3,635 3,601 3,617 3,888 2296 Uruzgan Tirin Kot (Provincial Center) 0 750 469 1,874 221 3,348 2,312 2,067 4,028 3,106 2,895 2,129 1,936 3042 Uruzgan Gizab 148 Uruzgan Total 0 5,100 4,698 7,365 2,025 9,703 9,203 9,939 9,224 7,337 10,620 10,508 9,880 9,277 Wardak Chak-i-Wardak 211 284 0 0 0 0 0 0 0 0 0 Wardak Daimirdad 0 90 106 0 0 0 0 0 0 0 0 0 Wardak Hisah-i-Awal Behsud 22 0 0 0 0 0 0 0 0 0 0 Wardak Jaghatu 0 0 0 0 0 0 Wardak Jalrez 531 78 0 0 0 0 0 0 0 0 Wardak Markaz-i- Behs ud 472 0 0 0 0 0 0 0 0 0 Wardak Maidan Shahr (Provincial Center) 527 102 0 0 0 0 0 0 0 0 Wardak Nerkh 780 215 0 0 0 0 0 0 0 0 Wardak Sayyidabad 192 248 0 0 0 0 0 0 0 0 Wardak Total 2,735 1,017 106 0 p-f p-f p-f p-f p-f p-f p-f Zabul Arghandab 0 302 526 205 346 79 55 103 91 47 79 32 256 Zabul Atghar 188 32 86 36 16 3 2 16 1 5 12 12 Zabul Daychopan 0 646 431 1,016 742 389 422 147 122 26 25 259 178 Zabul Kakar Kak-e Afghan 104 110 219 44 40 38 50 403 Zabul Mizan 0 309 251 56 123 129 289 309 140 74 155 858 544 Zabul Naw Bahar 63 44 33 4 2 12 0 0 Zabul Qalat (Provincial Center) 0 689 317 188 657 78 310 19 20 56 10 28 146 Zabul Shah Joi 0 178 679 240 538 320 237 175 20 11 69 96 146 Zabul Shemel Zayi 65 44 16 35 159 153 46 15 1 5 0 41 Zabul Shinkai 164 287 102 228 139 105 87 0 0 0 0 0 Zabul Tarnak wa Jaldak 1 410 145 506 136 608 5 10 5 26 0 1168 Zabul Total 1 200 2,541 2,977 2,053 3,211 1,611 2,335 1,144 482 262 424 1,335 2,894 TOTAL 7,598 73,905 79,563 126,328 103,635 162,910 192,981 157,252 123,095 122,332 131,065 154,436 209,450 224,337 Rounded Total 8,000 74,000 80,000 131,000 104,000 165,000 193,000 157,000 123,000 122,000 131,000 154,000 209,000 224,000 p-f: poppy-free according to the definition of the respective year. This concept was introduced in 2007. In 2007, provinces with no poppy were considered poppy-free; since 2008, provinces with less than 100 hectares of poppy have been considered poppy-free.
ANNEX III: ERADICATION FIGURES, BY DISTRICT (2014)
Province DISTRICT Eradication verified (ha) No. of fields eradication reported No. of villages eradication reported Daykundi Kajran 6 65 4 Daykundi Total 6 65 4 Hilmand Garmser 211 182 17 Khanashin 48 84 12 Lashkargah 193 441 19 Marjah 75 134 14 Musaqalah 60 127 9 Nad-e-Ali 99 311 18 Nahr-e-Saraj 57 89 10 Nawa-e-Barakzaiy 13 24 2 Nawzad 7 21 2 Sangin 25 38 6 Hilmand Total 787 1,451 109 Kandahar Maywand 68 58 8 Kandahar Total 68 58 8 Kapisa Tagab 26 311 13 Kapisa Total 26 311 13 Kunar Chawkay 1 4 1 Ghaziabad 2 15 1 Narang 6 21 2 Nurgal 7 49 6 Sarkani 18 34 2 Shigal Wa sheltan 24 52 2 Watapur 17 34 3 Kunar Total 75 209 17 Laghman Dawlatshah 1 25 1 Laghman Total 1 25 1 Nangarhar Achin 23 145 11 Nazyan 11 39 4 Shinwar 0 7 2 Nangarhar Total 34 191 17 uruzgan Chora 5 25 2 Tirinkot 158 552 22 Uruzgan Total 163 577 24 Zabul Mizan 9 11 3 Shar-e-safa 3 9 3 Zabul Toal 12 20 6 Badakhshan Argo 680 3116 112 Darayem 171 819 48 Jorm 9 128 10 Keshem 126 549 22 Khash 64 774 12 Teshkan 350 1344 33 yaftal 11 11 1 Badakhshan Total 1,411 6,741 238 Baghlan Burka 3 20 1 Pul-e-Hesar 1 4 3 Baghlan Total 3 24 4 Balkh Chemtal 35 176 5 Balkh Total 35 176 5 Faryab Garziwan 10 123 12 Faryab Total 10 123 12 Ghor Chaghcharan 7 57 10 Dawlatyar 1 6 1 Ghor Total 8 63 11 Kunuz Kunduz 1 12 2 Qala-e-Zal 7 35 2 Kunduz Total 9 47 4 Sar-e-Pul Sayad 43 135 6 Sar-e-Pul Total 43 135 6 Takhar Rostaq 1 5 1 Takhar Total 1 5 1 Grand Total 2,692 10,221 480
Notes:
1. Numbers in brackets indicate the upper and lower bounds of the estimation range. [Back]
2. Poppy-free provinces are those estimated to contain less than 100 hectares of opium cultivation. [Back]
3. Provinces estimated to contain more than 100 hectares of opium cultivation. [Back]
4. Refers to oven-dry opium. [Back]
5. Including Gizab district, a district formally part of Day Kundi, but under the administration of the Governor of Uruzgan province. [Back]
6. Without Gizab district. [Back]
7. "Potential production" is a hypothetical concept and not an estimate of actual opium or morphine/heroin production. For more information, see UNODC World Drug Report 2011, p. 265. [Back]
8. Published in UNODC Guidelines for yield assessment of opium gum and coca leaf from brief field visits, UN New York, 2001, ST/NAR/33. [Back]
9. Yield estimates in this report are based on the concept of potential yield, i.e., the amount opium farmers can potentially extract from poppy capsules. Depending on local conditions and practices, this may differ from the amount actually harvested. [Back]
10. For a detailed description, see Ministry of Counter Narcotics/UNODC (2005): Afghanistan Opium Survey 2005, November 2005, p. 120 (http://www.unodc.org/unodc/en/crop-monitoring/index.html). [Back]
11. In 2013 and 2014, UNODC/MCN also collected samples. These samples have been dried and stored to be analysed in the CNPA forensic laboratory when it becomes operational. [Back]
12. UNODC, SCITEC/19, Limited Opium Yield Assessment Surveys, December 2003. [Back]
13. Analysis of the raw data used in B. Remberg, A.F. Sterrantino, R. Artner, C. Janitsch, L. Krenn, Science in drug control: the alkaloid content of Afghan opium, Chemistry and Biodiversity, 5 (2008), pp. 1770-1779. [Back]
15. Recent data collected by UNODC/MCN. [Back]
17. Analysis revealed that there are no statistically significant differences between regions in the data collected between 2010 and 2012. Therefore, the data has not been weighted according to production. [Back]
18. For more details on the heroin production process in Afghanistan, please see Bulletin on Narcotics, vol. LVII, Nos. 1 and 2, 2005, pp. 11-31. [Back]
19. Simple average of all observations collected between 2010 and 2012. [Back]
20. The factor of 1.29 is the ratio of the molecular weight of heroin to that of morphine (molecular weight of heroin and morphine are 369.42 and 285.34, respectively). [Back]
21. Bulletin on Narcotics, vol. LVII, Nos. 1 and 2, 2005, pp. 11-31. [Back]
22. In the study, 70 kilograms of raw opium with 8.5% morphine content were converted to 2.9 kilograms of pure heroin hydrochloride, which is equivalent to 2.64 kilograms of pure heroin base - assuming no further losses at this stage. [Back]
23. A DEA study on heroin laboratory efficiency in Colombia estimated an overall laboratory efficiency of 67.2% under local conditions from opium (latex) to heroin HCl. This study is not applicable to Afghanistan, because in Colombia processors use a unique method known as the "ammonia method" (key chemicals are ammonia and ethyl acetate) to extract morphine base from opium latex. [Back]
24. Bulletin on Narcotics, vol. LVII, Nos. 1 and 2, 2005. [Back]
25. Based on results presented in Bulletin on Narcotics, vol. LVII, Nos. 1 and 2, 2005, pp. 11-31. [Back]
26. World Drug Report 2009, page 61. [Back]
27. UNODC, Annual Report Questionnaire (ARQ). [Back]
28. UNODC/Paris Pact Initiative, Paris Pact Report 2014. [Back]
29. CADAP, Ministry of Justice of Kazakhstan. [Back]
30. Reported by national authorities at the CARICC/UNODC regional workshop on 27-28 June 2013, Almaty; see UNODC/Paris Pact Initiative, Paris Pact Report 2014 country fact sheet Kazakhstan. [Back]
31. See World Drug Report 2014. [Back]
32. In 2013, it was estimated that 54% of opium production was converted to heroin of unknown purity. The change in percentage is mainly caused by the update of the conversion ratio of opium to heroin, as the distribution between opium and morphine/heroin seizures remained stable. [Back]
33. Note that more than these 12 provinces turned out to be poppy-free in the satellite survey, because less than 100 hectares of opium cultivation was detected. [Back]
34. See, e.g. Cochran, W. G., Sampling techniques, John Wiley & Sons (2007). [Back]
35. UNODC Guidelines for yield assessment of opium gum and coca leaf from brief field visits, UN New York, 2001, ST/NAR/33. See also UNODC (2003): Limited opium yield assessment surveys. Technical report: Observations and findings. Guidance for future activities. In: Scientific and Technical Notes, SCITEC/19, December 2003. [Back]
36. See MCN/UNODC Afghanistan Opium Survey 201, December 2011, page 95. [Back]
37. Counter Narcotics Police of Afghanistan, Forensic Laboratory/UNODC (2008): Laboratory Information Bulletin 12/2008 (LIB IV/2008). http://www.unodc.org/pdf/scientific/LIB%20IV-2008_Kabul-.pdf. [Back]
38. The survey is designed to produce province level estimates. District estimates are derived by a combination of different approaches. They are indicative only, and suggest a possible distribution of the estimated provincial poppy area among the districts of a province. [Back]
Corruption and organized crime
 | This document has been published on 19Jan16 by the Equipo Nizkor and Derechos Human Rights. In accordance with Title 17 U.S.C. Section 107, this material is distributed without profit to those who have expressed a prior interest in receiving the included information for research and educational purposes. |