| Information |  | |
Derechos | Equipo Nizkor
| ||
| Information | | |
Derechos | Equipo Nizkor
| ||
05Dec14
Southeast Asia Opium Survey 2014
Lao PDR, Myanmar
Back to topContents
FACT SHEET - Southeast Asia opium survey 2014**
Opium poppy cultivation in southeast asia
Opium yield and production
The link between opium cultivation and price
Opium cultivation and povertyPart 3 - Lao People's Democratic Republic
FACT SHEET - LAO PDR OPIUM SURVEY 2014
2.1. Key findings
2.2. Area under opium poppy cultivation
2.3. Cultivation practices and crop calendar
2.4. Opium poppy yield and production
2.5. Opium prices
2.6. Opium poppy users3.1. Introduction
3.2. Sampling frame
3.3. Sample size and sample selection
3.4. Interpretation of satellite imagery
3.5. Area estimation
3.6. Comparability with previous area surveys
3.7. Opium yield and productionFACT SHEET - MYANMAR OPIUM SURVEY
2.1. Key findings
2.2. Opium poppy cultivation
2.3. Yield and potential opium production
2.4. Village survey results
2.5. Opium poppy growing seasons
2.6. Reasons for cultivating opium poppy
2.7. Income from poppy
2.8. Changes in poppy cultivation levels
2.9. Opium price
2.10. Food security and rice deficit
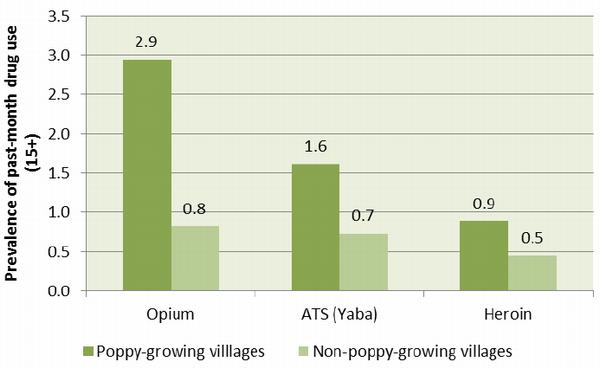
2.11. Drug use in villages in poppy-growing regions
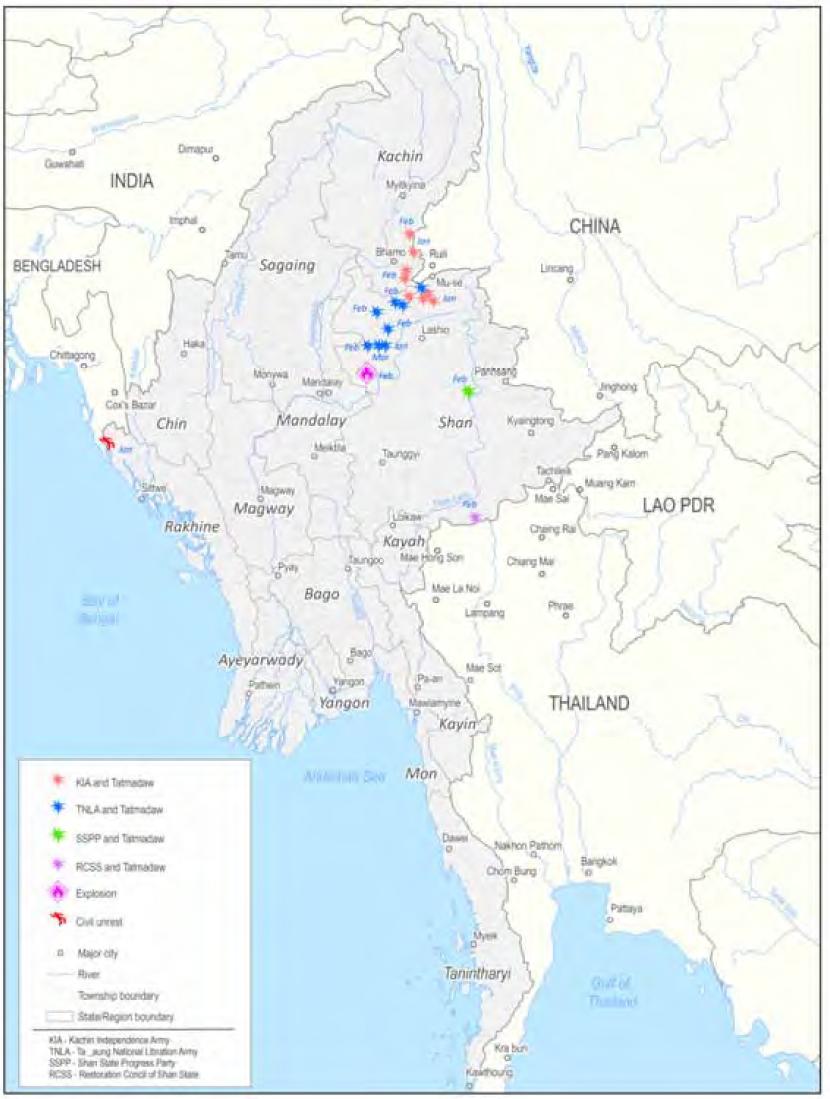
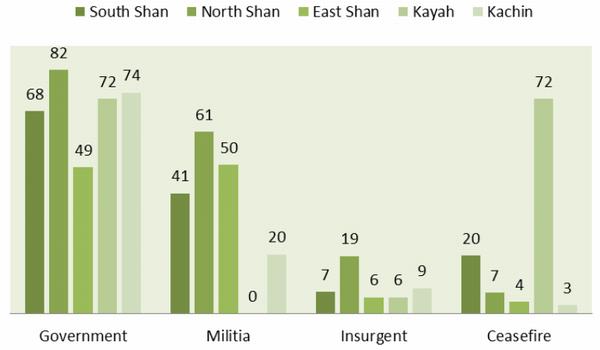
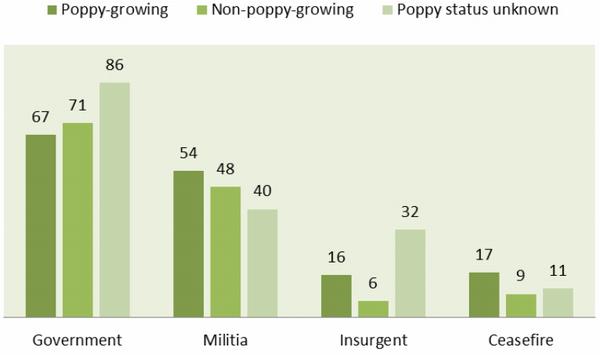
2.12. Conflict and poppy cultivation
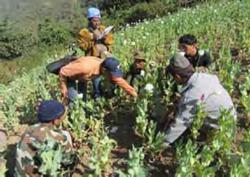
2.13. Reported eradicationAnnex II. Opium poppy cultivation status, by township
Foreword
This year's Southeast Asia Opium Survey shows that despite continued eradication efforts, opium production remains a significant challenge to sustainable development in the region.
Poppy cultivation in the 'Golden Triangle' of Myanmar and Lao PDR rose in 2014 to 63,800ha, compared with 61,200ha in 2013. The estimated total amount of opium produced in the area in 2014 is approximately 762 tons, with the overwhelming majority of cultivation continuing to take place in Myanmar.
The data further emphasize the urgent need to address root causes of cultivation and promote alternative development. Surveys of farmers indicate that, for many, the money made from poppy cultivation is an essential part of family income and support. Villages threatened with food insecurity and poverty need sustainable alternatives, or they will have little choice beyond growing this cash crop out of desperation.
Indications of high levels of consumption of the refined form of opium - heroin - in parts of the region also represent a clear danger to health and development, underscoring the need for evidence-based, health-centred approaches to prevention and treatment.
Efforts to tackle the trafficking of heroin and essential precursor chemicals by criminal groups must also be supported. Most of the heroin trafficked from Myanmar goes to neighbouring countries to meet demand in large population centres, but it is also trafficked to other parts of the region and to global markets. Meanwhile, precursors required to produce heroin are trafficked into Myanmar from neighbouring countries. This two-way trade in and out of the Golden Triangle needs to be halted.
Traffickers also appear to be exploiting well-intended regional connectivity and integration plans, including the ASEAN Economic Community and supporting initiatives of international financial institutions. Efforts need to be made to strengthen the capacity and coordination of border, justice and health authorities to counter this transnational challenge.
A balanced approach addressing opium production through alternative livelihood initiatives, preventing drug use and providing evidence-based treatment, while countering trafficking of heroin and related precursor chemicals, in line with the international drug control conventions and compliance with human rights standards, should be prioritized by states and international partners to safeguard and promote the region's sustainable development.
Yury Fedotov
Executive Director
United Nations Office on Drugs and Crime
The roots of the opium production problem in Southeast Asia go back to the 19th century. The region is home to the "Golden Triangle", an area long associated with opium and heroin production, located where the borders of Myanmar, Lao People's Democratic Republic (Lao PDR) and Thailand converge along the Mekong River. Twenty years ago, the Golden Triangle was the largest heroin-producing area in the world, supplying the region's own demand as well as exporting its surplus to North-east Asia, Europe and the United States of America. In the 1990s and early 2000s, national and regional efforts succeeded in reducing both opium production and trade in the region, though they subsequently increased.
UNODC started annual Opium Surveys in Lao PDR in 2000, and Myanmar in 2002, in order to measure trends in the cultivation of opium poppy and help formulate an effective response to it. The surveys undertaken from 2000 to 2006 underscored the fact that efforts to counter opium production had succeeded in eliminating much of the cultivation in the Golden Triangle, but more recent opium surveys have indicated a resurgence in production over the last few years. |1| As the Southeast Asia region also continues to include high levels of demand, the large quantities of opium produced provide opportunities for transnational crime networks and pose a challenge to the stability and development of the region.
Opiate trafficking in Southeast Asia
According to the Organisation for Economic Cooperation and Development (OECD), average annual economic growth in Southeast Asia is back to its pre-crisis levels of 6.0%. |2| As Southeast Asia is set to establish the ASEAN Community in 2015, |3| the region is well positioned to continue this growth trend. However, economic analysis does not specifically take into account the growing threat to the region posed by transnational organized crime (TOC), which, according to conservative estimates, exceeds a value of US$ 90 billion per year. |4| The production and trafficking of opiates in the region, mainly in the refined form of heroin, constitutes a large proportion of the money flows emanating from these illicit activities.
Although the majority of opium production in Southeast Asia is confined to parts of Myanmar, particularly Shan State, a smaller, yet significant, amount is also produced in Lao PDR. The 2014 Opium Survey reported no significant changes in opium production in Myanmar and Lao PDR from 2013: the total combined area under opium cultivation in the two countries was estimated to be 63,800 hectares in 2014, compared to 61,700 hectares in 2013. |5|
The two countries produced an estimated combined total of 762 tons of opium in 2014, |6| which would most probably have been refined into heroin close to source using the precursor chemical acetic anhydride, which is sourced outside the Golden Triangle. Based on this total, the amount of heroin of unknown purity produced in Myanmar and Lao PDR in 2014 totalled some 76 tons. |7|
The relationship between demand and supply is not entirely linear, but demand for heroin may be linked in part to the resurgence in opium production in Southeast Asia in the past half-decade.
China accounts for approximately 70% of heroin users in Asia, and is the largest single heroin market in the world. |8| The absolute number of heroin users in China increased by approximately half a million between 2007 and 2013, with the number of users estimated to be over 1.3 million. But due to a surge in methamphetamine use over that period, heroin use as a proportion of all registered drug users actually declined. |9| |10| An increase in heroin use was also reported in Lao PDR, Singapore and Thailand in 2014. |11| Heroin remains the primary drug of concern in Malaysia, Myanmar, Singapore and Viet Nam, |12| and continues to account for a substantial number of the problem drug users in Australia, Indonesia, Myanmar and Singapore. |13|
Estimates suggested that there were over 3.3 million opiate users in East and Southeast Asia in 2014 (table 1), |14| a number that may rise as the populations of countries in the region increase and if current trends continue. Moreover, as most countries in the region do not regularly conduct national drug-use surveys, these estimates are limited. In particular, there remains substantial uncertainty about the number of users in China, where estimates are solely derived from data on government-registered users. |15|
Based on the average price of heroin in Southeast Asia, the trade in opiates and heroin in the region was estimated to exceed $16.3 billion per year in 2014. |16| These la rge money flows have severe negative impacts, undermining the rule of law and requiring Governments to allocate resources that could otherwise be used for development and public services. As regional integration includes reducing trade restrictions and the facilitating of transportation across borders, the threat emanating from the trade in opiates may increase further.
Table 1: Estimated number of opiate users and prevalence in Southeast Asia.
Estimated number of opiate users Prevalence (%) Year of estimate China 1,930,000 0.19 2012 Viet Nam 342,806 0.53 2011 Myanmar 293,583 0.80 2010 Malaysia 187,771 0.94 2009 Indonesia 174,652 0.11 2010 Thailand 96,284 0.20 2007 Taiwan, Province of China 34,604 0.20 2005 Philippines 20,880 0.04 2011 Lao People's Democratic Republic 14,863 0.37 2008 Singapore 12,488 0.32 2010 China, Hong Kong SAR 10,674 0.20 2006 China, Macao SAR 4,978 1.12 2003 Cambodia 3,312 0.04 2007 Korea (Republic of) 357 0.00 2004 Estimates for other Member States 210,711 Total estimated number and prevalence of opiate users 3,337,962 0.21 Source: World Drug Report 2014. |17|
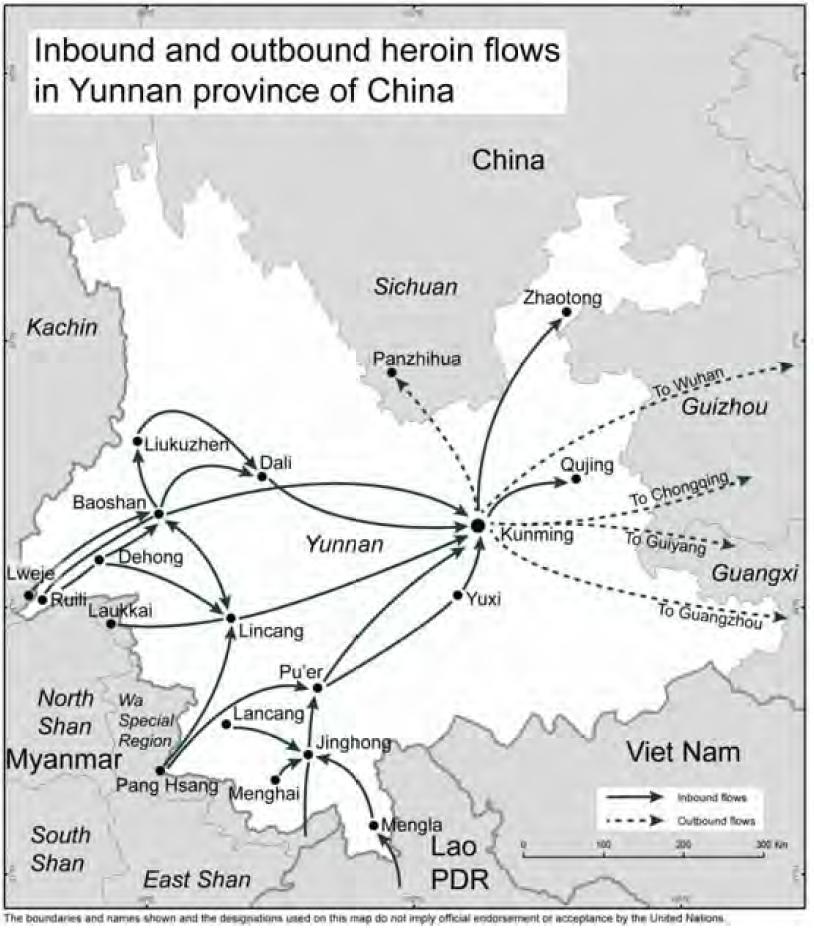
In Southeast Asia, two-thirds of opiates originate in Myanmar and Lao PDR, while the remaining third originates in Afghanistan. As nearly 60% of the estimated opiate users in East and Southeast Asia reside in China, |18| the largest flow of heroin in the region correspondingly crosses the border between Shan State in Myanmar and Yunnan province in China. |19| Historically, heroin has been produced in several parts of Myanmar, but success in reducing cultivation in some places has limited production to Shan State, |20| which hosts a number of insurgent groups.
Heroin and opium are a staple of the economy of Shan State and insurgent finance, and are extremely difficult to dislodge. However, insurgent groups are not always directly responsible for the production of opium and heroin. It is more often the case that insurgent groups provide de facto protection to the actual cultivators and traffickers in return for payment. Some heroin is moved by land across Lao PDR and Thailand, some is trafficked by sea through ports in southern Myanmar, but the majority is trafficked by land, including by individual couriers, directly across the border to Yunnan province in China, |21| where these small loads are consolidated before being trafficked further within China and overseas. |22| The trafficking between Myanmar and China flows in both directions, as the processing of heroin requires precursor chemicals, particularly acetic anhydride. |23|
The flow of heroin from Afghanistan into the region follows a different pattern, however. Xinxiang Uyghur Autonomous region is the main distribution hub for heroin trafficked overland into western China, while Guangzhou, in Guangdong province, is the entry point for air cargo trafficking. There are a large number of smaller flows by land, sea and air from these two major sources to the other countries in Southeast Asia. |24| Malaysia has also become a transhipment hub for opiates from Afghanistan, and Cambodia a transit country for heroin shipped to Australia. |25|
Map 1: Inbound and outbound heroin flows in Yunnan province, China.
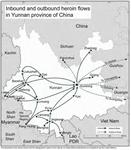
Click to enlarge mapSource: UNODC, Transnational Organized Crime in Southeast Asia and the Pacific: A Threat Assessment (TOCTA) 2013.
As a variety of people are involved in getting heroin from the production site to the consumer, it is difficult to generalize about traffickers. Over 50,000 people are arrested for heroin trafficking in East and Southeast Asia each year. Many of them are small-scale traffickers carrying amounts averaging only 0.11 kilograms. They often come from ethnic groups that straddle international borders and some come from families that have been involved in trafficking for generations. Even though they are usually poor, many of these traffickers are professional providers of clandestine transportation services. |26|
Behind the small-time "ant-traffickers" are the buyers and traders found throughout Southeast Asia, who run the opium market and may deal in a wide range of goods besides opium and heroin. In recent years, traffickers from a range of countries have infiltrated the heroin trade in the region, in part due to the surge in opiates emanating from Afghanistan. The opium trade was traditionally centrally controlled by "triads" based in Hong Kong and Taiwan, but recent research indicates that trafficking groups are increasingly dispersed. |27|
Highly sophisticated international drug syndicates, including South-Asian and African networks, are now also active in Southeast Asia. These syndicates are increasingly dynamic, often recruit nationals from within the region for trafficking operations, operate internationally, and use commercial trucking, shipping and air couriers for trafficking operations.
The Southeast Asia Opium Survey 2014
In many respects, 2014 marks a turning point for Southeast Asia as the region experiences a new phase of economic integration. At the same time, the Millennium Development Goals (MDGs) are being reviewed and Member States are debating the Post-2015 Development Agenda. It is likely that issues of security and the rule of law which are relevant to cross-border challenges and regional integration, including those related to transnational organized crime and criminal justice, as well as alternative development programmes to supplant current poppy cultivation, will be highlighted to some extent.
While the establishment of the ASEAN Community 2015 includes many positive prospects for increased trade, economic growth and cultural exchanges, it also carries the risk of fostering an environment conducive to international criminal networks and activities, and the trafficking of drugs in particular. As such threats transcend the boundaries of individual States, the formulation of a regional response is required. The Southeast Asia Opium Survey 2014 provides an overview of the latest available data on opium production in the Southeast Asia region. It serves as evidence that transnational organized crimes, such as the production and trafficking of drugs, can be a challenge to development and need to be prioritized by both the region itself and the international community.
FACT SHEET - Southeast Asia opium survey 2014**
2013 2014 Change Opium poppy cultivation (hectares) Lao PDR 3,900 ha 6,200 ha Not comparable Myanmar 57,800 ha 57,600 ha -0.3% Thailand* 265 ha Data pending N/A Weighted average dry opium yield Lao PDR 6.0 kg/ha 14.7 kg/ha Not comparable Myanmar 15.0 kg/ha 11.7 kg/ha -22% Thailand* 15.6 kg/ha Data pending N/A Potential opium production Lao PDR 23 tons 92 tons Not comparable Myanmar 870 tons 670 tons -23% Thailand* 4 tons Data pending N/A Opium poppy eradication Lao PDR 397ha Not reported Myanmar 12,288 ha 15,188 ha 24% Thailand* 264 ha Data pending Average price of opium Lao PDR 1,840 US$ /kg 1,855 US$/kg < +1% Myanmar 498 US$/kg 414 US$/kg -17% Thailand* 2,734 US$/kg Data pending N/A Potential value of opium production Lao PDR US$ 42 million US$ 170 million 305% Myanmar US$ 540 million US$ 340 million -37% Thailand* US$ 11 milion Data pending N/A N/A - not applicable.
* The Office of the Narcotics Control Board, Government of Thailand, is acknowledged for providing the figures on Thailand.
**Lao PDR estimates for 2013 and 2014 are not directly comparable due to an update of the yield survey and the addition of areas that have not previously been surveyed.In order to assess the scope of opium poppy cultivation and opium production in Southeast Asia, UNODC has been conducting opium surveys in cooperation with the Government of Lao People's Democratic Republic (Lao PDR) since 1992, and the Government of the Republic of the Union of Myanmar (GOUM) since 2002. Although Thailand has established its own monitoring system, no data on cultivation and production in Thailand were available for 2014. Consequently, this report contains the results of the 2014 UNODC-supported opium poppy cultivation surveys in Lao PDR and Myanmar.
Opium poppy cultivation in Southeast Asia
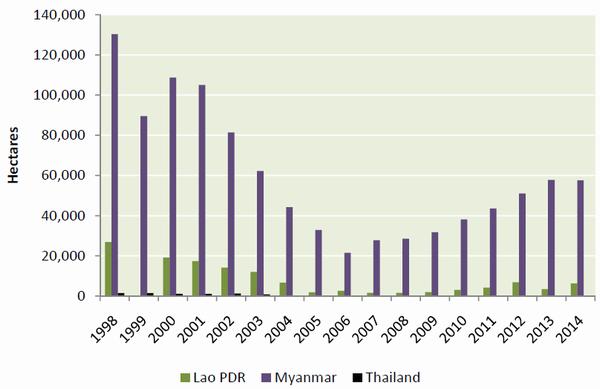
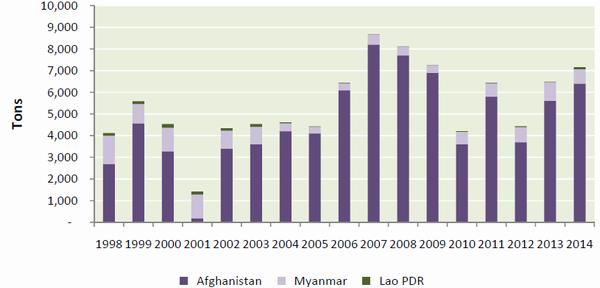
Despite a consistent downward trend in opium poppy cultivation from 1998 to 2006, when Myanmar experienced an 83% reduction and Lao PDR saw the largest relative decline among the three countries, opium poppy cultivation in the region has since increased, albeit at a relatively slow pace. In 2014, a combined total area of over 63,800 hectares of opium poppy cultivation took place in Myanmar and Lao PDR, which led to an estimated 762 tons of opium being produced in the two countries. |28|
Figure 1: Opium poppy cultivation in Southeast Asia, 1998-2014 (Hectares)
Source: Lao PDR/Myanmar: National monitoring systems supported by UNODC; Thailand: Thai Office of the Narcotics Control Board.
Opium poppy cultivation in Myanmar increased from 21,600 hectares in 2006, the year when opium cultivation reached its lowest level, to 57,600 hectares in 2014. In Lao PDR, poppy cultivation increased from 1,500 hectares in 2007 to 6,200 hectares in 2014, but due to differences in the methodology used in 2012, a trend could not be established. Thus, opium poppy cultivation in the region as a whole has nearly tripled since 2006, reaching over 60,000 hectares.
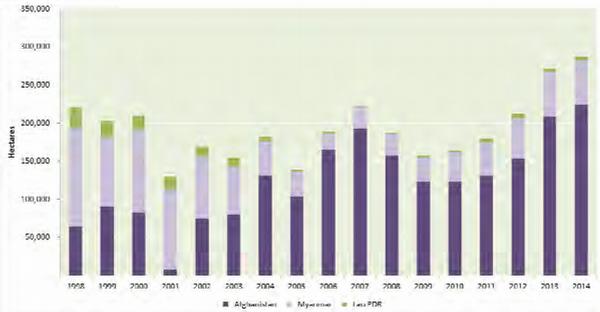
Moreover, largely based on estimates from Afghanistan, global cultivation of opium poppy increased by an estimated 6% from 2013 to 2014, continuing an upward trend in cultivation since 2009.
Figure 2: Opium poppy cultivation in Afghanistan, Myanmar and Lao PDR, 1998-2014 (Hectares)
Source: Afghanistan/Lao PDR/Myanmar: National monitoring systems supported by UNODC.
In Southeast Asia, where opium poppy is mostly cultivated on steep hills with poor soil and no irrigation, opium yields are much lower than in Afghanistan, where opium poppy is often cultivated on good soils and flat, irrigated land. In 2014, opium yields in Lao PDR were estimated at 14.7 kilograms per hectare, more than double the 6.0 kilogram per hectare yield estimate utilized in the survey years 2007-2013. |29| However, that was not the case in Myanmar, where the estimated yield declined from 15 kilograms per hectare in 2013 to 11.7 kilograms per hectare in 2014.
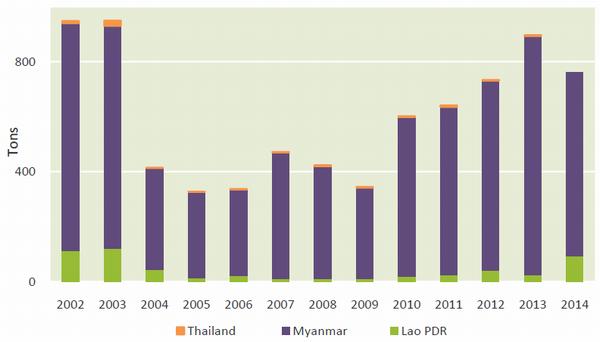
In 2005, Lao PDR and Myanmar produced a combined total of 326 tons of opium, or 7% of that year's global opium production of 4,620 tons. In 2014, the two countries produced 762 tons, a decline of 23% from the previous year, but more than double the amount produced a decade earlier.
Figure 3: Opium production in cultivating areas in Lao PDR, Myanmar and Thailand,* 2002-2014
*No data was available for Thailand in 2014.Due to the absence of yield surveys in Lao PDR, 2007 estimates have been used for the years 2008-2013. The 2014 estimate has been updated with a new yield survey. Source: Lao PDR/Myanmar: National monitoring systems supported by UNODC; Thailand: Thai Office of the Narcotics Control Board.
Due to the decline in yield in Myanmar, the amount of opium produced in Southeast Asia is estimated to have declined. Data for Thailand were not available in 2014 but, based on previous years, opium cultivation and production in the country would not have been large enough to impact the trend observed in the region.
In Afghanistan, however, average opium yield amounted to 28.7 kilograms per hectare in 2014, some 9% more than in 2013 (26.3 kilograms per hectare). The subsequent increase in production in Afghanistan boosted the global opium supply in 2014.
Figure 4: Opium production in major producing countries, 1998-2014 (Tons)
Source: Afghanistan/Lao PDR/Myanmar: National monitoring systems supported by UNODC.
The link between opium cultivation and price
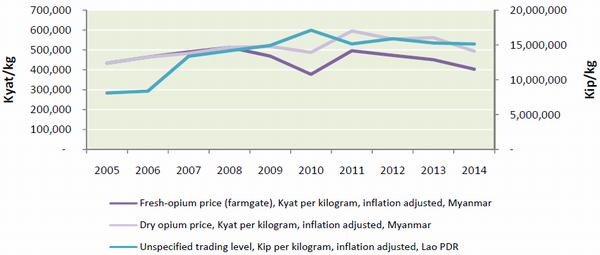
Inflation-adjusted opium prices in local currency remained stable in Myanmar from 2005 to 2014. After an increase between 2005 and 2010, prices in Lao PDR also stabilized. The relative stability of prices and production in Southeast Asia since 2011 is evidence of a market in equilibrium with demand, which may be supplemented by increased production in Afghanistan as the numbers of opiate users in Asia expands with population growth.
Figure 5: Opium prices in cultivating areas in Lao PDR and Myanmar, 2002-2014
Source: Lao PDR: LCDC; Myanmar: National monitoring system supported by UNODC.
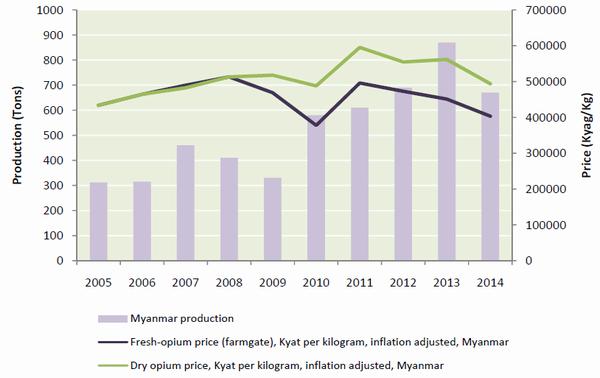
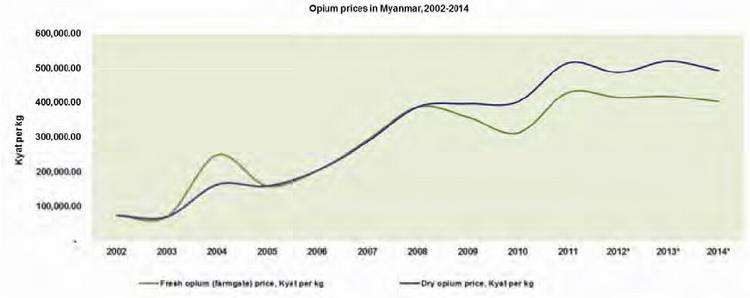
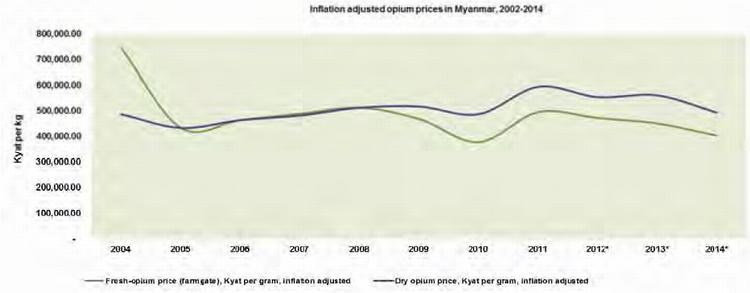
Farm-gate prices in Myanmar in 2014 reflect the price prior to drying and trafficking. The price escalation in the country at the trader level was approximately 20% higher, representing the immediate price hike after opium has left the grower. After 2011, opium prices (farm-gate and dry) appeared to decline slightly as production increased.
Figure 6: Opium production and prices, Myanmar, 2014
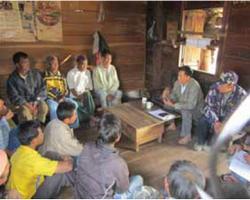
The link between poverty, a lack of alternative livelihood options and the decision to cultivate poppy is clear. The majority of respondents to the 2014 socio-economic survey in Myanmar described the need to provide for basic necessities, such as food, education and housing, as a reason for cultivating opium poppy. The difficulties involved in the cultivation of crops other than opium poppy, and the barriers to transporting goods to market, mean that villagers in remote areas have limited options for earning alternative income.
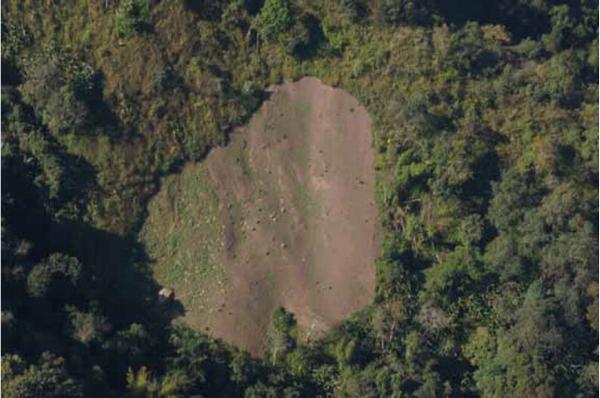
In Lao PDR, no socio-economic survey of poppy-growing villages has been conducted in recent years. However, the data collected during helicopter flights and satellite image analysis indicated that poppy cultivation in 2014 also continued to be a phenomenon linked to villages in peripheral, difficult-to-access locations, far from population and market centres.
Efforts to stimulate alternative development may have the best potential for reducing the incentive to cultivate opium poppy. But as poppy cultivation in both Myanmar and Lao PDR mainly occurs in remote areas, such efforts not only need to provide the same financial benefits as opium cultivation, but also to address transportation issues such as the difficulty of moving licit crops from field to market.
Abbreviations
ICMP Illicit Crop Monitoring Programme LCDC Lao National Commission for Drug Control and Supervision SASS Statistics and Surveys Section (UNODC) UNODC United Nations Office on Drugs and Crime FACT SHEET - LAO PDR OPIUM SURVEY 2014
2013 2014 Change from 2013 Opium poppy cultivation |30| (hectares) 3,900 ha (1,600 to 5,200) 6,200 ha
(3,500 to 9,000)Not comparable |31| Average dry opium yield |32| (kilograms per hectare) 6 kg/ha 14.7 kg/ha Not comparable |33| Potential production of dry opium 23 tons (16 to 52) 92 tons
(51 to 133)Not comparable Average retail/wholesale price of raw opium |34| (US$ per kilogram) US$ 1,840/kg US$ 1,855/kg <+1% Eradication |35| (hectares) 397 ha Not reported N/A This report presents the results of the Lao People's Democratic Republic (Lao PDR) opium survey 2014. The survey has been conducted annually since 1999 by the Lao National Commission for Drug Control and Supervision (LCDC) and UNODC. |36|
In 1999, the Government of Lao PDR and UNODC developed the programme strategy "Balanced approach to opium elimination in Lao People's Democratic Republic." In November 2000, Prime Minister Order Fourteen stipulated concrete government measures against opium poppy cultivation and opium abuse. In 2001, within the context of poverty reduction, the Seventh National Party Congress called for opium production and use to be eliminated by 2005. The National Campaign against Drugs was launched in October 2001 to encourage communities to give up opium production. The Government increased the momentum of the campaign in 2004 and 2005, declaring its success in significantly reducing poppy cultivation and the number of opium users in the country (by 94% and 81%, respectively) in February 2006.
However, subsequent survey results have demonstrated that the total elimination of opium poppy cultivation has not been achieved. Cultivation figures have begun to increase and the continuing presence of opium cultivation in Lao PDR indicates that local opium production is still supplying local users and continues to be a source of livelihood for some communities. Indeed, in the absence of other development initiatives, opium could easily become a livelihood strategy for more communities.
Since 2005, the UNODC Illicit Crop Monitoring Programme (ICMP) has based its opium poppy estimates for the country on observations made via a helicopter survey. Due to the increasing number and size of opium poppy fields, satellite images were added to the survey in 2012 and were used more extensively in 2014.
From 2005 to 2009, the survey covered six provinces of northern Lao where opium poppy cultivation had taken place. From 2010, observations were only focused on Phongsali, Houaphan, Louang Namtha and Xiangkhoang provinces, where most opium was cultivated, but in 2013 the survey was again extended to six provinces, covering Phongsali, Houaphan, Louang Namtha, Louangphrabang, Xiangkhoang and Oudomxai. In 2014, the provinces of Bokeo and Xaignabouri were added following reports of poppy cultivation there.
The 2014 opium poppy survey was implemented by UNODC in coordination with the Ministry of Defence of Lao PDR. The area under cultivation was estimated based on data collected on helicopter flights and from satellite images. Both data sources covered the same sites, which were randomly selected utilizing a probabilistic sample design. The survey was able to take additional imagery for an area with a high density ("hotspot") of poppy fields in Phongsali province, allowing for a census survey (full mapping) in that area. All observations, helicopter photos, GPS data and satellite images were analysed in UNODC offices. Furthermore, a yield survey was conducted for the first time since 2007.
If the country's economic dependence on opium is to be reduced effectively, it is necessary to continue to support the National Drug Control Master Plan and substantially increase support to alternative development programmes in Lao PDR. Moreover, in order to evaluate the impact of alternative development programmes, and to allow for effective policy and programme development, it is necessary to continue monitoring the cultivation of opium.
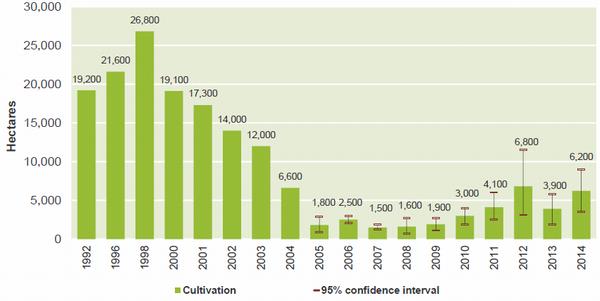
- In 2014, the total area under opium cultivation in Lao PDR was estimated to be 6,200 hectares, with a 95% confidence interval of 3,500 to 9,000 hectares. This result is not comparable with the much lower estimate in 2013 (see Methodology section).
- Following reports of cultivation in Bokeo and Xaignabouri, these two provinces were added to the 2014 survey. The provinces surveyed were thus: Bokeo; Houaphan; Louang Namtha; Louangphrabang; Oudomxai; Phongsali; Xiangkhoang; and Xaignabouri.
- The 2014 survey confirmed the existence of opium poppy cultivation in seven out of eight provinces located in northern Lao PDR. Xaignabouri was the only province where no poppy cultivation was observed, but the number of sampled segments was too low to assure the province's poppy-free status.
- In 2014, a yield survey was conducted for the first time since 2007. Average yield was estimated to be 14.7 kilograms per hectare. Due to the long gap between yield studies, no statement can be made on whether or not the 2014 yield increased in comparison to yields in the preceding years.
- Estimated yields led to an estimated opium poppy production of 92 tons in 2014 (51 tons to 133 tons).
- The reported average retail/wholesale price of raw opium in 2014 was US$ 1,855 per kilogram, a small (<1%) increase from its 2013 price.
2.2. Area under opium poppy cultivation
The total area under opium cultivation in 2014 was estimated to be 6,200 hectares, with a 95% confidence interval of 3,500 to 9,000 hectares.
With the addition of Bokeo and Xaignabour, the 2014 survey took place in eight provinces: two more than in 2013. Opium poppy cultivation was confirmed in seven out of eight provinces located in northern Lao PDR: Phongsali; Houaphan; Louang Namtha; Louangphrabang; Oudomxai; Bokeo; and Xiangkhoang. No poppy was observed in the province of Xaignabouri but that does not mean the province was poppy-free: the sampling approach used does not guarantee poppy-free status as pockets of poppy cultivation may still exist.
The 2014 estimate is not comparable with the much lower 2013 estimate. This is due to the fact that the survey area was extended in 2014 and that the 2013 survey was carried out in different circumstances. In 2013, the helicopter survey was conducted in late February, two weeks after the ideal survey time, at a late stage when poppy fields might already have been harvested and left bare, making it impossible to identify them as poppy fields. While this may have caused an underestimation of the poppy area, it cannot be excluded that 2013 was a "bad" poppy-cultivation year due, for example, to unfavourable weather conditions. On the other hand, the timing of the helicopter survey and satellite images in 2014 was earlier and coincided better with the period when poppy was identifiable.
Figure 7: Estimated area under opium poppy cultivation in Lao PDR (Hectares), 1992-2014
Sources: 1990-1991,1993-1995: US Department of State; 1992,1996-1999: UNODC; since 2000: National Illicit Crop Monitoring System supported by UNODC.
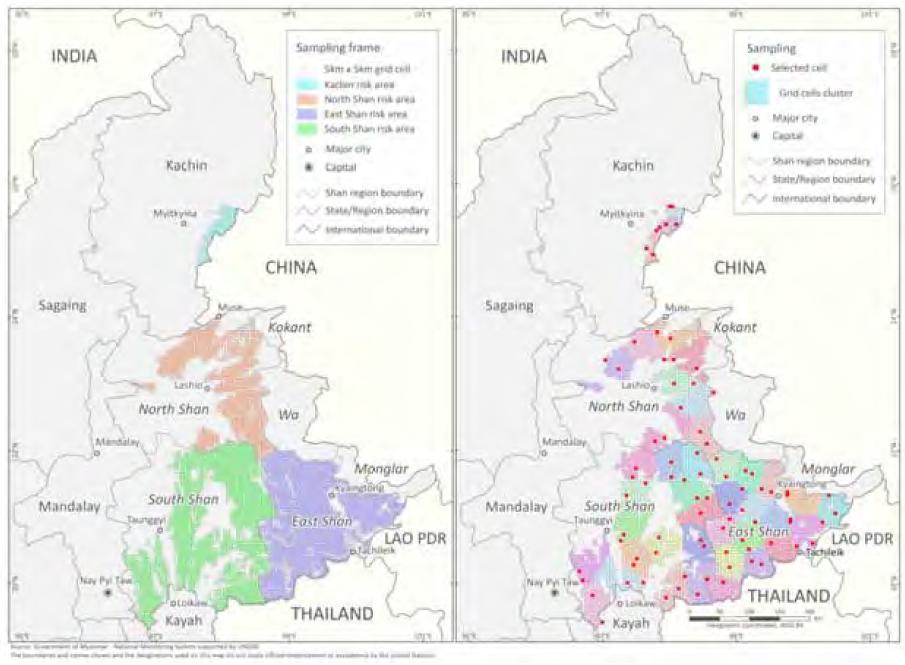
Risk area and survey approach
The risk area describes the geographical area considered in the area survey. It is defined based upon reports from the field on poppy cultivation, as well as results from previous surveys. The sampling frame is the set of all 5 km x 5 km segments that can be chosen randomly for obtaining satellite imagery. For this purpose a 5 km x 5 km regular grid is superimposed on the risk area.
In 2014, the estimated area under opium poppy cultivation in Lao PDR was calculated based on a sampling frame that included potential areas for opium poppy cultivation in Bokeo, Houaphan, Louang Namtha, Louangphrabang, Oudomxai, Phongsali, Xiangkhoang and the northern part of Xaignabouri. Taking into account the results of previous surveys as well as information from the Government and UNODC projects, it can be assumed that opium poppy cultivation outside this risk area was negligible. The results presented here therefore only refer to this risk area and do not include potential poppy cultivation outside its limits.
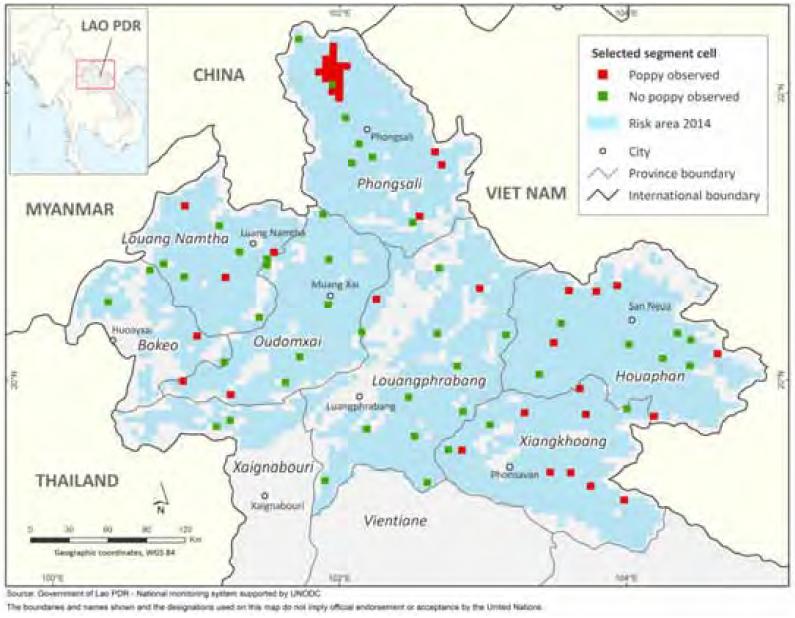
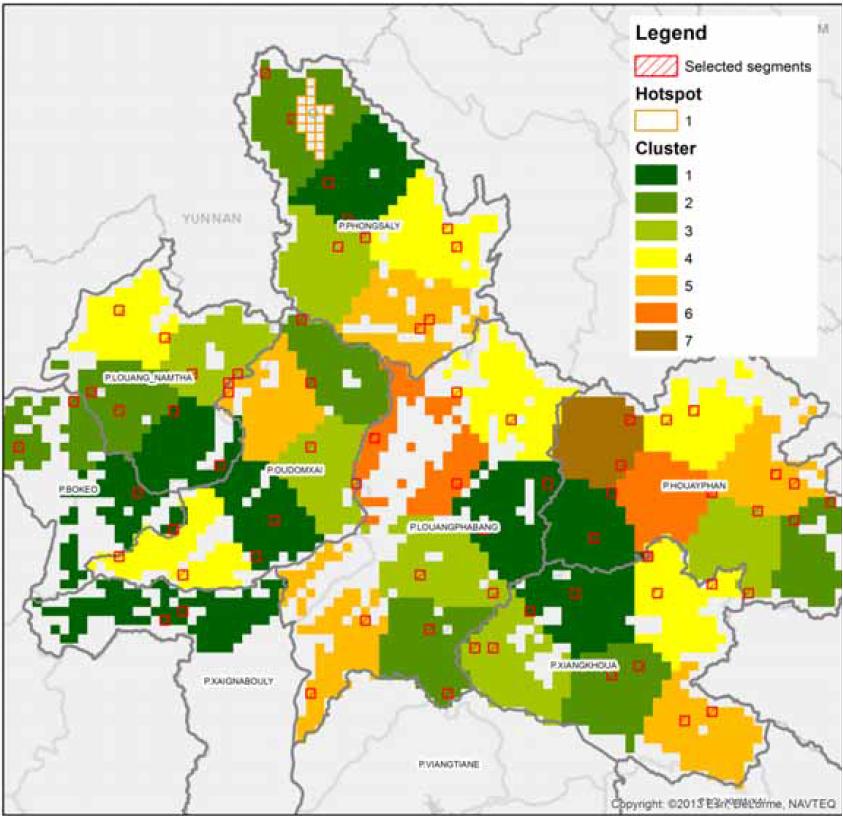
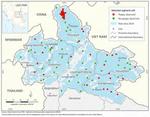
The area under cultivation was estimated/surveyed in two ways. Firstly, a sampling approach was used in which 70 segments each measuring 5 km x 5 km, spread around the risk areas in the eight provinces, were selected. Secondly, due to its high concentration of poppy cultivation, one particular area in Phongsali was analysed separately from the rest of the survey area and was fully covered using a census approach to allow for full mapping and precise estimation of the area under cultivation. This Phongsali "hotspot" was fully covered with 19 satellite images measuring 5 km x 5 km, which were not part of the sampling frame, and the sampled areas in all the poppy-growing provinces were visited by helicopter and analysed with very detailed satellite images. Additional GPS data and photographs were taken as ground truth data for the posterior satellite image interpretations.
Opium poppy fields were found in 24 of the 70 randomly targeted segments, whereas 18 of the 19 segments in the Phongsali hotspot contained opium poppy.
Map 2: Selected segments with satellite images and helicopter visits, northern Lao PDR, 2014
Click to enlarge mapProvincial estimates
The segment sampling method used in 2014 allowed the area under cultivation at the provincial level to be estimated, which in turn enables the Government of Lao PDR to prioritize its policy; for example, on alternative development and law enforcement.
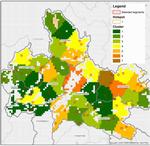
The vast majority (87%) of poppy cultivation in 2014 was concentrated in three provinces: Phongsali; Houaphan; and Louangphrabang. At 2,600 hectares and accounting for 42% of national opium poppy cultivation, the largest share of that was estimated in Phongsali. Houaphan was estimated to have 2,700 hectares (27%) under poppy cultivation and Louangphrabang province 1,100 hectares. Other provinces such as Bokeo, Xiangkhoang and Louang Namtha were each estimated to have less than 1,000 hectares under cultivation, while Oudomxai was estimated to have less than 100.
Table 2: Opium poppy cultivation, by province, Lao PDR, 2014 (Hectares)
Province 2014 Percentage of total opium poppy cultivation Phongsali 2,600 ha (600 to 4,600) 42% Houaphan 1,700 ha (700 to 2,700) 27% Louangphrabang 1,100 ha (10 to 2,200) 18% Bokeo 400 ha (100 to 900) 6% Xiangkhoang 300 ha (100 to 400) 5�% Louang Namtha 100 ha (10 to 200) 2% Oudomxai <100 ha 0.3% Grand total 6,200 ha (3,500 to 9,000) 100% * No estimate was available for Xaignabouri.
2.3. Cultivation practices and crop calendar
As in previous years, multi-staged cropping (planting the same crop at different time intervals in the same field) was also observed in 2014. This method is usually employed to avoid eradication of the entire harvest and also to stagger poppy field labour requirements, which is of particular importance during harvesting, when opium poppy farmers live alone in the poppy fields for at least three months at a time and cannot count on assistance.
Table 3: Crop calendar for opium poppy cultivation in Lao PDR, 2013-2014
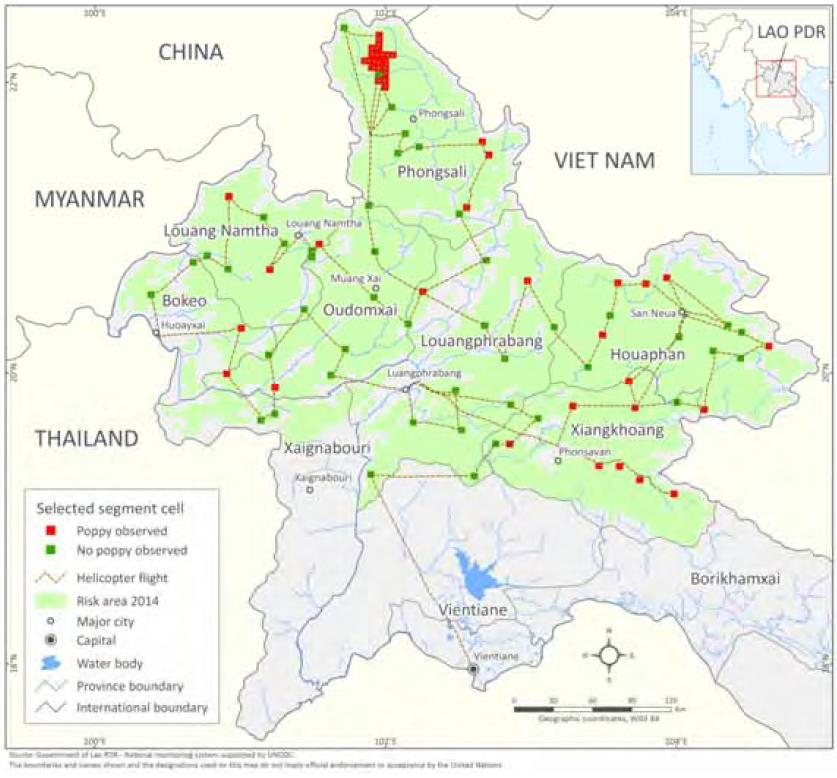
Field preparation Sowing Harvest Average Mid-September -end October Early October -mid November End January -mid-March Map 3: Helicopter survey route, Lao PDR, 2014
Click to enlarge map2.4. Opium poppy yield and production
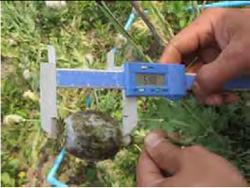
For the first time since 2007, a yield survey was conducted in 2014, which indicated an average |37| yield of 14.7 kilograms per hectare. The survey consisted of 25 fields in 4 provinces (Houaphan, Louang Namtha, Phongsali and Xiangkhoang) being visited by helicopter, but as the terrain and security situation did not allow the selection of a random, representative sample of fields for taking measurements, the fields were selected when the opportunity arose to visit them. The yield survey was conducted following UNODC guidelines for yield assessments of opium gum and coca leaf from brief field visits. |38|
Homogeneous fields of good quality were observed during the survey in all provinces, except Phongsali, which was reportedly affected by low temperatures in early 2014. This affected poppy production as several fields did not reach maturity and seemed to contain stunted plants that would be unable to produce opium latex. To account for this damage in the yield estimates, average productive area per field in Phongsali was estimated a posteriori by using satellite imagery, which revealed that only 75% of the total area of the fields surveyed in Phongsali could be considered to be productive. The estimated yields in Phongsali were therefore reduced by 25%.
Table 4: Opium yield, Lao PDR, 1992-2014 (Kilograms per hectare)
2000 2001 2002 2003 2004 2005 2006 2007 2008-2013 2014 Potential opium yield (kg/ha) 8.7 7.2 8 10 6.5 8 8 6 6* 14.7
(12.0 - 17.4)***Due to the absence yield surveys, 2007 estimates have been used for the years 2008-2013.
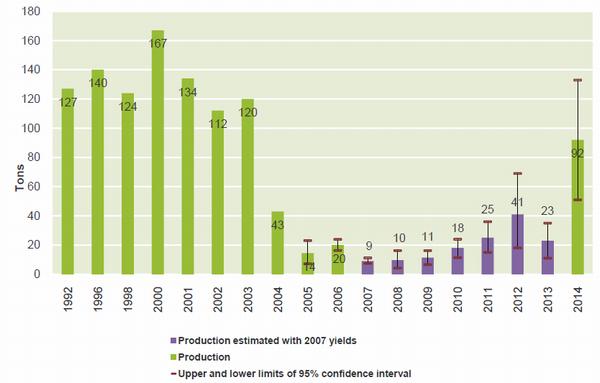
** Confidence intervals are calculated as if simple random sampling has been applied.Figure 8: Potential opium production, Lao PDR, 1992-2014 (Tons)
Confidence intervals reflect uncertainty of area estimates only. Due to the absence of yield surveys, 2007 estimates have been used for the years 2008-2013 (purple). The 2014 estimate has been updated with a new yield survey.
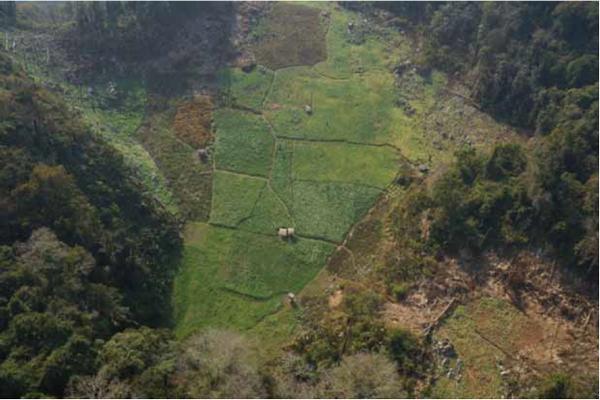
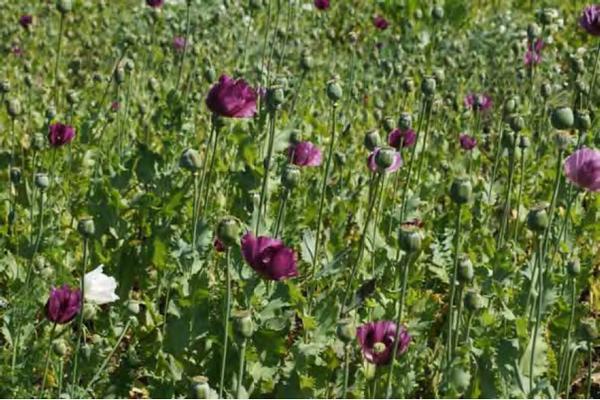
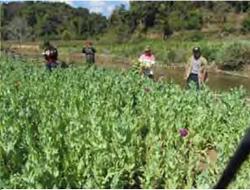
Figure 9: Large and healthy poppy fields, Houaphan province, 2014.
Figure 10: Partially productive field, Phongsali, 2014.
Figure 11: Healthy poppy field, Phongsali, 2014.
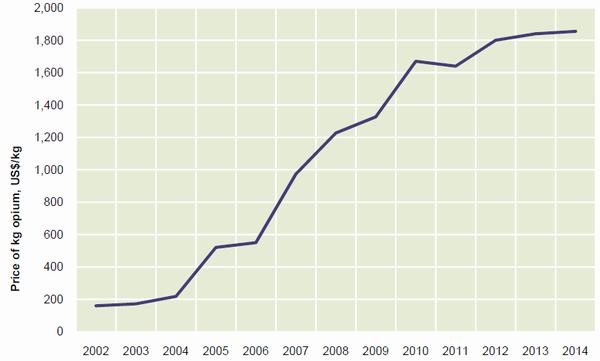
In 2014, the opium price in Lao PDR reached US$ 1,855 per kilogram, |39| which represents an increase of less than 1% from its 2013 price.
Due to the difficulty of accessing areas where opium is grown, it was not possible to collect opium farm-gate prices. However, local authorities continued to collect opium prices at the provincial level, usually during the harvest or soon after it. As in previous years, it was not possible to make a clear distinction between wholesale and retail prices in 2014 because opium is usually consumed by local opium users who purchase it locally.
At US$ 625, the lowest price at the regional level was, as in previous years, in Bolikhamxay province, while, at US$ 3,000, the highest price was again in Xiangkhoang province. According to field reports, it is likely that these differences reflect differences in the local availability of opium, with opium prices in the major poppy-cultivating provinces as follows: Phongsali (US$ 813); Houaphan (US$ 1,325); and Louangphrabang (US$ 1,000).
The high price of opium, and therefore its high-income potential, makes opium cultivation very attractive to farmers, especially if they have no other options or alternative sources of income. The continued provision of relief and development assistance to those most affected is thus fundamental.
Figure 12: Opium prices, Lao PDR, 2002 to 2014 (United States dollars per kilogram)
Source: LCDC.
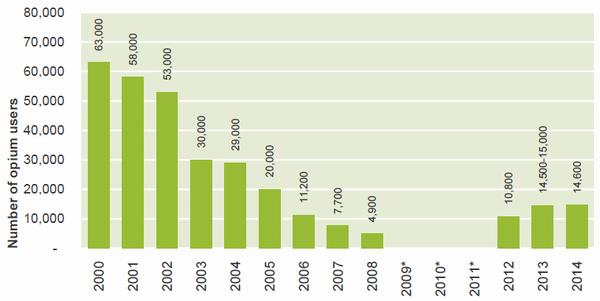
In 2014, Lao National Commission for Drug Control and Supervision reported the number of regular opium users ("opium addicts") to be 14,600 in 11 provinces. |40|
Figure 13: Opium users, |41| Lao PDR, 2014
Based on 11 provinces in 2002-2004 and 2014, 8 provinces in 2005,6 in 2006,10 in 2007, 2008 and 2012. Source: LCDC
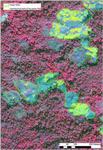
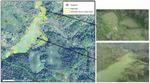
*No data available for 2009-2011.Map 4: Identification of unproductive areas of poppy fields on a very high-resolution satellite image
Click to enlarge mapUnder its global illicit crop-monitoring programme, UNODC has established methodologies for data collection and analysis, with a view to increasing the capacity of the Government of Lao People's Democratic Republic to monitor illicit crops and assist the international community in monitoring the extent, growth and contraction of illicit crop cultivation.
In Lao PDR, the area under opium poppy cultivation is small, not easily accessible and widely distributed. In such circumstances an aerial survey by helicopter is an efficient method for estimating the extent of cultivation. In combination with satellite imagery it gives a very reliable estimate of poppy cultivation.
The survey team visited selected sites (square segments) by helicopter and checked those sites for the existence of opium poppy fields. Detected fields were photographed and the coordinates of the viewpoints were recorded by means of a GPS. In addition, high-precision satellite images taken over the poppy cultivation areas helped measure the size of fields identified as poppy fields during the helicopter flight.
The quality of the data collected from the aerial survey depends to a large extent on the quality of the sampling frame from which the sample is selected. The process to define the sampling frame begins with a selection of provinces and districts where poppy cultivation is thought to occur (risk area). This selection is based on information from local experts and on previous surveys.
In 2014, the sampling frame for the area estimation was extended from six to eight provinces in northern Lao PDR (Bokeo, Houaphan, Louang Namtha, Louangphrabang, Oudomxai, Phongsali, Xiangkhoang and parts of Xaignabouri). Bokeo and Xaignabouri were added in 2014 as there were indications in the former survey and on the ground that poppy cultivation may have increased there. The frame was established by defining the potential land available for opium poppy cultivation in the eight provinces, and a number of sample plots were selected. The estimate for opium poppy cultivation in the 2014 survey pertains only to the area within the sampling frame, even though there may have been some pockets of cultivation in other provinces.
The risk area was then further refined by using information on poppy cultivation practices. In Northern Lao PDR, small opium plots are mainly found dispersed in mountainous areas. Farmers avoid large, sparsely forested plains and densely populated areas, located at lower altitudes. Past surveys have indicated that more than 80% of opium poppy-growing villages are above 700 metres in altitude and on slopes with inclines of over 10%. Because such topographic conditions correspond so closely with actual cultivation patterns and probable cultivation patterns they were used to define the frames themselves. The calculations were performed with the help of a Geographic Information System (GIS). A digital elevation model (with 90-metre pixel size) and its derived slope map were used to delineate areas above 700 metres in altitude and slopes with inclines of over 10%. The sampling frame was further defined by a 3-km buffer area along the country's international borders, which was completely excluded from all survey activities for security reasons.
3.3. Sample size and sample selection
As in previous years, 70 sampling units were selected randomly in a manner that ensured good geographical coverage of the risk area. To increase accuracy, in addition to these 70 sampling units, 19 units were selected to cover a "hotspot" (high-density cultivation area) in Phongsali, covering 475 km2. These 19 units were not selected randomly, but were based on the analysis of opium cultivation in previous years. In total, 89 sampling segments were selected.
The sample size was calculated as a function of the costs associated with the helicopter flying time and the precision of the estimate. |42| This was a compromise as a larger sample size leads to greater accuracy in the estimate. However, financial resources limited the size of the sample.
When selecting the samples, the sampling frame was stratified in geographical clusters to optimize the geographical distribution. To obtain a geographically well distributed sample while being able to estimate the variance (uncertainty) in an unbiased manner, a stratified, probabilistic sampling approach was adopted to select the 70 sampling units. These samples covered all the risk area, apart from the hotspot area. The frame was divided into compact geographical strata of approximately equal area by applying a clustering algorithm ("k-means") in the statistical software R. |43| In each stratum, two sampling locations were selected by simple random sampling, making it possible to calculate the variance in each strata.
Table 5: Number of sampled segments surveyed by helicopter in northern Lao PDR, 2014
Province Grand total BOKEO 4 HOUAPHAN 14 LOUANG NAMTHA 8 LOUANGPHRABANG 12 OUDOMXAI 10 PHONGSALI 10 XAIGNABOULY 2 XIANGKHOANG 10 Grand total 70 Map 5: Sample segments and "hotspot" area surveyed by helicopter in northern Lao PDR, 2014
Click to enlarge map3.4. Interpretation of satellite imagery
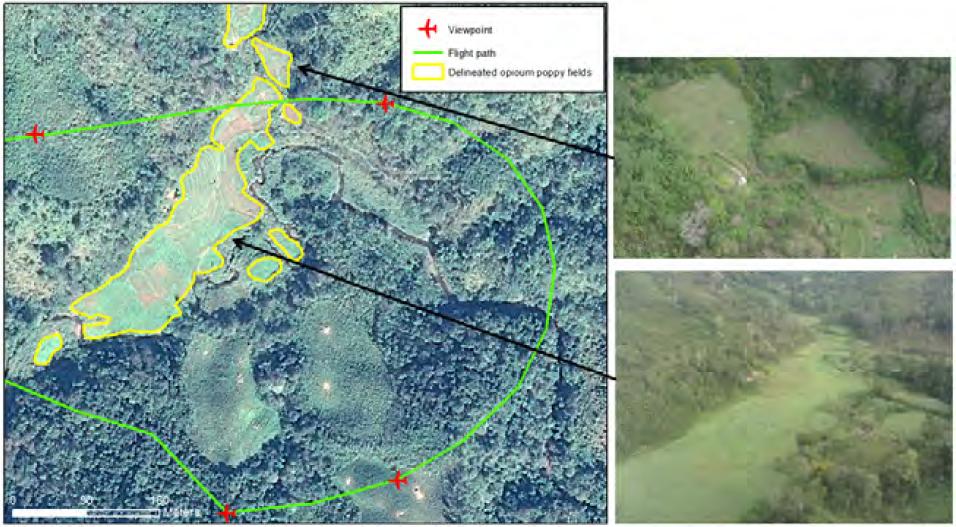
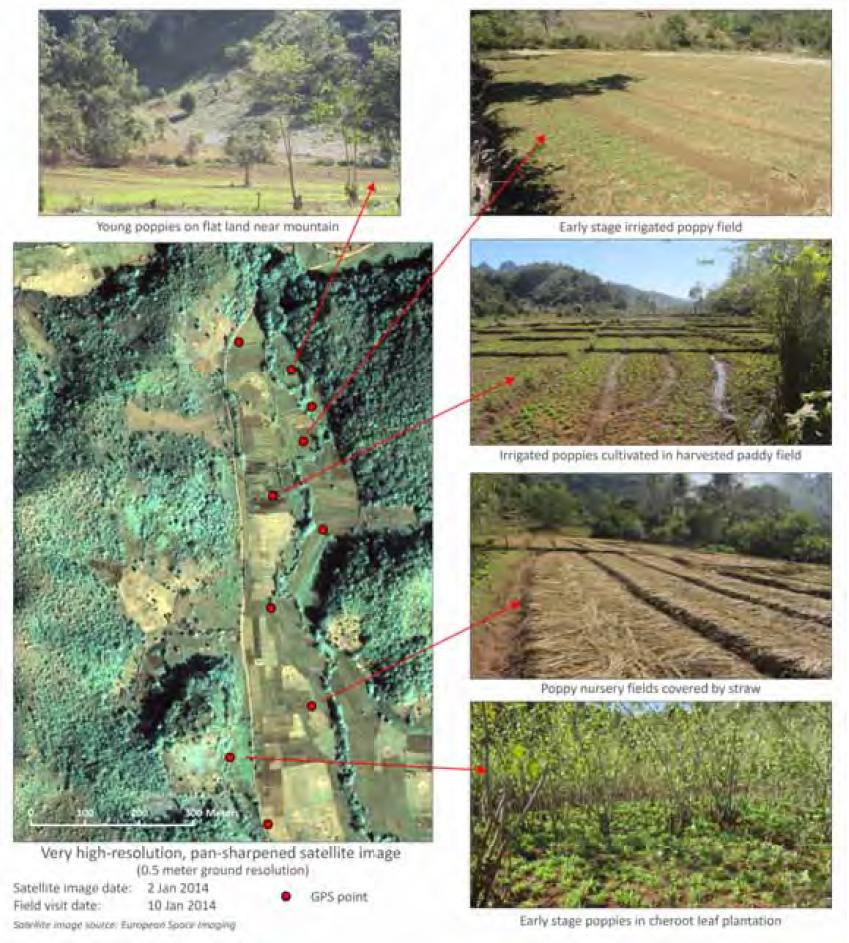
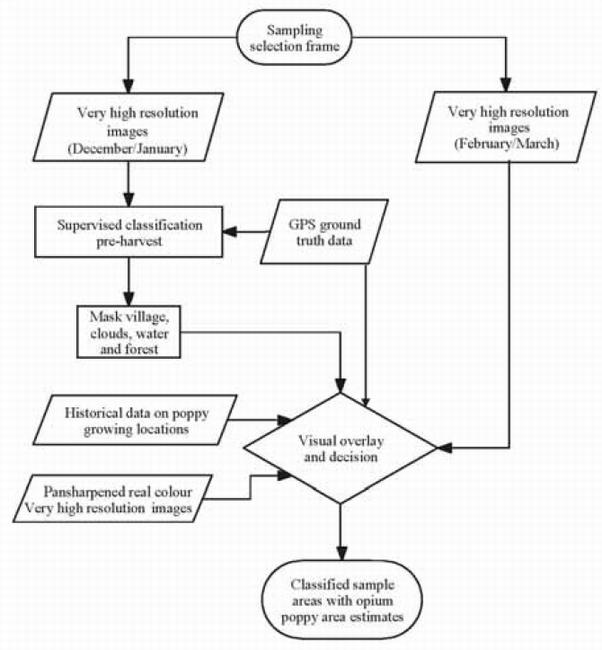
The area estimation was divided into a full coverage estimation of the "hotspot" area in Phongsali province and a sampling approach of the rest of the survey area. Satellite images were acquired for both areas and combined with geographic data collected during the helicopter flights. The satellite images used were very high-resolution images (VHR), from various satellite sensors. Pan-sharpened satellite images from WorldView 2, Geoeye and Ikonos, which have a spatial resolution of 0.5-1 metres, were acquired. The satellites were programmed to take images when the crop would be easiest to identify (normally at the beginning of February), close to the date of the helicopter survey. Opium poppy fields were then identified by visual interpretation of the satellite images and with aerial photos and GPS data collected during the helicopter survey. The recorded coordinates of the viewpoints and flight path were used to locate the fields. Each field was delineated on the satellite imagery with high precision.
The 19 satellite images that covered the hotspot area in Phongsali province were analysed for existing poppy fields and all fields in the hotspot were mapped. The boundaries of the fields identified as poppy fields were digitized and the sum of the individual field areas resulted in the total opium poppy cultivation area in the hotspot.
Map 6: Delineation of opium poppy fields on a satellite image (Pléiades) with the help of aerial photographs
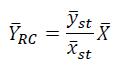
Click to enlarge mapThe sample area estimation of the extent of opium poppy cultivation is a ratio estimate using risk area as an auxiliary variable.
The sample mean was calculated as
where k is the number of stratum,
is the sample mean of poppy in stratum h;
is the sample mean of the risk area in stratum h;
is the number of sampling units in stratum h, and N is the population size.
The combined ratio estimate of the area under poppy cultivation then is given by
where
is the total risk area in the sampling frame.
The final estimate is the sum of the area under opium poppy cultivation found in the "hotspot" and the estimate from the sample survey.
Even though an unbiased estimator of the variance is available for this sampling design, bootstrapping |44| was performed for estimating the confidence intervals for both national and subnational estimates. This was necessary as the heavily skewed distribution of poppy in the samples led to unrealistic confidence intervals when applying the standard methods. Although bootstrapping is considered to be an appropriate choice in such situations, UNDOC undertakes further research if this is the case in all situations.
3.6. Comparability with previous area surveys
The general approach used for the 2014 survey was similar to that used in previous years. However, two major changes were introduced:
The area under consideration was significantly extended: two more provinces were covered and the sampling frame was increased from covering 29,596 km2 to 58,266 km2.
In 2013, for reasons beyond the control of the survey team, the helicopter survey took place in late February, about two weeks after the usual survey time. Due to the late timing of the survey some fields may have been no longer identifiable as poppy fields because they may have already been harvested. Despite these considerations, it cannot be excluded that 2013 was a "bad" poppy-cultivation year, meaning that the cultivated area could have been smaller due, for example, to negative weather conditions. In 2014, the survey took place as planned, which may have allowed the identification of relatively more poppy fields than in 2013.
3.7. Opium yield and production
Data collection
In the yield survey, data on the number of yield capsules per plot and capsule volume are collected. The survey followed the procedure established in the UNODC Guidelines for Yield Assessment. |45|
In 2014, 25 fields in 4 provinces (Houaphan, Louang Namtha, Phongsali and Xiangkhoang) were visited by helicopter. The fields were selected when the opportunity to do so arose, as the terrain and security in the field did not allow the selection of a random, representative sample of fields for taking measurements. This was also the case in previous UNODC yield surveys undertaken in Lao PDR.
It should be noted that "opportunistic" selection can lead to a bias in yield measurements: healthier, more productive fields may have a greater likelihood of being chosen because they are more visible from the air and are often located in flat areas where a helicopter can land.
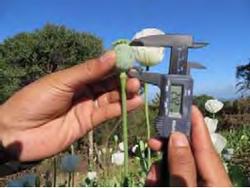
The yield survey was conducted following the UNODC guidelines for yield assessments of opium gum and coca leaf from brief field visits: |46| an imaginary transect was drawn on each surveyed field, along which three one-metre square plots were selected. In each plot, the number of flower buds, flowers, immature capsules and mature capsules that were expected to yield opium were counted, and the diameter and height of 10 to 15 opium-yielding capsules were measured with a calliper. The capsule volume per square metre was calculated with these data and entered into the formula for the yield calculation. Each plot thus provided one yield observation. The simple average of the three plots in a field is the field yield. The simple average of all fields in a region is the regional yield.
The relationship between poppy capsule volume per square metre and dry opium yield is used to estimate opium production. For Lao PDR, it is of linear form: |47|
Y = 1.89 + 0.0412 VC
where
Y = Dry opium gum yield (kg/ha), and
VC = Mature capsule volume (cm3/m2).The range of capsule volumes per square metre used to develop this formula was 0 to 900 cm3/m2.
Homogeneous fields of good quality were observed in all provinces during the survey, except Phongsali, which was reportedly affected by low temperatures in early 2014. This affected poppy production as several fields did not reach maturity and seemed to have stunted plants that were unable to produce opium latex at the end of the harvesting season (late February). As such damage was not fully represented in the yield measurements, average field productivity in Phongsali was estimated a posteriori by using satellite imagery, which revealed that only 75% of the area of fields in Phongsali could be considered to be productive. The average yield for Phongsali was therefore reduced by 25%.
Average opium yield was calculated by taking the weighted average provincial opium yield weighted by the estimated provincial area under opium cultivation.
Table 6: Number of fields visited and number of capsules measured during 2014 yield survey
Province Number of fields visited Number of capsules measured HOUAPHAN 3 89 LOUANG NAMTHA 2 51 PHONGSALI 17 506 XIANGKHOANG 3 90 Grand total 25 736 Estimating opium production
Opium production is calculated by multiplying the national average yield by the estimated national area under cultivation. Since sample sizes are very small for some provinces, no provincial estimates of production are provided.
All opium estimates in this report are expressed in oven-dry opium equivalent; i.e. the opium is assumed to contain 0% moisture. The same figure expressed in air-dry opium, i.e. opium under "normal" conditions as traded, would be higher as such air-dry opium contains some moisture.
Abbreviations
CCDAC Central Committee for Drug Abuse Control GOUM Government of the Republic of the Union on Myanmar ICMP Illicit Crop Monitoring Programme SASS Statistics and Surveys Section (UNODC) SR Special Region UNODC United Nations Office on Drugs and Crime FACT SHEET - MYANMAR OPIUM SURVEY |48|
Year 2013 Year 2014 Change from 2013 Total opium poppy cultivation (hectares) |49| 57,800 ha (45,700 to 69,900) 57,600 ha (41,300 to 87,400) -0.3% Opium poppy cultivation in Shan State 53,300 ha (41,200 to 65,300) 51,400 ha (36,100 to 70,600) -3.6% Average opium yield (kilograms per hectare) 15 11.7 -22% Total potential production of dry opium 870 tons (520 to 870) 670 tons (480 to 920) -23% Total opium poppy eradication (hectares) |50| 12,288 ha 15,188 ha 24% Average farm-gate price of fresh opium in Shan State |51| US$ 498 US$ 414 -17% |52| Total potential wholesale value of opium production |53| US$ 540 (390 to 680) million US $ 340 (240 to 470) million -37% |54| Estimated number of households involved in poppy cultivation |55| 192,000 (152,000 to 192,000) 182,000 (130,000 to 276,000) -5�% Estimated number of households growing poppy |56| 130,000 |57| 135,000
(97,000 to 204,000)4% FACT SHEET - MYANMAR OPIUM SURVEY |58|
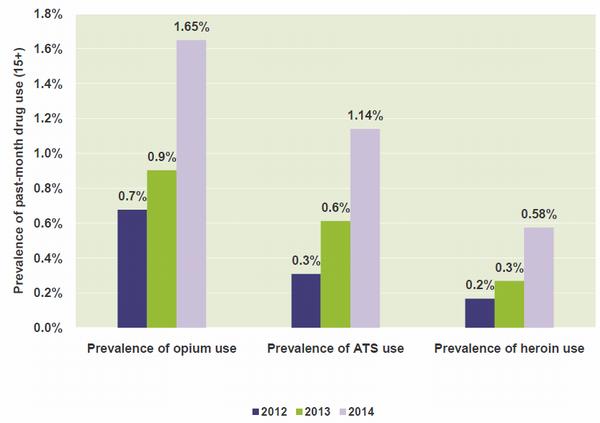
Year 2013 Year 2014 Change from 2013 Average yearly household income in preceding year, Shan State: Non-opium-producing households US$ 2,250 US$ 1,730 -23% Opium-producing households US$ 2,340 US$ 2,040 -13% (Income from opium sales) (US$ 920) (US$ 1,050) 14% Reported drug use in survey area (last-month prevalence of population aged 15 and over): |59| Opium 0.90% 1.65% 83% Heroin 0.27% 0.58% 115% Amphetamine-type stimulants (yaba) |60| 0.61% 1.14% 87% This report presents the results of the twelfth annual opium survey in Myanmar. It was conducted by the Central Committee for Drug Abuse Control (CCDAC) of Myanmar, with the support and participation of UNODC. Since 2001, UNODC has been collecting statistical information on illicit crop cultivation in Myanmar, within the framework of its Illicit Crop Monitoring Programme (ICMP). ICMP works with national Governments to increase their capacity to monitor illicit crops and supports the international community in monitoring the extent and evolution of illicit crops in the context of the plan of action adopted by the United Nations (the 53rd session of the Commission on Narcotic Drugs in March 2009). The survey methodology combines satellite imagery with field and village surveys. In combination, these three survey methods provide the information used to determine the extent of opium poppy cultivation and production, as well as the socio-economic situation of farmers in poppy-growing areas of Myanmar.
In the 1980s, Myanmar was the world's largest producer of illicit opium. Between 1981 and 1987 the country had an average annual opium production of about 700 tons, which continued to increase until 1996 when it reached annual production levels of some 1,600 tons. In 1991, Afghanistan replaced Myanmar as the world's largest producer of opium, primarily due to its higher opium yield per hectare. However, the area under cultivation remained larger in Myanmar than in Afghanistan until 2002.
In 1999, the Government of the Republic of the Union of Myanmar (GOUM) and local authorities in areas affected by opium poppy cultivation developed a 15-year plan to eliminate illicit crop production by the year 2014. Until 2006 there was a considerable decrease in the total area under opium poppy cultivation in Myanmar but illicit opium poppy cultivation has since increased, though it is still well below the levels reached in the 1990s.
This development indicates that the successful reduction of the cultivation and production of opium can only be sustained if alternative livelihoods are available to local communities. Farmers are very vulnerable to losses in income derived from opium, especially those who depend on such an income source for food security. Furthermore, opium cultivation is generally linked to the absence of peace and security, which indicates the need for both political and economic solutions.
Annual opium surveys remain essential for assessing the extent of opium poppy cultivation in Myanmar, as well as changes in cultivation patterns in the country. They are also useful tools for gauging the effectiveness of opium bans and their implications, as well as aiding the understanding of cultivation techniques and alternative livelihoods. Such information is essential for developing effective strategies for sustaining the transition from an illicit economy to a licit economy.
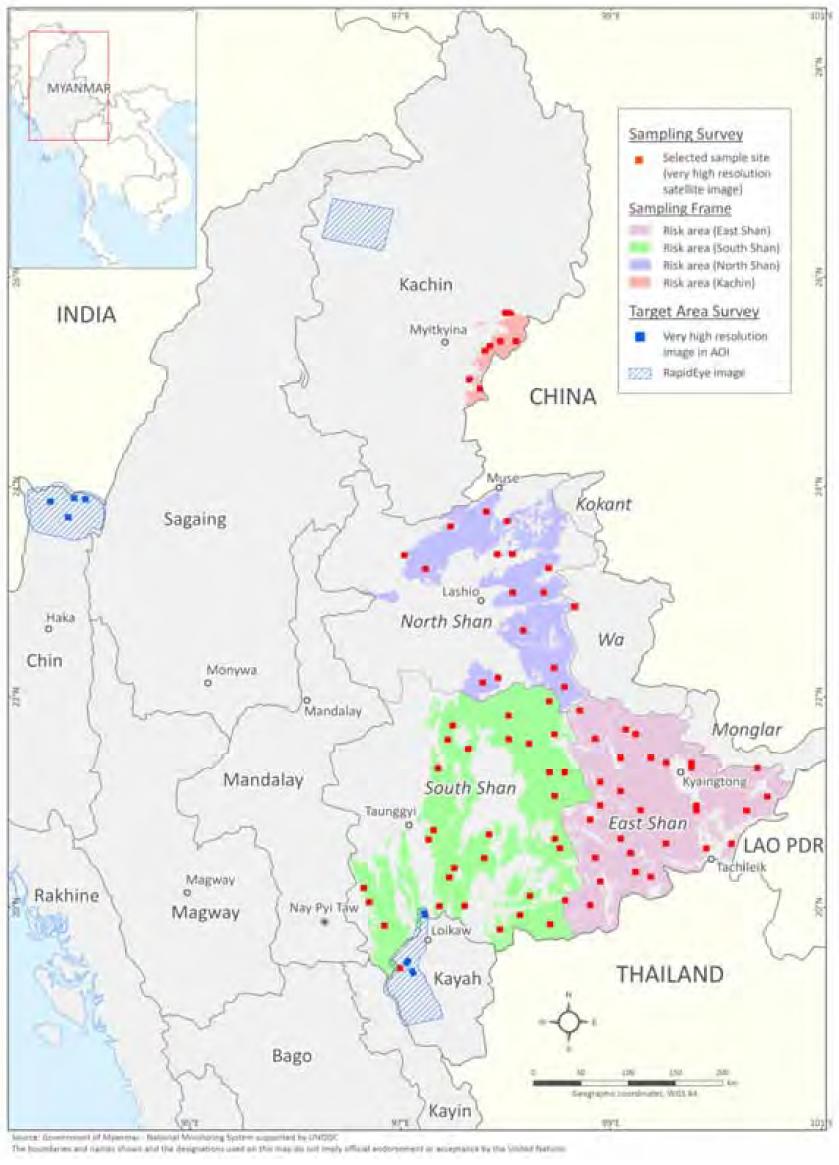
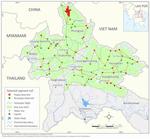
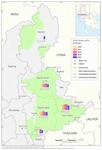
Map 7: Opium poppy cultivation in Myanmar, 2014 |61|
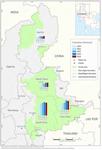
Click to enlarge map
- In 2014, the total area under opium poppy cultivation in Myanmar was 57,600 hectares.
- This figure represents the first year of stabilization in the area under opium poppy cultivation after consecutive year-on-year increases since the low of 21,600 hectares in 2006. The 2014 figure includes 1,100 hectares estimated to be under opium cultivation in Chin, a region not covered in 2013. Moreover, North-western Kayah, bordering South Shan, was sampled once again after an absence of several years.
- Average yield was estimated to be 11.7 kilograms per hectare, a 22% decline from the previous year.
- Estimated yields led to an estimated opium production of 670 tons in 2014, down from 870 tons in 2013.
- The decline in opium production is due to the lower estimated yield of the poppy harvest, though cultivation remained stable.
- The reported average price of opium was 414 US$ per kilogram in 2014, down 17% from the previous year.
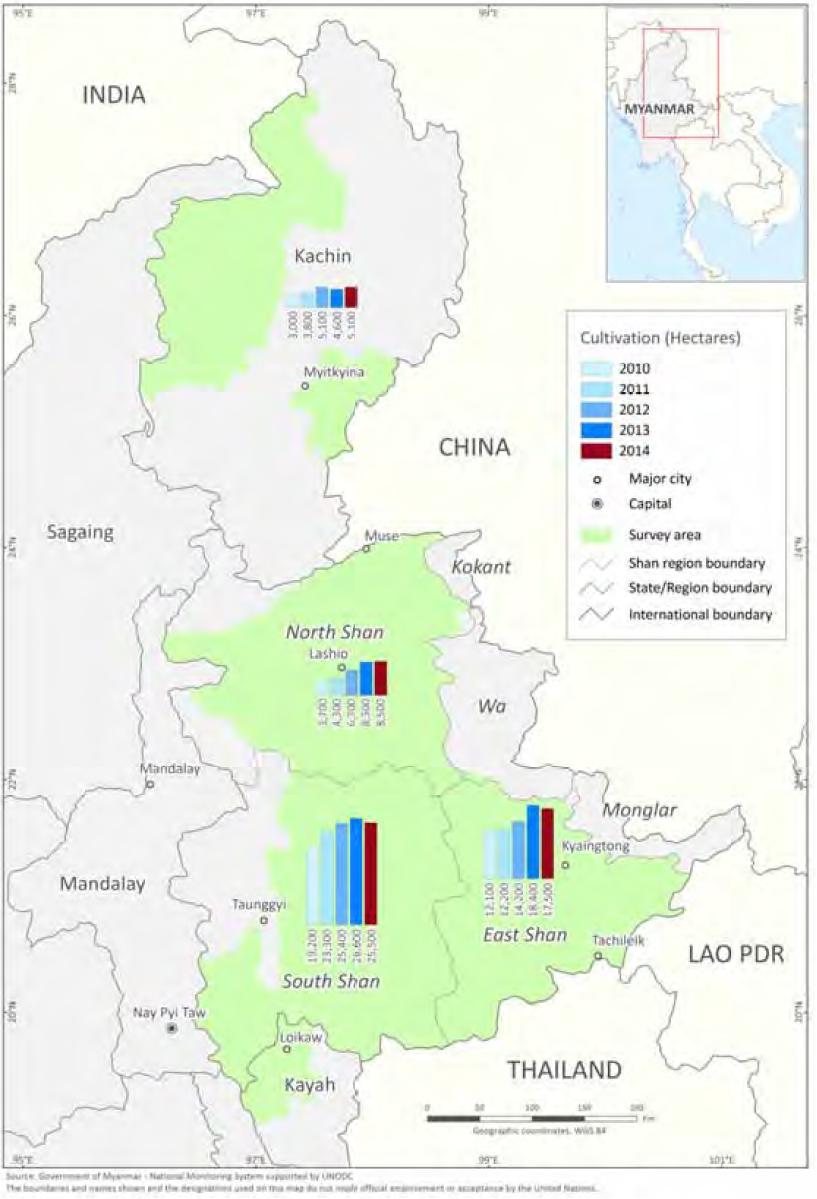
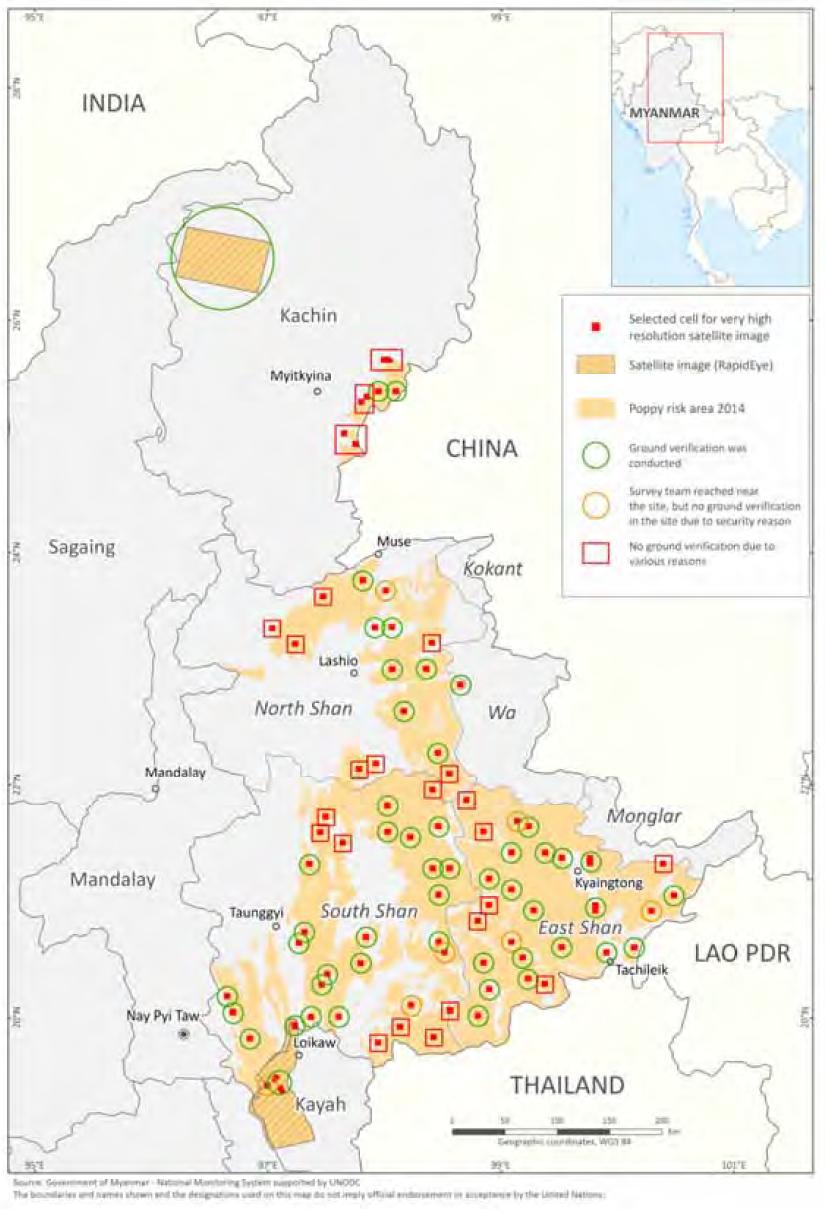
In 2014, the annual Myanmar opium survey covered Shan State (North, East and South) and Kachin, the country's principal poppy-cultivating regions. For the first time, it also covered areas in Chin, bordering India, while North-western Kayah, bordering South Shan, was sampled once again after an absence of several years. Satellite imagery was obtained for East Shan, North Shan, South Shan and Kachin, whereas alternative imaging methods were obtained in Kayah and Chin (see Methodology section). Village interviews were conducted in East, North, South Shan, Kachin, Kayah and Chin States.
The total area under cultivation in 2014 was estimated at 57,600 hectares, representing the first year of stabilization following consecutive year-on-year increases since the low of 21,600 hectares in 2006. It should be noted, however, that the 2014 figure includes 1,100 hectares estimated to be under opium cultivation in Chin, a region not covered in 2013.
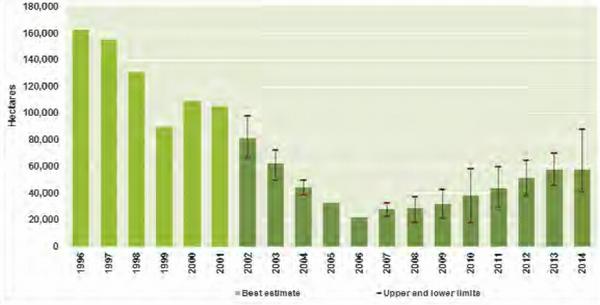
Figure 14: Opium poppy cultivation in Myanmar, 1996-2014 (Hectares)
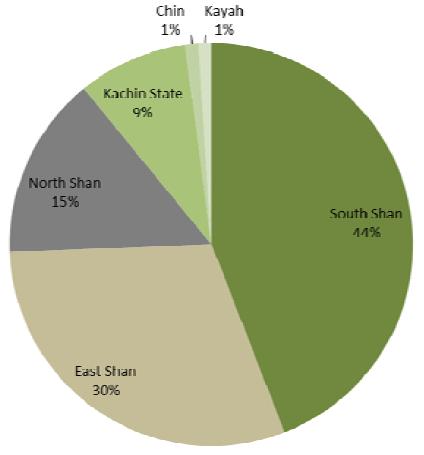
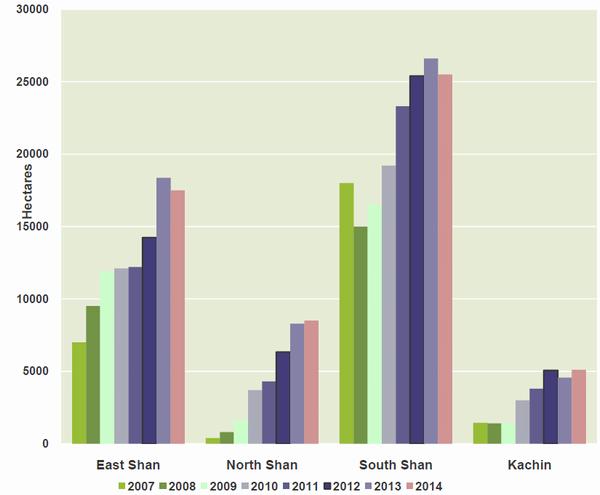
Accounting for 89% of all cultivation nationwide, the vast majority of poppy cultivation took place, as in previous years, in Shan State, with South Shan accounting for nearly half (44%) of national cultivation and East Shan almost a third (30%). Although cultivation in Kachin reverted to its 2012 level, increasing in 2014 by 11% from its 2013 level, small decreases were observed in East and South Shan, which resulted in a 4% overall decrease in cultivation in Shan State in 2014. Indeed, the whole area under poppy cultivation in Myanmar was estimated to be 200 hectares smaller in 2014 than in 2013, but remained within the margin of error of the cultivation estimate, and was thus interpreted as a non-significant decrease.
Figure 15: Area distribution of opium poppy cultivation in Myanmar, 2014
Table 7: Opium poppy cultivation areas, by region, Myanmar, 2013-2014 |62| (Hectares)
2013 2014 Change 2013-2014 Percentage of total area of opium poppy cultivation East Shan 18,400 (9,700 to 27,000) 17,500 (10,300 to 26,500) -5% 30% North Shan 8,300 (4,600 to 12,000) 8,500 (4,800 to 13,300) 2% 15% South Shan 26,600 (19,100 to 34,100) 25,500 (12,500 to 41,700) -4% 44% Shan State total 53,300
(41,200 to 65,300)51,400
(36,100 to 70,600)-4% 89% Kachin 4,600 (3,000 to 6,100) 5,100 (2,200 to 9,300) 11% 8.9% Kayah 500 1.0% Chin 600 0.9% National total (rounded) 57,800
(45,700 to 69,900)57,600
(41,400 to 87,300)-0.3% 100% Figure 16: Opium poppy cultivation, by region, Myanmar, 2007-2014 |63|
2.3. Yield and potential opium production
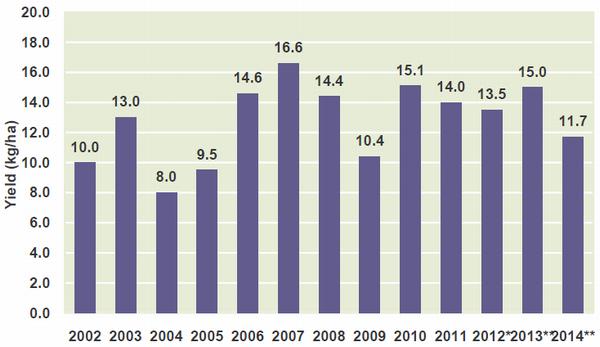
Field measurements taken from a sample of fields resulted in an average yield estimate for each region. The 2014 potential opium yield was estimated to be 22% lower than in 2013, mostly due to major declines in yield throughout Shan State. Yield measurements taken in Kachin produced very high values, which were validated by photographic evidence of the size and health of poppy capsules. The national average in 2014, weighted by area under cultivation, was estimated to be 11.7 kilograms per hectare.
Trends in the opium yield fluctuate from year to year. Estimated yield calculations are dependent on the size of opium poppy capsules, which varies naturally depending on temperature, rain, frost, sun, irrigation and disease. The average 2014 yield was within the natural variation observed in previous years.
Table 8: Potential opium yield, by region, 2013-2014 (Kilograms per hectare)* |64|
Region 2013
Average yield (kg/ha)2014
Average yield (kg/ha)Change
2012-2013East Shan 18.4 10.8 -41% North Shan 12.5 8.0 -36% South Shan 13.4 10.6 -21% Kachin 27.1 NA Kayah 7.5 NA Average* yield 15.0 11.7 -22% *Ratio of total production to total cultivation.
Figure 17: National opium yield, as calculated in 2002 to 2014 surveys, Myanmar, weighted average of all States unless otherwise specified (Kilograms per hectare)
*For Kachin State, data on poppy yield from 2011 were used as the yield survey could not be implemented in that region.
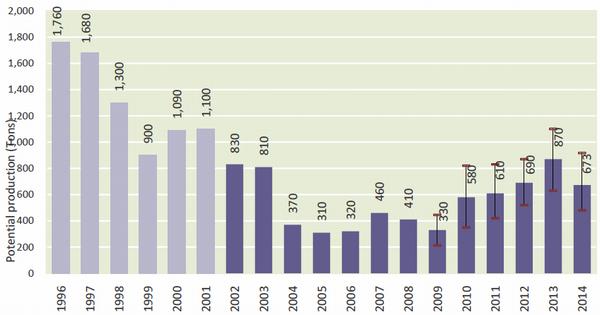
** Based on data from Shan State only.The combination of the drop in the yield per hectare and the stabilization of the area under cultivation resulted in an overall decline in opium production in 2014. This resulted in the volume of opium on the market in 2014 being approximately 200 tons smaller than in 2013, but roughly the same as in 2012. The volume of Myanmar opium on the market in 2014 was also smaller than at any point between 1996 and 2003.
Figure 18: Potential opium production, Myanmar, 1996-2014 (Tons)
Source: 2001 and before: United States Government; since 2002: GOUM/UNODC.
Poppy field in Kye-thee, South Shan Poppy field in Mong ton, East Shan Figure 19: Poppy identification using a very high-resolution satellite image and corresponding "ground truthing" photographs from indicated fields, Myanmar, 2014
Click to enlargeApart from monitoring opium poppy cultivation and production via satellite imagery and field measurements, the opium poppy survey also gathers data from the villages sampled, via interviews with farmers, on the extent of poppy cultivation in individual villages, as well as the number of households involved in poppy cultivation.
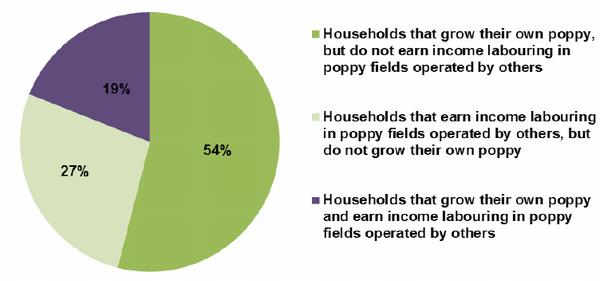
In principal, households can become involved in poppy cultivation by:
- growing poppy in their own fields
- earning income by labouring in poppy fields operated by others (wage labour)
- both growing poppy in their own fields and earning income by labouring in poppy fields operated by others.
The 2014 survey results show that most households (54%) operate their own poppy fields and do not earn income by labouring in poppy fields operated by others. However, 19% of households that operate their own fields also labour for other poppy growers. Furthermore, a significant proportion of households (27%) only provide labour in poppy fields operated by other households, without cultivating their own poppy. This suggests that it would be worthwhile extending alternative development initiatives beyond those who actually cultivate their own poppy, to include those who work solely as labourers in poppy fields.
Harvesting in a poppy field, Leicha, South Shan Harvesting in a poppy field, Leicha, South Shan Figure 20: Breakdown of households involved in poppy cultivation in Myanmar, 2014
Table 9: Breakdown of households involved in poppy cultivation, by role, Myanmar, 2014
Percentage in the region East Shan North Shan South Shan Shan State average, weighted by cultivation Kayah Chin Overall Households that grow their own poppy, but do not earn income labouring in poppy fields operated by others 56% 49% 54% 54% 38% 100% 54% Households that earn income labouring in poppy fields operated by others, but do not grow their own poppy 26% 30% 28% 28% 42% 0% 27% Households that grow their own poppy and earn income labouring in poppy fields operated by others 18% 21% 18% 18% 20% 0% 19% Total 100% 100% 100% 100% 100% 100% 100% 2.5. Opium poppy growing seasons
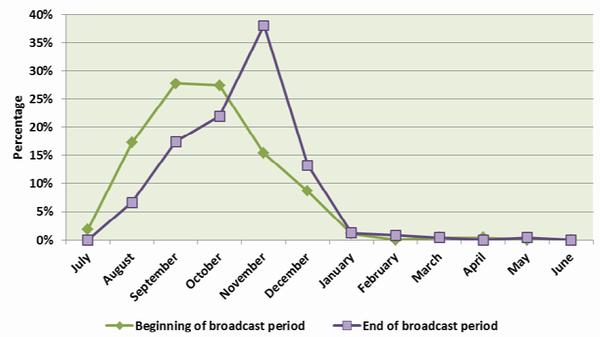
Observations made during the implementation of the 2014 socio-economic survey showed that, as in previous years, farmers in Myanmar staggered the planting of the opium crop to help distribute the workload and to avoid the risk of crop loss due to unfavourable weather during germination, harvest or eradication. Staggered planting means that poppy seed is broadcast in all fields operated by a household over a period of weeks, rather than at the same time. This practice can also apply within individual fields and, depending on the number of fields and their subdivisions, the planting period for poppy can extend over a month or more.
The main poppy-growing season in Myanmar is from September to March (the dry season), with seed broadcasting being carried out mostly in September/October. Opium poppy cultivation in the monsoon season only occurs in southern parts of Shan State, but earlier surveys have shown that the area is of a very limited size (about 500 hectares in 2009) and gives very low yields.
In 2014, the average number of days between the beginning and end of the broadcast period nationwide was 28. There was, however, considerable variation between regions, with South Shan averaging 40 days and East Shan averaging 16.
Figure 21: Beginning and end of the opium poppy broadcasting period, frequency distributions by month, as reported in the 2014 village survey, Myanmar
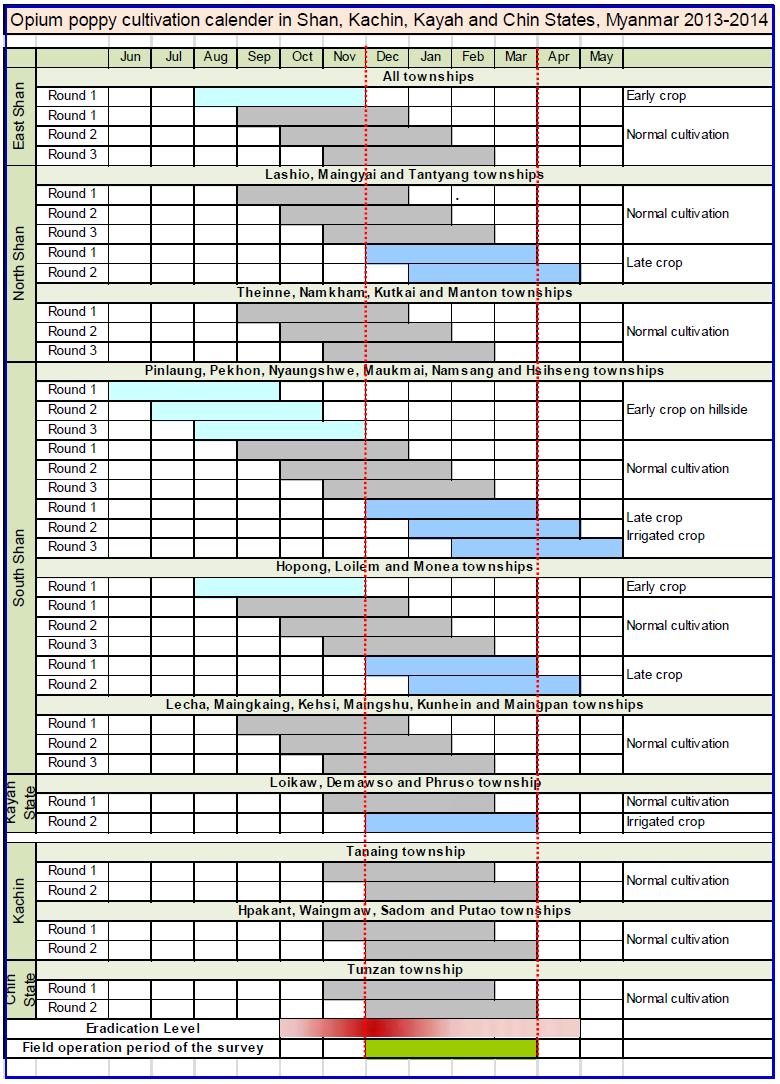
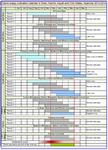
Figure 22: Opium cultivation calendar in Shan State, Myanmar, 2013-2014
Click to enlarge2.6. Reasons for cultivating opium poppy
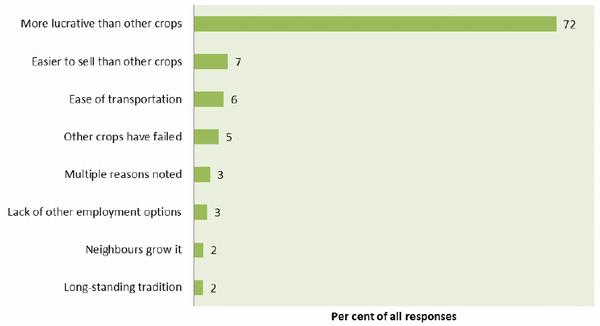
With 72% of poppy-growing villages in Myanmar reporting that they cultivated opium in order to make more (or easy) money, or to cover basic living expenses such as food, education and housing, the reasons farmers turn to opium cultivation are clear.
In the remote rural villages of Myanmar, opium is primarily used as a cash crop for financial shortfalls, and is grown by many out of the need to provide basic necessities for their families. Among poppy-growing villages, 7% of respondents reported that it is "easier to sell poppy than other crops". Mentioned by 6% of poppy-growing villages, "ease of transportation" is a significant factor in the relative ease of cultivating poppy, as transportation difficulties are overcome because traders collect poppy directly from poppy-growing villages, whereas other crops have to be transported to market. A variety of other responses indicated that poppy is cultivated due to a "lack of other employment options" (3%), because "the neighbours grow it" (2%), and because poppy cultivation is a "long-standing tradition" in Myanmar (2%).
Reasons for cultivating poppy do, however, vary between poppy-growing regions. For example, in North Shan, only 60% of poppy-growing villages reported cultivating poppy because it is "more lucrative than other crops", while 12% reported crop failure to be the reason, in contrast to just 5% in all poppy-growing villages. In East Shan, a higher proportion of respondents (10%) than in all poppy-growing villages (6%) reported transportation to be a reason for cultivating poppy.
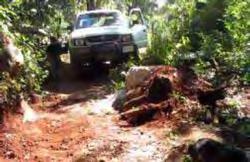
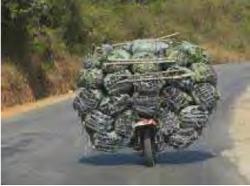
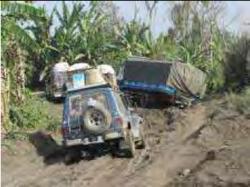
Transportation and distance to market are significant incentives to grow poppy. In 2014, poppy-growing villages were an average of 41 km from the nearest market, whereas non-poppy-growing villages were an average of 21 km from the nearest market. By various means, this distance took an average of 1 hour 15 minutes for non-poppy-growing villages and 2 hours for poppy-growing villages, meaning that buying and selling goods entails a 4-hour round trip for the average poppy-growing village. Each 10-km increase in the distance to market increases the risk of poppy-cultivation by 18%. The willingness of opium traders to collect opium directly from villages considerably reduces the travel burden.
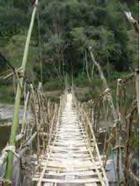
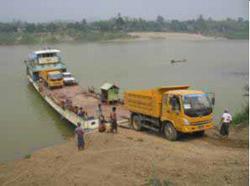
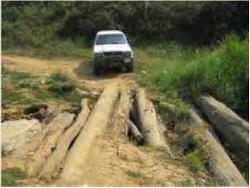
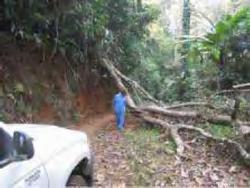
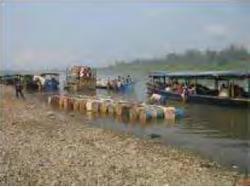
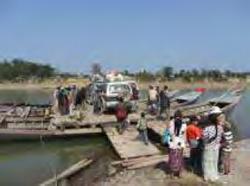
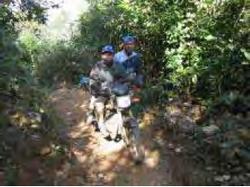
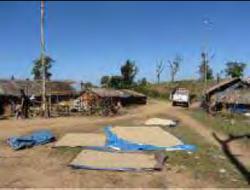
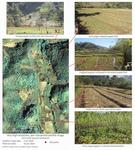
Figure 23: Transportation challenges in rural areas near poppy-growing villages, Myanmar, 2014
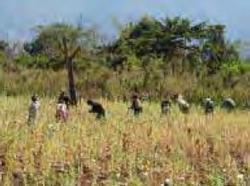
Bamboo bridge, Naga Self-Administration Region Ferry, Khamti township, Naga Self-Administration Region The road from Hpakant township to Khamtit township, Kachin State, Sagaing division The road from Hpakant township to Khamti township, Kachin State, Sagaing division Ta Nai Kha harbour, Ta Ro), Tanaing township, Kachin State Boat transport, Ta Rong Stream, Tanaing township, Kachin State Metmeng Survey team Monea township, South Shan State Figure 24: Reasons for cultivating opium poppy, as reported by farmers in poppy-growing villages, Myanmar, 2014
Easier to sell than other crops Ease of transportation Other crops have failed Multiple reasons noted Lack of other employment options Neighbours grow it Long-standing tradition
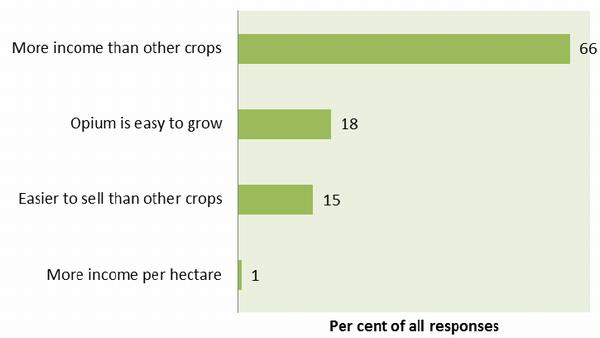
Echoing the reasons for cultivating poppy, the main advantages to poppy cultivation, as described by village respondents in 2014, were that it provides "more income than other crops" (66%), "opium is easy to grow" (18%), and is "easier to sell than other crops" (15%). A small number responded that it generates "more income per hectare" (1%). Taken together, these findings show that, for the purposes of alternative development efforts, any crop chosen to replace opium would need to be competitive, in terms of income generated and time and effort to grow and transport it to market, for it to be competitive with opium poppy.
Figure 25: Farmers' opinions regarding the advantages of opium poppy cultivation, poppy-growing villages, Myanmar, 2014
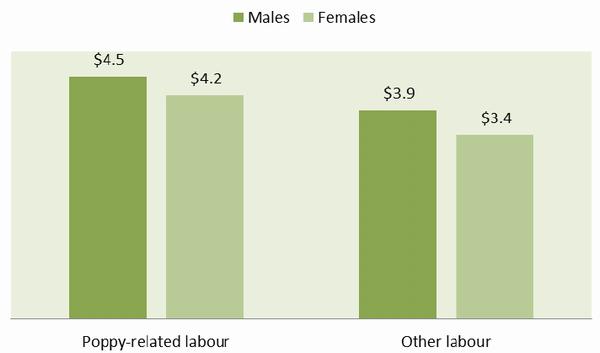
The financial incentives to work in the poppy-growing trade are not only clear for farmers who own their own poppy fields, but also for day labourers. Per day, males earn approximately US$ 0.60 more for poppy labour than for "other" types of labour, while females earn approximately US$ 0.80 more per day, which corresponds to a roughly 15% increase in the daily wage for males and 20% for females. Potential explanations include a greater level of skill required for poppy labour, the seasonal nature of the work, and risk compensation for working in an illicit market.
Figure 26: Average daily labour rate for poppy labour and other labour, by sex, weighted by cultivation, Myanmar, 2014
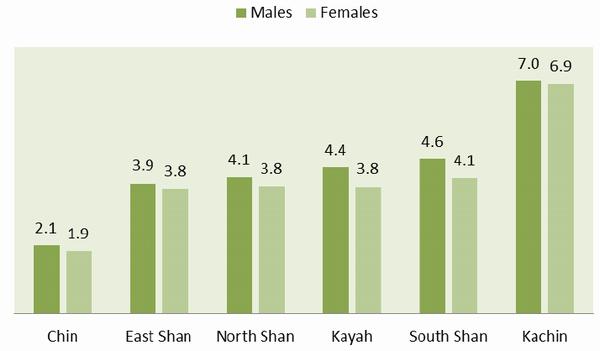
There is, however, a disparity in the daily labour rates of males and females, with males out-earning females for poppy-related work in the entire area surveyed in Myanmar. These differences were statistically significant for East Shan, North Shan and South Shan, where the majority of poppy cultivation takes place. It is important to note the same disparity in the daily labour rate for "other" labour, indicating that this is not an issue unique to the opium poppy economy, but rather an issue that is indicative of a gender pay gap in the licit economy.
Figure 27: Daily wages earned for poppy-related labour, by region and sex, Myanmar, 2014
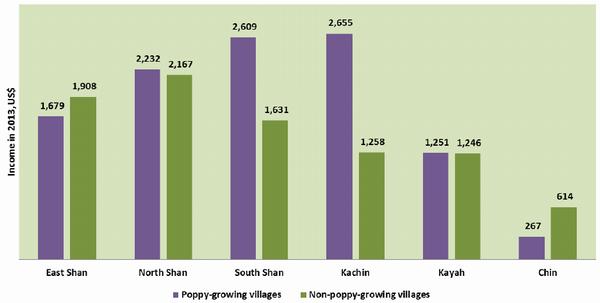
The comparison by region of average household income in poppy-growing and non-poppy-growing villages shows greater differences in South Shan and Kachin than elsewhere. While households in poppy-growing villages in South Shan and Kachin earn more than those in non-poppy-growing villages, the opposite is the case in East Shan. That is due to reportedly higher average salaries in East Shan than elsewhere, but the survey data does not collect information on the sources of those salaries. In comparison to other regions, income in Chin is extremely low, with both poppy-growing and non-poppy-growing villages reporting extremely low average annual incomes.
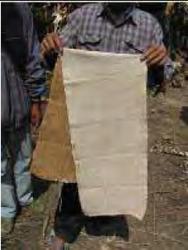
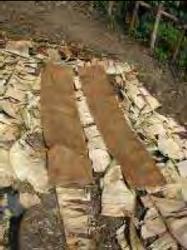
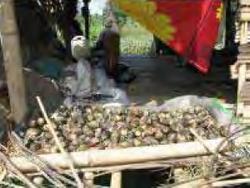
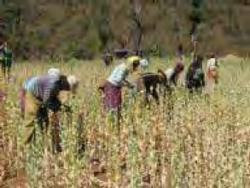
Figure 28: Various types of labour required to harvest and prepare opium, Myanmar, 2014
Opium liquid paste on cotton cloth, Tanaing Tsp, Kachin Opium liquid drying in the sun, Tanaing Tsp, Kachin Poppy capsule harvesting for seed, Tanaing, Kachin Poppy seed harvest for next season, Mong Tong, East Shan Opium harvesting, Tantyan township Opium harvesting, Tantyan township Figure 29: Annual income per household from all sources in 2013 (reported in 2014), by region and poppy-growing status, Myanmar (United States dollars per year)
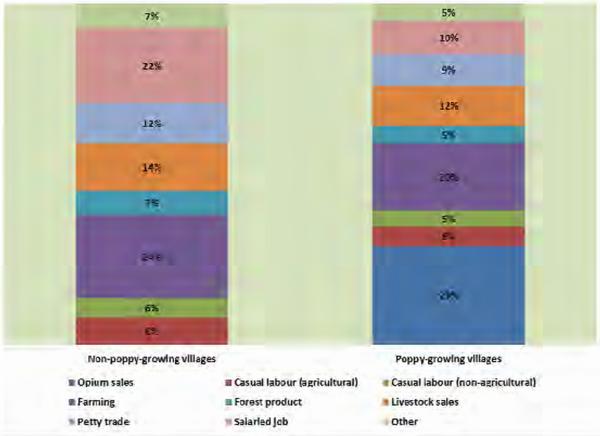
Opium sales make up approximately a third of the average household income in poppy-growing villages. It is likely that earnings from opium are also represented in the casual labour categories for day labourers. In non-poppy-growing villages, larger proportions of income are derived from salaried jobs and farming.
Figure 30: Average proportion of 2013 income per household (reported in 2014), Shan State, Myanmar (United States dollars per year)
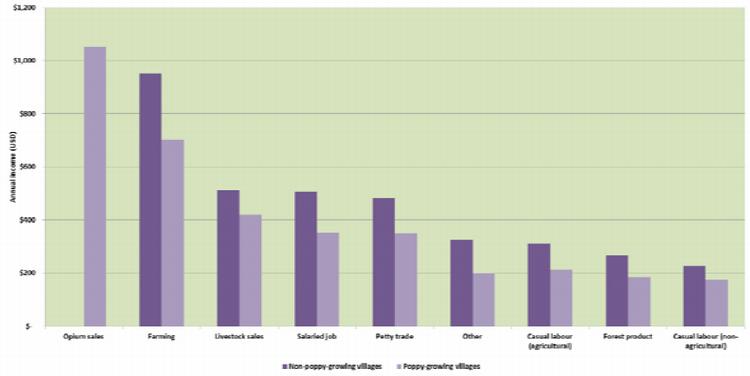
Figure 31: 2013 income per household in all surveyed villages (reported in 2014), by source and poppy-cultivation status, Myanmar, (United States dollars per year)
2.8. Changes in poppy cultivation levels
In 2014, a small number of villages reported that they had grown poppy in previous years but had since stopped. Overall, approximately half of the villages that had stopped growing opium did so because the Government or local militias had prohibited the cultivation of poppy (45%). Others reported that their crops had been destroyed by the weather or by cattle, and one village reported that it had attained sufficient income without poppy and therefore stopped growing it.
Villages were also asked if there had been changes in poppy cultivation and, if so, why those changes occurred. Of all poppy-growing villages that responded to the question, 30% reported a decrease, 42% reported stable cultivation and 27% reported an increase in cultivation.
Table 10: Reasons for increase or decrease in poppy cultivation, current and former poppy-growing villages, Myanmar, 2014.
Principal reasons for decrease in poppy cultivation
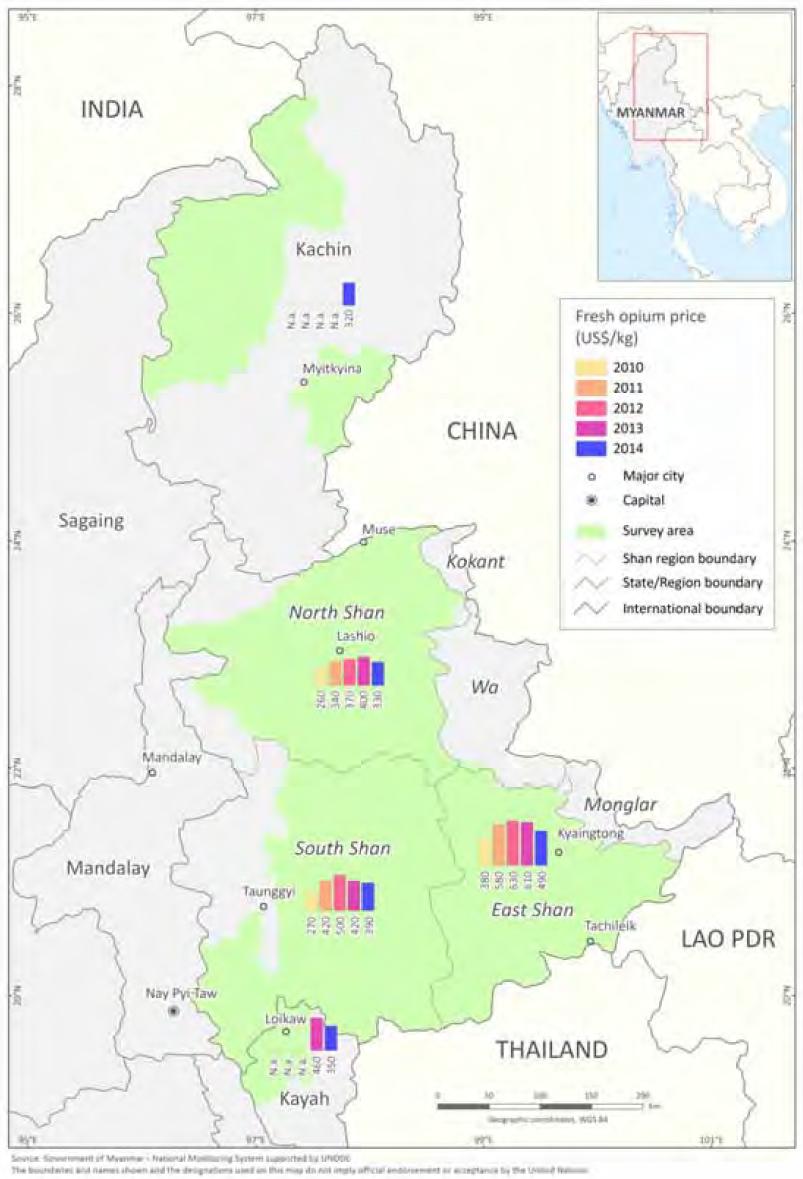
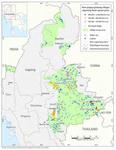
South Shan North Shan East Shan Kachin Bad or unstable weather Prohibition by local authorities Prohibition by local authorities Prohibition by local authorities Worm infestation Bad or unstable weather Worm infestation Bad or unstable weather Insufficient labour force Low yield in past year Bad or unstable weather Worm infestation Low yield in past year Fields destroyed in eradication campaigns Fields destroyed in eradication campaigns Not economically beneficial Principal reasons for increase in poppy cultivation South Shan North Shan East Shan Kachin Easy to sell People from other neighbouring villages came and started growing it More money The number of poppy farmers increased More money To increase family income No eradication campaign Shorter work period The region is unstable Opium price increased last year Heard other villages had increased cultivation Easy transportation Map 8: Trends in the farm-gate price of fresh opium, Myanmar, 2014 (United States dollars per kilogram)
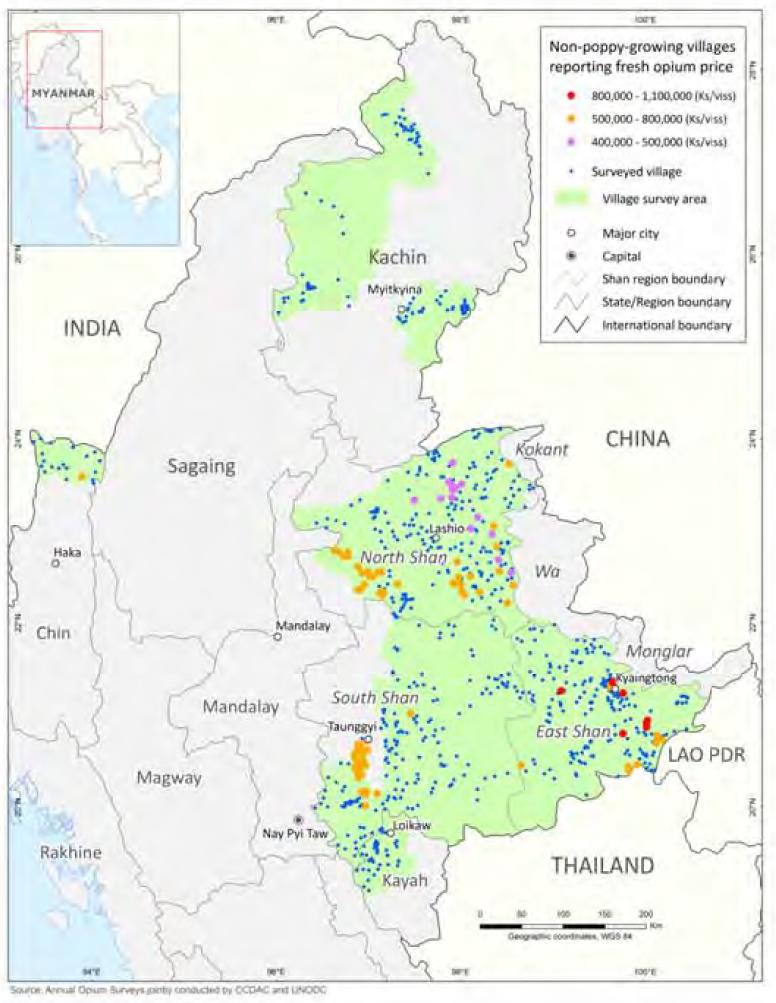
Click to enlarge mapMap 9: Fresh opium prices in non-poppy-growing villages, Myanmar, 2014 (Kyat/Viss) |65|
Click to enlarge mapOpium prices were relatively stable in 2014. From 2002 to 2014 trends in the price of dry and fresh opium (expressed in Kyat per kilogram) appeared to be rising, but after adjustments for inflation they actually remained stable, with little fluctuation in this 12-year period. In light of the fluctuations in the opium supply during this period, the price stability was somewhat unexpected, but since dry and fresh opium prices are prices at source, price fluctuations may be amplified further up the supply chain.
In Shan State, the average farm-gate price per kilogram of opium was US$ 414 in 2014, 20% lower than in 2013 when it was US$ 498. The year-to-year price difference was less striking in the local currency, Kyat, with a decrease of 4% per kilogram of fresh opium (farm-gate) and 5% per kilogram of dry opium. |66| Due to changes in currency conversions over time, care should be taken to avoid the distortion of trends through changes in exchange rates.
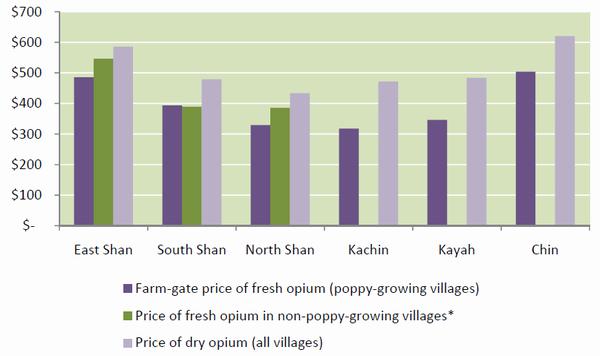
When comparing average 2014 opium prices across the poppy-growing regions of Myanmar, some considerable variation could be observed. For example, a kilogram of fresh opium at the farm gate fetched between US$ 300 in North Shan and US$ 500 in Chin. These prices may differ according to ease of transportation and size of supply, reflecting local supply and demand. On average, the price of fresh opium was higher in non-poppy-growing villages than in poppy-growing villages, which may reflect opium trader-level prices and potential price escalation along the supply chain. Although only a few non-poppy-growing villages reported a price for fresh opium, it was higher, on average, than fresh opium prices in poppy-growing villages.
Figure 32: Fresh and dry opium prices, by State, Myanmar, 2014 (United States dollars per kilogram)
*Kayah, Kachin and Chin did not have a large enough sample of villages to produce an estimate of the mean price of fresh-opium in non-poppy-growing villages.
Figure 33: Farm-gate price (weighted average) of fresh opium in poppy-growing villages, and dry opium price (weighted average) in Shan State, Myanmar, 2002-2014 (kyat per kilogram)*
*For 2012-2014, price reflects data from East, North and South Shan only, weighted by cultivation.
Figure 34: Inflation adjusted farm-gate price (weighted average) of fresh opium in poppy-growing villages, and inflation-adjusted dry opium price (weighted average) in Shan State, Myanmar, 2002-2014, (Kyat per kilogram), in 2014 kyat*
*For 2012-2014, price reflects data from East, North and South Shan only, weighted by cultivation. Inflation-adjusted values represent 2014 real US dollars based on the historical consumer price index.
2.10. Food security and rice deficit
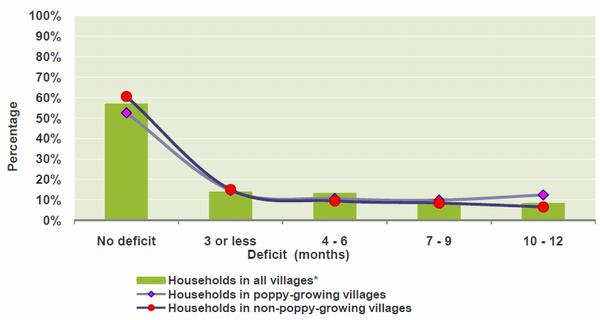
For the purposes of this report, a household is considered to have had a rice deficit if it did not produce enough rice for its own consumption in the 12 months preceding the survey. Conversely, a household is considered food secure if it did not experience a rice deficit during that period.
Of the households in the villages surveyed in 2014, 58% did not experience a rice deficit in the 12 months preceding the survey and were thus food secure, while the remaining households experienced rice deficits of varying durations. With 53% of households in poppy-growing villages being food secure, as opposed to 61% in non-poppy-growing households, the former were slightly less likely to be food secure than the latter.
Figure 35: Breakdown of households, by duration of rice deficit and by poppy-growing status, Myanmar, 2014
*Including villages of unknown poppy-growing status.
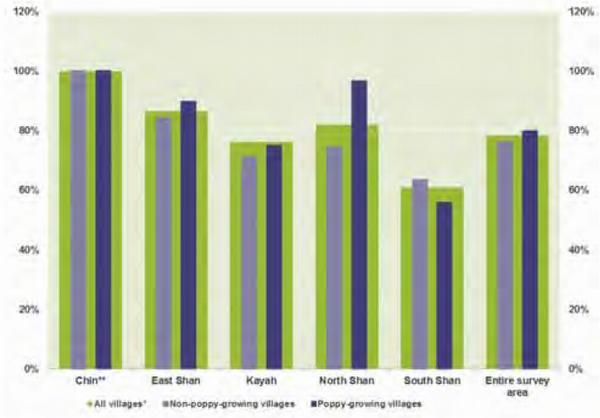
At the village level, four in five villages surveyed contained at least one household that reported a rice deficit. The highest proportion was in Chin, while the lowest number of villages reporting rice deficit was in South Shan. A large disparity was noted in North Shan, where poppy-growing villages were far more likely to experience a rice deficit than non-poppy-growing villages.
Figure 36: Proportion of villages experiencing a rice deficit, by region and poppy-growing status, Myanmar, 2014
Table 11: Comparison of affluence indicators in poppy-growing and non-poppy-growing villages, Myanmar, 2014
Poppy-growing villages Non-poppy-growing villages Significant difference |67| Proportion of food-secure households (%) 55 59 Yes Price of rice (paddy w/husk) per kilogram ($US) US$ 218 US$ 232 Yes Daily rate for non-poppy labour (males) ($US) US$ 3.5 US$ 4.0 Yes Daily rate for non-poppy labour (females) ($US) US$ 3.2 US$ 3.4 Yes Average household income from non-opium sources ($US) US$ 1,425 US$ 1,880 Yes Number of livestock per inhabitant (ratio) 0.39 0.36 No 2.11. Drug use in villages in poppy-growing regions
The prevalence of drug use, as reported by survey respondents, increased in villages in poppy-growing regions in 2014. While this is not generalizable to the population of Myanmar as a whole, |68| it may be evidence of a trend towards the increasing use of opium, amphetamine-type stimulants (ATS) |69| and heroin. Indeed, according to respondents, the prevalence of opium use more than doubled while ATS use and heroin use both tripled from 2012 to 2014.
Drug use was far more common in poppy-growing villages than in non-poppy-growing villages in 2014. Poppy cultivation was associated with a 2% increase in opium use in past-month prevalence among persons over 15 years of age. ATS were also associated with poppy cultivation, but in mathematical models, |70| after adjusting for insurgent activity, poppy-cultivation was no longer predictive of ATS use. The presence of insurgent activity, however, increased the prevalence of ATS use by 1.6%. This could indicate some correlation between insurgent activity and ATS availability and use, but further research would be needed to substantiate these associations.
Figure 37: Past-month prevalence of opium, amphetamine-type stimulants (ATS) and heroin use among persons aged 15 and above, all villages combined, Myanmar 2014
Figure 38: Past-month prevalence of drug use, among persons aged 15 and above, stratified by village poppy-growing status, Myanmar, 2014
Figure 39: Past-month prevalence of drug use among persons aged 15 and above, by region, Myanmar, 2014
Several clusters with a high prevalence of opium use were detected in Shan State and Kachin. In the latter, the highest prevalence of opium use was reported in villages neighbouring an amber mine. High-prevalence areas were detected throughout Shan State, with clusters in East Shan, near the border with Lao PDR.
Geographic patterns of ATS use were distinct from opium use, but were primarily focused around the far North of Shan State and the south-eastern border of East Shan. As regards heroin, all of the high-prevalence villages detected in this survey were clustered together in North Shan and a cluster was observed in close proximity to a jade mine in Kachin. Significant geographic overlap was apparent between conflict areas in North Shan and ATS and heroin use.
Map 10. Prevalence of drug use at the village level, by drug type, Myanmar, 2014
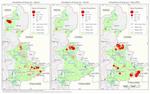
Click to enlarge map2.12. Conflict and poppy cultivation
Map 11: Reported conflicts in Myanmar, 2014
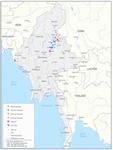
Click to enlarge mapSource: UNODC Country Office, Myanmar. Based on newspaper reports.
Concentrated in North Shan and southern Kachin, conflicts between various groups were ongoing in 2014. Many instances were between the Myanmar Armed Forces (Tatmadow) and either the Kachin Independence army or the Ta'ang National Liberation Army.
Of all surveyed villages, slightly less than three quarters (71%) reported government activity in the past year, with little variation by region and poppy-cultivation status. However, half of villages (mostly in Shan State) reported militia activity, with the highest proportion reported by poppy-growing villages. The level of insurgent activity appeared to be highest in North Shan, as well as in villages which did not disclose their poppy-growing status. The greatest proportion of villages reporting activity by ceasefire groups were in Kayah, with more activity in poppy-growing villages than in non-poppy-growing villages, or those of unknown status.
Figure 40: Proportion (percentage) of villages with government, militia, ceasefire group, or insurgent group activity over the previous 12 months, by region, Mynamar, 2014 |71|
Figure 41: Proportion (percentage) of villages with government, militia, ceasefire group, or insurgent group activity over the past 12 months, by poppy-growing status, Myanmar, 2014
The 2014 opium survey did not monitor or validate the results of the eradication campaign carried out by the Government of the Republic of the Union of Myanmar (GOUM). According to GOUM, a total area of 15,188 hectares was eradicated in the 2013-14 opium poppy season, an increase of 19% from the previous year's figure. As in previous years, some 90% of eradication took place in South Shan.
It is likely that the eradication figures provided by GOUM also included the monsoon poppy crop (before the main growing season), which is not captured by the remote sensing survey carried out in the framework of the opium survey. The poppy cultivation estimate provided in this survey refers to opium poppy identified on satellite imagery at the time the images were taken, and does not take into account eradication carried out after the image date. The cultivation estimate may therefore include poppy cultivation areas eradicated after the image date.
Table 12: Eradication from 2007 to 2014, by region, Myanmar (Hectares)
Region 2006-07 2007-08 2008-09 2009-10 2010-11 2011-12 2012-13 2013-14 East Shan 1,101 1,249 702 868 1,230 1,257 537 356 North Shan 916 932 546 1,309 1,315 977 532 337 South Shan 1,316 1,748 1,466 3,138 3,579 21,157 10,869 13,696 Shan State total 3,333 3,929 2,714 5,315 6,124 23,391 11,939 14,389 Wa Region - - - - - - - - Kachin 189 790 1,350 2,936 847 83 250 395 Kayah 12 12 14 13 38 84 59 67 Magwe 45 - 1 1 - 4 7 60 Chin 10 86 5 2 10 110 32 277 Mandalay - 3 2 - 39 45 - - Sagaing 9 - 1 - - - 2 1 Other States 64 - - - - - - - National Total 3,662 4,820 4,087 8,267 7,058 23,718 12,288 15,188 Source: GOUM/CCDC.
In 2014, the Central Committee for Drug Abuse Control (CCDAC) of the Republic of the Union of Myanmar collaborated with the United Nations Office on Drugs and Crime to implement the annual Myanmar Opium Survey for the twelfth time.
The opium poppy survey was composed of three parallel components:
- A cultivation estimation survey throughout Shan State (North, South, East) and Kachin State. For the first time, an estimate for Chin was also provided, and the northern part of Kayah was included once again, having been surveyed up until 2010. The cultivation survey was based on the use of satellite remote sensing as the primary source of data, which was supplemented by field surveys to provide ground truthing and to support the interpretation of opium poppy fields;
- An opium yield survey in the three regions of Shan State, Kayah and Kachin;
- A socio-economic survey in a total of 882 villages in Shan State and parts of Kachin, Kayah and Chin States.
The poppy cultivation area estimate was based on the interpretation of satellite images. The area estimate by remote sensing methodology was carried out in South, North and East Shan State as well as parts of Kachin State and Chin State. Very high-resolution satellite images were purchased after a systematic random selection throughout the study area, as well as some targeted areas.
At selected locations, Very-high resolution (VHR) images (Geoeye with 2 metre resolution multi-spectral 4 bands plus one 50 cm panchromatic band and WorldView-2 images with 2 m resolution multi-spectral 4 bands plus one 50 cm panchromatic band; as well as some Ikonos and Quickbird images (1-4 metre resolution) were acquired. For every location, images from two different dates with a five-week interval (December/January and February/March) were purchased. Such two-date images facilitate the identification of opium poppy. The image acquisition dates take into account the regional differences in the crop calendars.
In Tanai township, Kachin State, opium poppy cultivation was concentrated in one area and the area estimate was based on a targeted high-resolution image. A RapidEye, 5 metre image was acquired to estimate the poppy area.
Poppy cultivation in the northern parts of Kayah State was estimated by interpreting high-resolution (RapidEye, 5 metre ) images and some VHR images (0.5 metre), to correct for possible errors caused by the lower resolution.
In 2014, estimates in northern Chin State (Tunzang and Tiddim townships), using a high-resolution image (RapidEye, 5 metre) as well in combination with some VHR images, were able to be provided for the first time.
Map 12: Location of different types of satellite images within the sampling frame, 2014
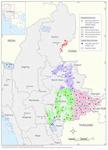
Click to enlarge mapRisk area and sampling frame for the selection of satellite image locations
Risk area describes the entire geographic area considered in the area survey. Basically, the risk area was developed by the combination of the following factors:
- Land cover
- Altitude
- Opium poppy-free |72| areas according to ground information.
Land cover was the first important factor in defining the sampling frame. From the 2012 survey onwards, a land cover map, which was developed by classifying 5 DMC images with 22 metre resolution, acquired in February 2011, was used. From this map, large agricultural areas were extracted and considered to be poppy-free, since the cultivation of opium poppy is practised in small agricultural areas, often surrounded by natural vegetation. Wetlands and settlements were also excluded. Other classes of land use were considered to have the potential for opium poppy cultivation.
Prior to 2013, only altitudes between 800 and 1,800 metres were to be considered within the risk area. This was based on survey findings which had revealed that 95% of opium poppy is cultivated at such altitudes. However, more recent evidence has shown the existence of poppy fields at 600 metres and above, without a specific higher limit. Consequently, the sampling frame for the selection of the sample locations was updated in 2013 using this finding. Several opium poppy-free areas were identified based on information on the ground: Wa Region (S.R.2), Mongla Region (S.R.4) and Kokant Region (S.R.1) were excluded from the sampling frame. The townships Mabein, Kyaukme, Nawnghkio and Kunlon in North Shan and Kalaw, Pin da ya, Yaksauk and Ywangan in South Shan were excluded from the sampling frame for the same reason. A 10-km buffer zone along the border with Thailand, which had been considered to be opium poppy-free in former surveys, was included in the 2013 sampling frame because ground information from the 2012 survey indicated a certain poppy risk.
The above-mentioned factors were combined in a Geographic Information System to calculate the sampling frame. The sampling frame for Waingmaw Township in Kachin State was the same as in the 2013 survey, which was developed with an altitude factor of above 800 metres.
The sampling frame is the set of all 5 km x 5 km segments that can be chosen for obtaining satellite imagery. For that purpose a 5 km x 5 km regular grid is superimposed on the risk area. To increase the efficiency of the sample (thus to reduce the number of pictures purchased that only cover a small part of the risk area), a threshold of a minimum of 30% of risk area is set: if a segment contains less than 30% of risk area (e.g. it is a cell at the boundary of the risk area), it is not included in the sampling frame. In the extrapolation, the whole risk area is considered.
Figure 42: Altitude ranges of opium poppy fields found in satellite images, 2013/2014 (Metres)
Map 13: Sampling frame and selected samples, 2014
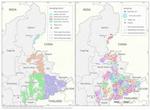
Click to enlarge mapMap 14: Field verification status of the survey with satellite images, 2014
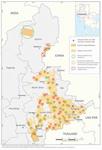
Click to enlarge mapTarget area selection and interpretation
The estimates for Chin, Kayah and Tanai area in Kachin are based on a so-called targeted approach, in which a larger area is deliberately chosen based on information from the ground. This area is then fully covered by satellite imagery. Target areas were selected based on information on poppy cultivation from previous village survey data, administrative boundaries, elevation and distance from the main road.
In both Chin and Kayah, two types of images were used. The wider area was covered with RapidEye imagery, a high-resolution sensor. Within this area, very high-resolution samples were taken, which allowed for an estimation of the omission/commission and geometric error that stems from the use of lower-resolution imagery. To that end, the area was first interpreted on the lower-resolution imagery and then on the high-resolution image. The variation of the differences between the interpretation was then calculated and used for correcting the area estimation and adding ranges to the estimates.
Sampling approach, sample size and sample selection
Because of the more widespread poppy cultivation in the Shan regions and in the south of Kachin, a sampling approach was applied.
In 2014, the total number of satellite images chosen was set to 84, 10 more than in the previous year. This number is mainly based on budget and time constraints, as the interpretation and field verification of satellite imagery is time consuming.
A random sample was drawn in Kachin and the Shan States.
Table 13: Sample size allocation, 2014
Region Frame size Sample size 2013 Sample size 2014 East Shan* 1,204 25 30 South Shan 1,350 27 30 North Shan 736 14 16 Kachin 85 18 8* Total 3,375 74 84 * A minimum of eight cells was chosen for Kachin.
** In previous surveys, the sample of East Shan had the highest variance. Therefore a relatively larger sample size seems to be in order.Since 2010, simple random sampling within geostrata has been applied.
First of all, the frame is separated by region. Here, each segment is be assigned to precisely one region: if the majority of the risk area is within that region, the segment is assigned to that region. Thus, regional boundaries are generalized to fit the 5 x 5 km grid.
Secondly, each subframe (region) is divided into compact geographical strata of approximately equal area. In former surveys the definition of the strata was done manually, but in 2014 it was done by applying a clustering algorithm ("k-means") in the statistical software R |73| package SPCOSA. In each stratum, two sampling locations were selected by simple random sampling.
This sampling method provides a geographically well distributed sample and allows the variance (uncertainty) to be estimated in an unbiased manner.
Satellite image processing
The classification procedure of the very-high resolution images is illustrated in the following flow chart.
Figure 43: Flow chart of satellite image processing steps in Shan state and Kachin (Waingwaw township)
The satellite images were classified with ground truth data collected by the ground control teams. For the first round of images, supervised classifications with maximum likelihood rules were applied to obtain maps that identified different land cover as forest, scrub, grass, agricultural land and possible poppy-growing areas. The images taken in the second round were used to observe changes in possible poppy-growing areas. If there was an apparent change that corresponded to the harvesting of the poppy, it was used to confirm that the field was indeed a poppy field. This was done in a visual manner, since the images were not geometrically corrected and automation was not possible due to the displacement of the fields in question.
In visual interpretation, accuracy and precision of the result vary with the experience and the skills of those doing the interpretation. Therefore an interpretation key (decision rule) was developed for bringing the interpreters to a comparable level of knowledge, experience and notion of the topic. The interpretation key uses features of poppy fields (historical training materials collected in the former surveys) such as tone, colour, shape or texture, in addition to context information and knowledge about the area.
The decision rules can vary by region and stage of poppy cultivation. However, the most commonly applied rule was that potential poppy in the first classification, when classified as bare soil in the second classification, meant that it was opium poppy. Historical data on poppy cultivation, 3D terrain visualization and real colour pansharpened (very high-resolution images) visualization were used to facilitate the decision-making.
Area estimation formulae for area sampling survey
The sample area estimation of the extent of opium poppy cultivation is a ratio estimate using risk area as an auxiliary variable.
The sample mean was calculated as
where k is the number of stratum,
The combined ratio estimate of the area under poppy cultivation is then given by
where
The final national estimate is the sum of poppy estimated in the sample region and the estimate obtained from the target areas.
Even though an unbiased estimator of the variance is available for this sampling design, bootstrapping |74| was performed for estimating the confidence intervals for both national and subnational estimates. This was necessary as the heavily skewed distribution of poppy in the sample led to unrealistic confidence intervals when applying the standard methods.
Bootstrapping consists of sampling with replacement from the original sample with multiple iterations, composed in this case of the total poppy areas of the selected segments. After each iteration, a mean value is estimated and scored. At the end, a distribution of means can be observed, producing a mean estimate and a 95% confidence interval for the mean. The confidence intervals reported are "bca", bias corrected percentile: In bca the confidence intervals are chosen to make the interval median unbiased and adjusted for skewness.
3.3. Opium yield and production
Collection of yield data
Data on the number of yield capsules per plot and capsule volume is collected in the yield survey, which followed the procedure established in the UNODC Guidelines for Yield Assessment. |75|
The 2014 yield survey was smaller than in previous years. Because of the increasingly difficult security situation, only fields where it was possible to complete the survey without time pressure were visited. Furthermore, in an effort to increase data quality, digital cameras were introduced and surveyors were instructed to document the yield data collection, which made it possible to check whether the surveyors had adhered to the protocol. A total of 102 villages were visited in 2014, resulting in measurements being taken in 203 fields.
Data quality
Since 2013, UNODC has undertaken extensive data quality checks on Myanmar yield data, based on experience gained in the Afghanistan opium surveys |76| and the application of a similar set of statistical data quality checks.
The data quality assessment started with basic tests for consistency. In addition, three more tests for identifying data of poor quality were used. The first test was aimed at identifying surveyors that did not follow the yield protocol correctly. This protocol requires surveyors to start by measuring all the mature capsules of a "typical" poppy plant in a plot. If such a plant has less than 10 capsules, all the mature capsules of a second plant are also measured. This process is continued until at least 10 mature capsules have been measured; a procedure which ensures that variability in capsule volumes is captured.
The second test was aimed at identifying data recording and data entry problems. Poppy capsules are usually larger than 10 mm in both height (h) and width (w), and are measured with digital callipers showing two digits after the decimal point. Comprising a total of eight digits (hh.hh and ww.ww), it is unlikely that the height and width measurements of two capsule measurements result in identical values, so an unusually large proportion of duplicate values in a dataset indicates data quality problems. Consequently, if the proportion of duplicated capsule measurements per village exceeded a certain threshold, all the data from that particular village were excluded.
The third test was aimed at measuring the thoroughness of surveyors. Doubts had arisen about how rigorous surveyors were when recording measured values, so this test identified villages in which surveyors did not work with the necessary rigour. Data from villages that failed this test were excluded.
Only consistent data that passed all three tests were considered reliable and used for the yield calculations.
Table 14: Number of villages and fields visited and percentage of accepted data, 2014.
East Shan North Shan South Shan Kachin Kayah Total Villages visited 37 21 17 23 4 102 Villages accepted 32 17 14 19 2 84 Per cent accepted 86% 81% 82% 83% 50% 82% Examples of photographs documenting the yield survey, 2014.
Example of correct measurements from East Shan: the capsule height is measured from its bottom to below the stigma surface. Example of incorrect measurements from Kayah: the capsule height is measured from its bottom to above the stigma surface. These data has been excluded from the sample. Estimating potential opium yield
Yield data collection and calculation follows the UNODC Guidelines for Yield Assessment. |77| In Myanmar, surveyors select mature fields close to villages selected for the village survey and are instructed to visit a good, an average and a bad field. Field selection is also subject to security. Thus, due to circumstances in the field, a certain proportion of fields was chosen in a non-random, opportunistic manner.
Once a field is selected, a transect is drawn through the field, along which three one square-metre plots are selected. In each plot, the numbers of flower buds, flowers, immature capsules and mature capsules expected to yield opium are counted, and the diameter and height of 10 to 15 opium -yielding capsules are measured with a calliper. All data is entered in data sheets for subsequent analysis.
For the 2014 Myanmar survey, the capsule volume per square metre was calculated with these data and entered into the formula for the yield calculation. Each plot thus provided one yield observation. The simple average of the three plots in a field was the field yield. The regional yield was calculated as the simple average of all fields in a region.
For estimating potential opium yield, a relationship between poppy capsule volume per square metre and dry opium yield is used. The relationship is based on extensive field research and is described as
Y = 1.89 + 0.0412 V
where Y is dry opium weight (kg/ha) and V is the mature capsule volume (cm3/m2).
This formula has been developed based on data collected in Thailand and emphasizes the lower end of observed capsule volume. It is based on data varying between 0 and 900 cm /m .
However, high volumes exceeding 900 cm3/m2 were observed in 2014 (particularly in Kachin). The formula was not validated for these ranges, and would supposedly overestimate yields. To avoid overestimation, an alternative formula was used for fields where at least one plot exceeded said volume. This formula was calibrated with combined data from Pakistan and Thailand, and reads as
Y = [(V + 1,495) - ((V + 1,495)2 - 395.259 V)0,5] / 1.795.
A range was calculated to express the uncertainty of the yield estimate due to sampling with the 95% confidence interval.
Table 15: Regional potential opium yield values with 95% confidence intervals, 2013 (Kilograms per hectare)
Region Best estimate Lower limit Upper limit East Shan 10.8 8.7 12.9 North Shan 8.0 5.1 10.9 South Shan 10.6 8.6 12.6 Kachin 27.1 23.0 31.3 Kayah* 7.5 5.8 9.1 * Because of the very small number of fields visited, yields in Kayah have to be considered indicative and not a statistical representative number.
Estimating opium production
Opium production was calculated by the estimated regional area under opium cultivation being multiplied by the corresponding regional opium yield.
All opium estimates in this report are expressed in oven-dry opium equivalent, i.e. the opium is assumed to contain 0% moisture. The same figure expressed in air-dry opium, i.e. opium under "normal" conditions as traded, would be higher as such air-dry opium contains some moisture.
The uncertainties of the opium production estimate due to sampling for the area under poppy cultivation and yield are calculated by using standard formulae for error propagation.
Sample size allocation and sampling
The sampling frame was composed of an updated village listing provided by the Central Committee for Drug Abuse Control in Myanmar. The village listing included names of villages, townships, regions and their codes. The listing also included the opium poppy-growing history and the GPS latitude and longitude of the former surveyed villages. This listing or baseline data is regularly updated with information obtained through previous surveys to reflect changes in village location or name, village mergers and relocations, and to delete double entries. For many village entries, GPS positions facilitate the unique identification of each village.
Villages in townships considered to be free from poppy cultivation, based on field reports or previous surveys, were excluded from the village listing to establish the sampling frame for the opium risk area.
The sample size was influenced by a number of requirements and constraints. The main requirement was the level of accuracy considered acceptable for the estimates, whereas the constraints were either economical or logistical.
The target in the Shan States was 800 villages. The sample sizes were allocated proportional to the square root of the number of villages in the frame in each State. This is a change compared to 2013 when the villages were assigned proportionally to the number of villages in the sampling frame. In comparison to a proportional allocation, using the square root reduces the differences in the sample sizes between States, and allows for relatively more accurate estimates in smaller states.
Sampling sizes in Kayah, Kachin and Chin were mainly based on logistical considerations, given that Kachin and Chin in particular contain very remote and hard-to-reach areas.
The sampling methodology applied is systematic random sampling: all villages in a given State/province are sorted by their unique village code, which is made up of a township code and some other number. To ensure a geographical spread of the selected villages a systematic random sampling approach is applied to this village list sorted by village code. Geographical coverage of the sample is also thought to ensure a good representation of the variability in the sampling frame, as it should capture a variety of different terrains, ethnic groups and other characteristics that can influence the results.
Survey organization and ground truthing
As in previous years, components of the survey were coordinated by the UNODC Country Office in Myanmar and operationally implemented in close collaboration with government institutions.
The village surveys for measuring opium yield and socio-economic indicators were supervised and implemented by CCDAC, while UNODC provided technical support, coordination and supervision with national and international staff throughout the survey.
Field measurements by a survey team, North Shan Ground data collection by ground truth team for satellite image analysis, Tang yan township, North Shan In 2014, rapid assessment surveys on compliance with the opium ban were conducted in the three Shan Special Regions (S.R), S.R.1 (Kokant), S.R.2 (Wa) and S.R.4 (Mongla). The assessment surveys in S.R.2 (Wa) and S.R.4 (Mongla) were directly implemented by UNODC as the regional authorities gave authorization for the surveys. The rapid assessment survey in S.R.1 (Kokant) was carried out in close collaboration with the CCDAC. According to observations and ground information during the survey, there was no evidence of opium poppy cultivation in these regions in 2014.
The area estimation was conducted in collaboration with the Remote Sensing and GIS Section of the Forest Department, Ministry of Environmental Conservation and Forestry. Four teams from the Forest Department conducted ground verification in the different Shan States. All teams, each comprising two surveyors from the Forest Department and one officer from the local Anti-narcotic Task Force, visited selected satellite sample sites between mid-January and the end of March 2014. Two teams from the UNODC country office, each in collaboration with a CCDAC officer, conducted ground verification in Shan State.
The ground verification teams visited selected sites with printouts of the corresponding satellite images. Once they reached the area represented in each single scene, they annotated the print with land use classes, delineated boundaries and collected detailed information along specific transects. They collected GPS coordinates and took field photos. In the office, the data collected were then used to classify the satellite images combining digital and visual interpretations. The image interpretation by the Forest Department was monitored by two GIS analysts from the UNODC country office. The results were quality control checked by a UNODC GIS analyst in the UNODC Myanmar country office. The final results were subject to quality control by the international remote sensing expert at UNODC Headquarters, Vienna.
Organization of village survey interviews and yield data collection
In total, 156 surveyors carried out the village survey in Shan, Kayah, Kachin and Chin States. The surveyors were selected by the CCDAC in collaboration with local authorities. UNODC trained the surveyors in socio-economic data collection and poppy field measurements for yield estimation. Village survey training for each region was conducted as described in the table.
Figure 44: Socio-economic interview at Tunzang township, northern Chin
Table 16: Training village surveyors
Region From To Trainees Venue South Shan and Kayah 4/12/2013 7/12/2013 57 Taunggyi North Shan 11/12/2013 14/12/2013 51 Lashio East Shan 11/12/2013 14/12/2013 30 Kyaing Ton Kachin 25/02/2014 28/02/2014 15 Myitkyina Chin 25/02/2014 28/02/2014 3 Tunzang Total 156 The surveyors who completed the training were organized into teams. Each team leader was from the Myanmar Police Force and the team members were one person from the General Administrative Department and one from the Settlement and Land Records Department, or the Myanmar Agriculture Service, from each township.
One survey team was assigned to each township and two teams were assigned to each township with either a particularly heavy workload or difficult accessibility (townships with more than 40 selected villages).
A supervisor from CCDAC head-office (Nay Pyi Taw) and five supervisors coordinated the local authorities for field operations in each region while two staff from the UNODC country office in Myanmar monitored the field work in its entirety. The survey teams were all involved in interviews with village headmen and heads of households, as well as in field measurements for the collection of yield estimation variables.
The supervision teams met with all the teams during the field survey to assess the progress of the survey and ensure quality control. More details about the organization of the survey can be found in the table below.
Table 17: Key information on the implementation of the 2014 socio-economic survey
North Shan South Shan East Shan Kachin Kayah Chin Total Start date 17/12/2013 09/12/2013 16/12/2013 05/03/2014 13/12/2013 05/03/2014 09/12/2013 End date 27/02/2014 27/02/2014 01/03/2014 28/04/2014 07/02/2014 05/05/2014 05/05/2014 Targeted villages 300 280 220 100 40 20 960 Surveyed villages 281 231 221 90 40 19 882 Percentage of villages 94% 83% 100% 90% 100% 95% 92% Households covered 29,256 16,937 9,172 18,664 2,471 872 77,372 Rural population covered 142,643 84,034 47,382 99,217 13,616 5,173 392,065 Limitations of the village survey
There are several methodological limitations in the village survey methodology that may limit the explanatory power of the survey.
- The data obtained are aggregated at the village level, so all analyses reflect the likelihood of the village to cultivate poppy or the proportion of poppy cultivated. These factors cannot lead to conclusions about why individual people grow poppy or work in the poppy trade.
- The interviews are conducted with a group that consists of village headmen and key informants. It is often unclear exactly how this group is formed, thus it cannot be guaranteed that the information obtained would be the same if households were chosen randomly.
- The interviewers are trained and instructed to establish a basis of trust before conducting the interview. However, since law enforcement is part of the group, a certain effect on the interview answers cannot be excluded ("social desirability" or reluctance to talk freely about illicit activities).
Estimating the number of households involved in poppy cultivation
The 2014 survey evaluated household involvement in poppy cultivation by asking respondents to estimate the number of:
- Households growing their own poppy, but not earning income form labour in poppy fields operated by others
- Households earning income from labour in poppy fields operated by others, but not growing their own poppy
- Households both growing their own poppy and earning income form labour in poppy fields operated by others.
In the 2013 survey, reports from the field indicated the existence of a fourth type of involvement, called communal poppy farming, whereby the village community operates a poppy field to earn income for a community purpose. In such cases, households work in a poppy field without receiving payment, but as communal poppy farming does not generate income at the household level, it was not included in the household-involvement typology. The 2013 survey results indicated that only a very small proportion of poppy fields fell into the communal poppy cultivation category.
Average poppy area per household
The estimated number of households involved in the cultivation of opium poppy is derived as a ratio of the estimated area under cultivation divided by the average area cultivated per household. The average area cultivated per household is calculated by dividing the area under poppy cultivation, reported by headmen during the village survey interview, by the number of "households involved in poppy cultivation".
In the context of understanding the distribution of land by crop, the average poppy area per household in poppy-growing villages is calculated by dividing the poppy area reported by headmen by the reported number of all households in the village.
Table 18: Poppy households, by type of involvement and average poppy area cultivated, 2014
Number of households (rounded) Poppy area per household (hectares) Category 1 and 2: Households growing poppy (including those doing additional wage poppy-related labour) 135,000 0.43 Categories 1, 2 and 3: Households involved in poppy cultivation 182,000 0.32 [Source: United Nations Office on Drugs and Crime - UNODC, Central Committee for Drug Abuse Control, Lao National Commission for Drug Control and Supervision, Vienna, 08Dec14]
Annex I: Information on opium poppy cultivation in Kokang Region (S.R.1), Wa Region (S.R.2) and Mongla Region (S.R.4)
Two dedicated teams, both led by UNODC national staff members, conducted a rapid assessment survey in Kokang, Wa and Mongla Regions.
Kokant Region
Kokant Region is considered to have been opium poppy-free |78| since 2003. An assessment survey was conducted by a dedicated team led by UNODC staff in collaboration with local anti-narcotic task force members, to certify the poppy-free status of the region. The survey was carried out in December 2013. The team visited Kyasishu, Tar shu tang, Shauk kaing, Chin saik htan and Shauk pin kaing villages in Laukkai and Kon Gyan townships. The survey indicated no evidence of poppy cultivation in this region.
Wa Region
Wa Region has been opium poppy-free since 2005. A dedicated team led by UNODC national staff worked in coordination with local authorities to conduct a rapid assessment survey in this region. The survey was conducted in February 2014. The team visited Mong pawk, Pang kham, Nam kham woo, Ai chan, Mong mao, Yin phang, Ka laung pha, Long tang, Nar wee, Man ton, Man man sein, Weing kao, Hotao and Mong phan townships in the region. The survey indicated no evidence of opium poppy cultivation in this region.
Mongla Region
A rapid assessment survey was also conducted in Mongla Region (S.R.4) to certify its opium poppy-free status. The survey was carried out in February 2014. Due to various reasons, the survey team could not visit the target areas. The survey indicated no evidence of poppy cultivation in this region, which has been opium-free since 1997.
Annex II. Opium poppy cultivation status, by township
The table below indicates poppy-growing status according to different sources, either from the remote sensing analysis, from the socio-economic survey or from the eradication campaign.
Table 19: Poppy-growing status in 2014, by township and source
Region Township In satellite image location During the socio-economic survey Eradication campaign East Shan Khengtung ✓ ✓ ✓ Mongkhet ✓ ✓ ✓ Monghpyak ✓ ✓ ✓ Mongping ✓ ✓ ✓ Monghsat ✓ ✓ ✓ Mongton ✓ ✓ ✓ Mongyang - - ✓ Metmang ✓ ✓ ✓ Tachileik ✓ ✓ - Sub total 8 8 8 North Shan Kunlong - - - Kutkai ✓ ✓ ✓ Kyaukme - - ✓ Lashio ✓ ✓ ✓ Mong yai - - ✓ Manton ✓ ✓ ✓ Momeik ✓ - - Muse - ✓ ✓ Namhkam ✓ ✓ ✓ Namhsan - - - Namtu ✓ - - Tangyan ✓ ✓ ✓ Theinne ✓ - ✓ Hsipaw ✓ - - Sub total 8 6 9 South Shan Kalaw - - ✓ Hopong ✓ ✓ ✓ Hsihseng - ✓ ✓ Kyethi ✓ ✓ ✓ Kunhing ✓ ✓ ✓ Laihka - ✓ ✓ Loilen ✓ ✓ ✓ Lin khay ✓ - ✓ Mongkaung ✓ ✓ ✓ Mongpan ✓ ✓ ✓ Monghsu ✓ ✓ ✓ Mawkmai ✓ ✓ ✓ Monae ✓ ✓ ✓ Nansang ✓ ✓ ✓ Nyaungshwe ✓ - ✓ Pekon ✓ ✓ ✓ Pinlaung ✓ ✓ ✓ Taunggyi ✓ - ✓ Sub total 15 14 18 Kachin Waingmaw ✓ ✓ ✓ Tanai ✓ ✓ ✓ Puta-O - ✓ - Sub total 2 3 2 Kayah Demoso ✓ ✓ ✓ Hpruso ✓ ✓ ✓ Loikaw ✓ ✓ ✓ Subtotal 3 3 3 Chin Tonzang ✓ ✓ ✓ Sub total 1 1 1 Total 37 35 41
Notes:
1. UNODC, Southeast Asia Opium Survey 2013. [Back]
2. OECD, Economic Outlook for Southeast Asia, China and India 2014. [Back]
3. ASEAN, Roadmap for an ASEAN Community 2009-2015. [Back]
4. UNODC, Transnational Organized Crime in Southeast Asia and the Pacific: A Threat Assessment (TOCTA) 2013. [Back]
5. UNODC, Southeast Asia Opium Survey 2014. [Back]
6. UNODC, Southeast Asia Opium Survey 2014. [Back]
7. The estimated quantity of heroin is equal to 1/10th of the amount of opium used for heroin production. [Back]
8. UNODC, Transnational Organized Crime in Southeast Asia and the Pacific: A Threat Assessment (TOCTA) 2013. [Back]
9. 2014 Annual Report on Drug Control in China, Office of China National Narcotics Control Commission (NNCC) [Back]
10. UNODC, World Drug Report 2014. [Back]
11. Drug Abuse Information Network for Asia and the Pacific (2014). [Back]
12. UNODC, Patterns and Trends of Amphetamine-Type Stimulants and Other Drugs: Challenges for Asia and the Pacific (2013). [Back]
13. UNODC, Patterns and Trends of Amphetamine-Type Stimulants and Other Drugs: Challenges for Asia and the Pacific (2013). [Back]
14. UNODC, Transnational Organized Crime in Southeast Asia and the Pacific: A Threat Assessment (TOCTA) 2013. While the prevalence of opiate use in East and Southeast Asia remains much lower (0.2%) than the global average of 0.4%, due to the large population size, the region has the highest number of opiate users in any region. [Back]
15. 2014 Annual Report on Drug Control in China, Office of China National Narcotics Control Commission (NNCC). [Back]
16. 2014 Annual Report on Drug Control in China, Office of China National Narcotics Control Commission (NNCC). [Back]
17. Other Member States are Brunei Darussalam, Guam, Japan, Korea (Dem. People's Rep.), Mongolia, Timor-Leste. [Back]
18. UNODC, World Drug Report 2014. [Back]
19. UNODC, Transnational Organized Crime in Southeast Asia and the Pacific: A Threat Assessment (TOCTA) 2013. [Back]
20. Southeast Asia Opium Survey 2013. [Back]
21. UNODC, World Drug Report 2014. [Back]
22. Southeast Asia Opium Survey 2013. [Back]
23. UNODC, Transnational Organized Crime in Southeast Asia and the Pacific: A Threat Assessment (TOCTA) 2013. [Back]
24. UNODC, Transnational Organized Crime in Southeast Asia and the Pacific: A Threat Assessment (TOCTA) 2013. [Back]
25. UNODC, World Drug Report 2013. [Back]
26. UNODC, World Drug Report 2013. [Back]
27. UNODC, Transnational Organized Crime in Southeast Asia and the Pacific: A Threat Assessment (TOCTA) 2013. [Back]
28. Excluding production in Thailand due to the unavailability of data for the survey year 2014. [Back]
29. In the absence of more recent yield surveys, the result of the 2007 yield survey was used for the years 2007-2013. [Back]
30. Range refers to the 95% confidence interval of the estimate. [Back]
31. In 2014, the survey area was extended, with two more provinces added (Bokeo and Xaignabouri). Furthermore, the timing of the survey in 2014 was different from in 2013. These factors make a year-to-year comparison not possible. See Methodology section for details. [Back]
32. In the absence of updated yield estimates, in 2013 estimated yield per hectare from 2007 was used. In 2014, a yield survey was conducted for the first time since 2007. A year-to-year comparison is therefore not possible. [Back]
33. Due to the long gap between yield estimates, a year-to-year comparison is not possible. [Back]
34. Source: LCDC, Provincial authorities survey. Due to the limited market for opium, a clear distinction between farm-gate, wholesale and retail prices could not be established. [Back]
35. Source: LCDC. Eradication campaigns were conducted during and after the survey. For 2014, no eradication data was reported. [Back]
36. UNODC began to survey the cultivation of opium in Lao PDR in 1992 based on an inventory of all known opium-producing villages. Similar surveys were conducted in 1996, 1998 and then annually from 2000 to 2004, when the methodology was changed to a helicopter-based survey. [Back]
37. Average yields of provinces included in the yield survey, weighted by estimated cultivation in those provinces. [Back]
38. UNODC Guidelines for yield assessment of opium gum and coca leaf from brief field visits, UN New York, 2001, ST/NAR/33. See also UNODC (2003): Limited opium yield assessment surveys. Technical report: Observations and findings. "Guidance for future activities". In: Scientific and Technical Notes, SCITEC/19, December 2003. [Back]
39. Simple average of all provincial prices. Corresponds to Kip 14,840,000; currency conversion rate as provided by LCDC. [Back]
40. Borlikhamxay, Bokeo, Houaphanh, Louang Namtha, Luangphrabang, Oudomxai, Phongsali, Vientiane, Xayabuly, Xaysomboun, Xiengkhouang. [Back]
41. Reported as "addicts"' by LCDC. [Back]
42. See the Methodology section in the Southeast Asia Opium Survey 2013, available at http://www.unodc.org/unodc/en/crop-monitoring/index.html. [Back]
43. http://www.r-project.org/ and package http://cran.r-project.org/web/packages/spcosa/index.html. [Back]
44. http://cran.r-project.org/web/packages/boot/index.html. [Back]
45. UNODC Guidelines for yield assessment of opium gum and coca leaf from brief field visits, UN New York, 2001, ST/NAR/33. See also, UNODC (2003): Limited opium yield assessment surveys. Technical report: Observations and findings. "Guidance for future activities". In: Scientific and Technical Notes, SCITEC/19, December 2003. [Back]
46. UNODC Guidelines for yield assessment of opium gum and coca leaf from brief field visits, UN New York, 2001, ST/NAR/33. See also UNODC (2003): Limited opium yield assessment surveys. Technical report: Observations and findings. "Guidance for future activities". In: Scientific and Technical Notes, SCITEC/19, December 2003. [Back]
47. In three exceptionally productive plots, the capsule volumes exceeded the upper end of the range. To avoid over-estimating yields, the non-rectangular hyperbola formula was applied (see UNDOC guidelines). [Back]
48. Numbers in brackets indicate upper and lower bounds of the best estimate. Year-to-year comparisons of less than a 5% change from the previous year are considered statistically stable. [Back]
49. May include areas eradicated after the date of the area survey. [Back]
51. At harvest time, weighted by area under cultivation. Based on data in Shan State only. [Back]
52. The price of opium at the farm gate in kyat only decreased by 4% from its 2013 level. However, due to changes in the exchange rate, the difference appears much larger in US$. Additionally, in 2013 the 2012 exchange rate was used, whereas in 2014 the methodology was updated to use a simple average of the exchange rates from January to June, to reflect more accurately the rate of exchange between the kyat and the US dollar during the 2014 poppy harvesting season. Therefore, the majority of the 17% decline in price is explained by the conversion from kyat to $US, as opposed to an actual drop in the price of fresh opium at the farm gate. [Back]
53. The product of dry opium production and dry opium prices collected during the harvest season. [Back]
54. Due to changes in valuation of currency reflected in exchange rates, the loss as expressed in $US is greater than in kyat. In kyat, the decline in the production value from 2013 to 2014 reflects a loss of 27%, 10 percentage points lower than the 37% drop reported in $US. [Back]
55. Estimated by the total area under cultivation, divided by the average hectares per household of all persons who either own their own fields or work in another's poppy field. [Back]
56. Estimated by the total area under cultivation, divided by the average hectares per household of all persons who have their own poppy field. The number of households where the inhabitants exclusively labour in another's poppy field were excluded. [Back]
57. No confidence interval was given for the estimate in the UNODC Southeast Asia Opium Survey 2013. [Back]
58. Numbers in brackets indicate upper and lower bounds of the best estimate. Year-to-year comparisons of less than a 5% change from the previous year are considered statistically stable. [Back]
59. These estimates are not generalizable to the population at large. [Back]
60. According to the UNODC (2010): Myanmar Situation Assessment on Amphetamine-Type Stimulants, p.9., "yaba'', as it is known in Myanmar, is methamphetamine in pill form, which falls under the broader class of amphetamine-type stimulants (ATS). [Back]
61. In 2014, opium cultivation was measured for the first time in Kayah and Chin, but is not shown here due to a lack of trend data. [Back]
62. Numbers in brackets indicate upper and lower limits of the best estimate. Kayah and Chin were added to the 2014 opium survey. Chin was added for the first time, while Kayah was sampled after several years of absence of estimates for that region. [Back]
63. Kayah and Chin excluded from figure due to missing trend data for previous years. [Back]
64. Average for all areas, including Shan State, Kachin and Kayah, weighted by area under poppy cultivation. NA=not applicable. [Back]
65. A Viss is a unit of weight utilized in Myanmar equivalent to 1.63 kilograms. [Back]
66. In 2013, the price of opium in kyat per kilogram at the farm gate, restricted to Shan State and weighted by cultivation, was 418,434. In the 2014 survey, it was estimated to be 403,385, reflecting a 4% drop in price. Similarly, the price of dry opium dropped approximately 27,000 kyat, from 520,942 in 2013 to 493,894. [Back]
67. Significance is assigned for p-values equal to or less than 0.05 from logistic regression models predicting poppy cultivation (1=yes, 0=no). [Back]
68. The village survey is specifically designed to capture a large sample of poppy-growing villages, which is likely to be biased towards higher levels of drug use in comparison to a random sample of villages throughout the country. [Back]
69. Known locally as "Yaba". [Back]
70. Multivariable linear regression model predicting the prevalence of ATS use (continuous), with the binary poppy-cultivation and presence of insurgent groups in the past months as independent variables. [Back]
71. A militia group is designated by the Government, distinguishing it from an insurgent or ceasefire group. Ceasefire groups are armed rebel groups which have signed the ceasefire agreement with the Government. [Back]
72. Opium poppy-free in the sense of no indication for significant levels of opium poppy cultivation. [Back]
73. http://www.r-project.org/ and package http://cran.r-project.org/web/packages/spcosa/index.html [Back]
74. http://cran.r-project.org/web/packages/boot/index.html. [Back]
75. UNODC Guidelines for yield assessment of opium gum and coca leaf from brief field visits, United Nations New York, 2001, ST/NAR/33. See also UNODC (2003): limited opium yield assessment surveys. Technical report: Observations and findings. Guidance for future activities. In: Scientific and Technical Notes, SCITEC/19, December 2003. [Back]
76. See MCN/UNODC Afghanistan Opium Survey 2012, May 2013, page 82. [Back]
77. UNODC Guidelines for yield assessment of opium gum and coca leaf from brief field visits, UN New York, 2001, ST/NAR/33. [Back]
78. There was no indication of significant levels of opium poppy cultivation. [Back]
Corruption and organized crime
 | This document has been published on 22Mar16 by the Equipo Nizkor and Derechos Human Rights. In accordance with Title 17 U.S.C. Section 107, this material is distributed without profit to those who have expressed a prior interest in receiving the included information for research and educational purposes. |