| Information |  | |
Derechos | Equipo Nizkor
| ||
| Information | | |
Derechos | Equipo Nizkor
| ||
Jun14
World Drug Report 2014
Back to ContentCONTENTS
PREFACE
EXPLANATORY NOTES
EXECUTIVE SUMMARY1. RECENT STATISTICS AND TREND ANALYSIS OF ILLICIT DRUG MARKETS
A. Extent of drug use: global overview
B. Health and social impact
C. Regional trends in drug use
D. Opiates: overview
E. Cocaine: overview
F. Cannabis: overview
G. Amphetamine-type stimulants: overview
H. New psychoactive substancesA. Introduction
B. What are precursor chemicals?
C. The potential vulnerability of the chemical industry to the diversion of precursor chemicals
D. Response of the inter-national community
E. Patterns and trends in production of, and trade and trafficking in precursor chemicals
F. Key precursors used in the illicit manufacture of drugs
G. Effect of precursor control on the supply of illicit drugs
H. Reactions of clandestine operators facing stronger precursor controls
I. Concluding remarksANNEX I
Tables on drug cultivation, production and eradication and prevalenceANNEX II
Regional groupings
PREFACE
The World Drug Report 2014 is aimed at helping the international community to address the toll that illicit drug production, trafficking and consumption continues to take on all our societies, by providing a global overview and analysis of developments, based on the best available data.
The report is being published at a key moment in the global debate on the world drug problem. A high-level review of the implementation of the Political Declaration and Plan of Action on International Cooperation towards an Integrated and Balanced Strategy to Counter the World Drug Problem was conducted in March 2014 in Vienna by the Commission on Narcotic Drugs, followed by a regular session of the Commission. These meetings provided contributions to a special session of the General Assembly on the world drug problem, which will be held in 2016. The high-level review was more than a stocktaking exercise; it provided a much-needed forum for an open, inclusive dialogue, involving not just Governments but also the scientific community, civil society and young people, on the most effective ways to counter the world drug problem.
Efforts to date to implement the Political Declaration and Plan of Action have resulted in some considerable successes, including sustainable reductions in illicit drug cultivation through alternative development initiatives and welcome improvements in treatment delivery. There have also undeniably been serious setbacks, however, not least the surge in
In addition, for the first time the report presents joint estimates by the United Nations Office on Drugs and Crime (UNODC), the World Health Organization, the Joint United Nations Programme on HIV/AIDS (UNAIDS) and the World Bank on the number of people who inject drugs and the number of people who inject drugs and are living with HIV. I welcome these cooperative efforts, which are very much in the spirit of "One United Nations" and can help opium cultivation and production in Afghanistan, the violence associated with the illicit drug trade, and the growing instability of regions, including West and East Africa, that are already vulnerable to trafficking and to rising levels of local production and use of illicit drugs.
It is clear from the discussions at the high-level review, and from the findings of the present report, that there are no simple answers to these problems. Nevertheless, the lessons we have learned are valuable and we have attained a shared understanding of a way forward.
First and foremost, we have learned that sustainable success requires a balanced, cooperative, comprehensive and integrated approach, addressing both supply and demand. This was emphasized in the Joint Ministerial Statement resulting from the High Level Review, in which governments reaffirmed the international drug conventions as the health and human rights-centred cornerstone of the drug control system, and pledged to strengthen cooperation.
A balanced approach relies on evidence-based responses, with a firm emphasis on public health, and includes measures focusing on prevention, treatment and social rehabilitation and integration.
There remain serious gaps in service provision, with only one in six problem drug users accessing drug dependence treatment services each year. The new set of data on access to services presented in the World Drug Report this year can support Member States in addressing this crucial area more effectively.
countries to address the discrimination that continues to hinder access to HIV prevention, treatment and care services, particularly for people who use drugs and for those in prison. As the chair of the UNAIDS Committee of Cosponsoring Organizations this year, UNODC is committed to ensuring evidence-informed HIV interventions for all key populations. We have seen that countries that have adequately invested in harm reduction services have lowered remarkably HIV transmission among people who inject drugs.
The World Drug Report 2014 also addresses another important area, namely the results achieved and the challenges the international community continues to face in controlling precursors. All drugs, whether plant-based or synthetic, require chemicals for their manufacture or processing. An international control system facilitating the legal trade of such chemicals while avoiding their diversion must be very robust, particularly as we continue to see rises in the manufacture and trafficking of synthetic drugs, which cannot be controlled through traditional supply reduction approaches such as crop eradication.
Changes in the international manufacture and trade of chemicals present challenges. Evidence shows, however, that measures to control precursor chemicals have had a tangible impact in reducing their diversion for illicit manufacturing of drugs, and this must remain a key supply control strategy. The work of the International Narcotics Control Board and its cooperative mechanisms is central in this regard. The international drug conventions entrust the Board with assessing the implementation of measures to control precursors at the international level and supporting countries to strengthen efforts to prevent diversion.
More broadly, we must continue to enhance international cooperation, including with respect to transparent sharing of data and analysis, to help us better understand the drug problem and address the many challenges, including the related issues of violence and insecurity. This is particularly important as we move towards the special session of the General Assembly on the world drug problem in 2016. I hope the World Drug Report 2014 will serve as a tool in these efforts, providing evidence to support the international community in devising more effective policies and finding joint solutions.
Yury Fedotov
Executive Director
United Nations Office on Drugs and Crime
EXPLANATORY NOTES
The boundaries and names shown and the designations used on maps do not imply official endorsement or acceptance by the United Nations. A dotted line represents approximately the line of control in Jammu and Kashmir agreed upon by India and Pakistan. The final status of Jammu and Kashmir has not yet been agreed upon by the parties. Disputed boundaries (China/India) are represented by cross hatch due to the difficulty of showing sufficient detail.
The designations employed and the presentation of the material in this publication do not imply the expression of any opinion whatsoever on the part of the Secretariat of the United Nations concerning the legal status of any country, territory, city or area or of its authorities, or concerning the delimitation of its frontiers or boundaries.
Countries and areas are referred to by the names that were in official use at the time the relevant data were collected.
Since there is some scientific and legal ambiguity about the distinctions between "drug use", "drug misuse" and "drug abuse", the neutral terms "drug use" and "drug consumption" are used in this report.
The data on population used in this report are from: United Nations, Department of Economic and Social Affairs, Population Division, World Population Prospects: The 2012 Revision.
References to dollars ($) are to United States dollars, unless otherwise stated.
When referring to drug use, all mentions of amphetamine-type stimulants exclude "ecstasy".
References to "tons" are to metric tons, unless otherwise stated.
The following abbreviations have been used in this Report:
APAAN alpha-phenylacetoacetonitrile ATS amphetamine-type stimulants BMK benzyl methyl ketone CICAD Inter-American Drug Abuse Control Commission (Organization of American States) EMCDDA European Monitoring Centre for Drugs and Drug Addiction Europol European Police Office FAO Food and Agriculture Organization of the United Nations GDP gross domestic product INCB International Narcotics Control Board ISIC International Standard Industrial Classification INCSR International Narcotics Control Strategy Report, of the United States State Department LSD lysergic acid diethylamide MDA 3,4-methylenedioxyamphetamine MDMA 3,4-methylenedioxymethamphetamine 3,4-MDP-2-P 3,4-methylenedioxyphenyl-2-propanone NSDUH National Survey on Drug Use and Health of the Substance Abuse and Mental Health Services Administration of the Department of Health and Human Services of the United States of America P-2-P 1-phenyl-2-propanone PEN Online Pre-Export Notification Online PICS Precursors Incident Communication System PMK piperonyl methyl ketone PWID people who inject drugs UNAIDS Joint United Nations Programme on HIV/AIDS UN COMTRADE United Nations Commodity Trade Statistics database UNIDO United Nations Industrial Development Organization UNODC United Nations Office on Drugs and Crime WHO World Health Organization
EXECUTIVE SUMMARY
The World Drug Report provides an annual overview of the major developments in drug markets for the various drug categories, ranging from production to trafficking, including development of new routes and modalities, as well as consumption. Chapter 1 of the World Drug Report 2014 provides a global overview of the latest developments with respect to opiates, cocaine, cannabis and amphetamines (including "ecstasy") and the health impact of drug use. Chapter 2 zeroes in on the control of precursor chemicals used in the manufacture of illicit drugs.
On the basis of comprehensive information on supply, as well as the relatively limited new information on demand, it can be concluded that overall the global situation with regard to the prevalence of illicit drug use and problem drug use |1| is generally stable, with the total global number of drug users increasingly commensurate with the growth of the world population.
That said, each region exhibits its own peculiarities with respect to specific drugs. Polydrug use, which is generally understood as the use of two or more substances at the same time or sequentially, remains a major concern, both from a public health and a drug control perspective.
Drug use and its health and social consequences
Drug use continues to exact a significant toll, with valuable human lives and productive years of many persons being lost. An estimated 183,000 (range: 95,000-226,000) drug-related deaths were reported in 2012. That figure corresponds to a mortality rate of 40.0 (range: 20.8-49.3) deaths per million among the population aged 15-64. While that estimate is lower than for 2011, the reduction can be ascribed to the lower number of deaths reported in a few countries in Asia.
Globally, it is estimated that in 2012, between 162 million and 324 million people, corresponding to between 3.5 per cent and 7.0 per cent of the world population aged 15-64, had used an illicit drug -- mainly a substance belonging to the cannabis, opioid, cocaine or amphetamine-type stimulants group -- at least once in the previous year.
The extent of problem drug use -- by regular drug users and those with drug use disorders or dependence -- remains stable at between 16 million and 39 million people. However, there continues to be a gap in service provision, as in recent years, only one in six problem drug users globally have had access to or received drug dependence treatment services each year.
Although the general public may perceive cannabis to be the least harmful illicit drug, there has been a noticeable increase in the number of persons seeking treatment for cannabis use disorders over the past decade, particularly in the Americas, Oceania and Europe. Nonetheless, opiates remained the most prevalent primary drug of abuse among those seeking treatment in Asia and in Europe, as did cocaine in the Americas.
With regard to injecting drug use, the United Nations Office on Drugs and Crime (UNODC), the Joint United Nations Programme on HIV/AIDS (UNAIDS), the World Bank and the World Health Organization (WHO), drawing on the most recent data available, jointly estimate that the number of people who inject drugs is 12.7 million (range: 8.9 million-22.4 million). That corresponds to a prevalence of 0.27 per cent (range: 0.19-0.48 per cent) of the population aged 15-64. |2| The problem is particularly stark in Eastern and South-Eastern Europe, where the rate of injecting drug use is 4.6 times higher than the global average.
The sharing of used injecting equipment makes people who inject drugs particularly vulnerable to HIV and hepatitis C. It is estimated that an average of 13.1 per cent of the total number of people who inject drugs are living with HIV. UNODC, the World Bank, WHO and UNAIDS jointly arrived at a global estimate of the number of people who inject drugs living with HIV of 1.7 million persons (range: 0.9-4.8 million). That situation is particularly pronounced in two regions of the world: South-West Asia and Eastern/ South-Eastern Europe, where it is estimated that the prevalence of HIV among people who inject drugs is 28.8 and 23.0 per cent, respectively. More than half of the people who inject drugs are estimated to be living with hepatitis C.
Addressing HIV among people who inject drugs, through the implementation of an evidence-based comprehensive package of nine interventions, |3| as a component of what is also known as "harm reduction services", is a major component of the global response to stop the spread of HIV. Of them, the four most effective interventions for HIV prevention, treatment and care are needle and syringe programmes, opioid substitution therapy (or other evidence-based drug dependence treatment in the case of people who inject non-opioid drugs), HIV testing and counselling, and antiretroviral therapy.
The coverage of the four most effective interventions is greatest in Western and Central Europe, where harm reduction interventions have been scaled up for more than a decade, leading to a decline in the number of newly diagnosed cases of HIV among people who inject drugs and of AIDS-related deaths attributed to unsafe injecting drug use. However, recent outbreaks of HIV among people who inject drugs in parts of Europe demonstrate how the HIV epidemic situation can change very rapidly in areas where services and interventions are scaled down.
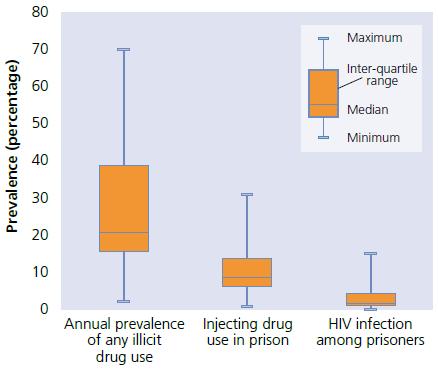
It is well documented that a very high percentage of people who inject drugs have a history of imprisonment. Also, both drug use and injecting drug use are highly prevalent among prison populations. The lack of access to and availability of health care, especially drug dependence treatment and HIV prevention, treatment and care services in prisons, is of major concern, since the prison population, at a minimum, should have access to services equivalent to those available to the general public. For instance, in Europe, the proportion of prisoners who had used an illicit substance during incarceration ranged from 4-56 per cent.
In Europe, the financial crisis seems to have had an impact on drug use modalities, with related health and social consequences. While there are no comprehensive data available yet, two phenomena seem to have emerged in parts of Europe that have appeared in parallel to the financial crisis. First, there appears to be a shift in the pattern of drug use which sometimes results in a higher risk of harm; and secondly, there has been a reduction in coverage of harm reduction services, which, according to recently published research, has increased the likelihood of unsafe injecting behaviour, thus influencing the spread of infections such as HIV and hepatitis C.
Drug profiles by category
Opiates
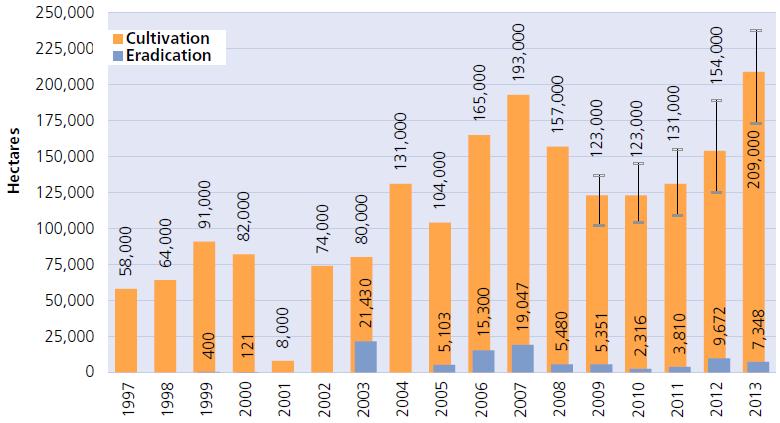
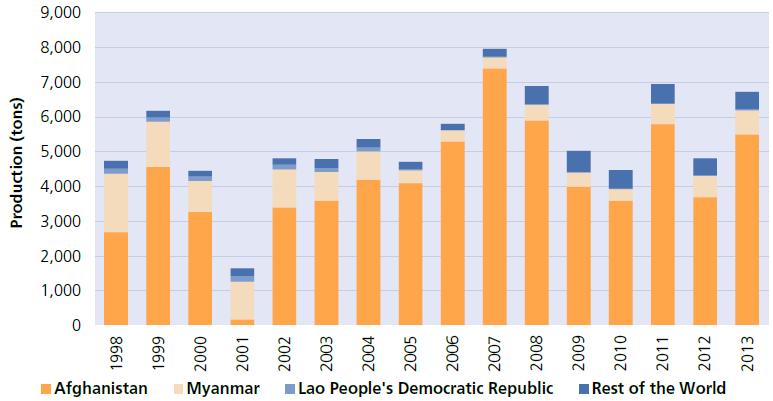
Opiates and opioids top the list of problem drugs that cause the most burden of disease and drug-related deaths worldwide. For the third consecutive year, Afghanistan, which has the world's largest opium poppy cultivation, saw an increase in the area under cultivation (from 154,000 hectares in 2012 to 209,000 hectares in 2013). In addition, Myanmar witnessed expansion in the area of opium poppy cultivation, although less pronounced. In 2013, the estimated global production of heroin rebounded to the levels seen in 2008 and 2011.
The global area of illicit opium cultivation in 2013 stood at 296,720 hectares -- the largest area since 1998, when estimates became available.
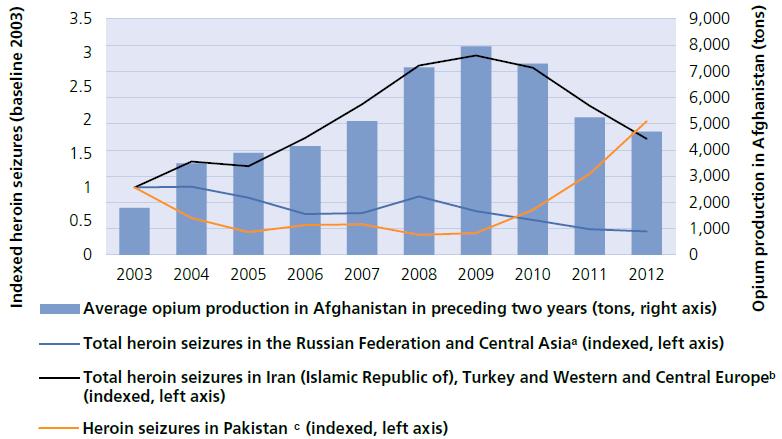
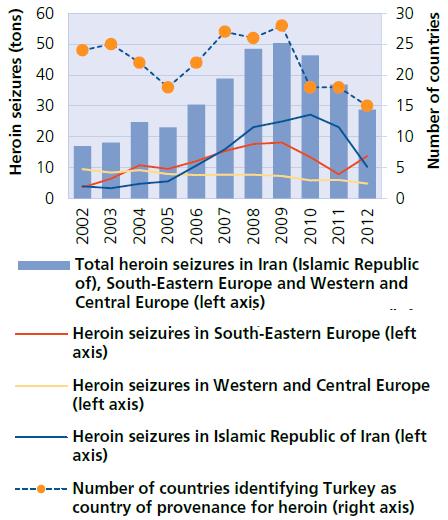
There is evidence that Afghan heroin is increasingly reaching new markets, such as Oceania and South-East Asia, that had been traditionally supplied from South-East Asia. The long-established Balkan route seems to remain a corridor for the transit of Afghan heroin to the lucrative markets in Western and Central Europe, but its importance has declined due to various factors such as more effective law enforcement and a shrinking market in Western and Central Europe, as seen by the decline in opiate use and seizures in the subregion and the reduced level of supply compared with the peak levels of 2007.
The so-called "southern route" is expanding, with heroin being smuggled through the area south of Afghanistan reaching Europe, via the Near and Middle East and Africa, as well as directly from Pakistan.
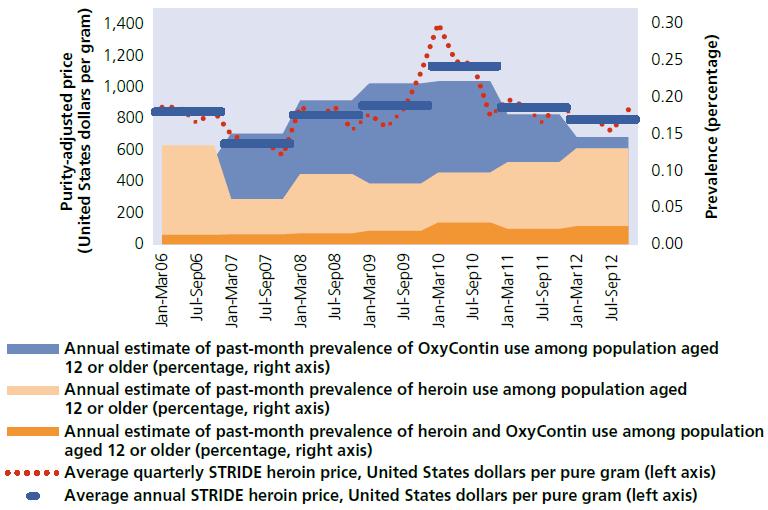
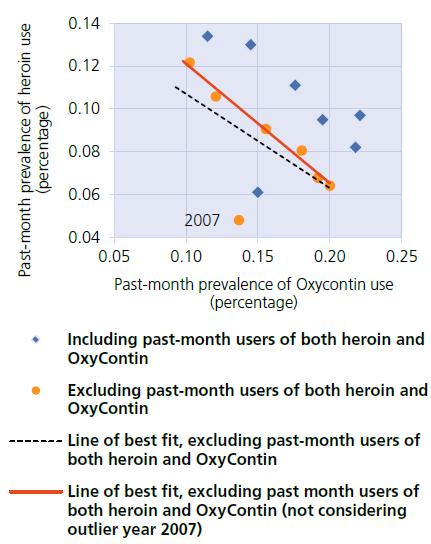
An emerging phenomenon among opioid-dependent drug users in the United States of America is that synthetic opioids are being replaced with heroin, driven by the increased availability of heroin in parts of the United States, and lesser costs to regular users to maintain their dependency. Further, the reformulation of one of the main prescription pharmaceuticals abused, OxyContin, now makes it more difficult to snort or inject it.
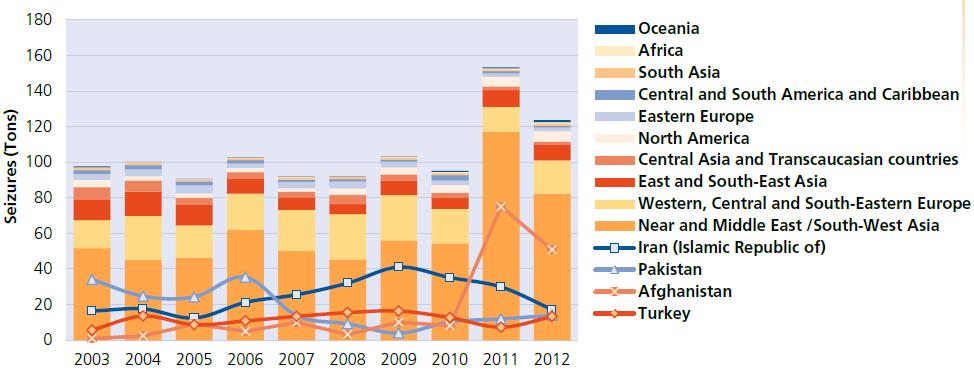
Following a sharp increase in 2011, global seizures of heroin and illicit morphine declined in 2012, while remaining higher than the levels of 2010 and prior years. The fluctuations were mainly driven by seizures in SouthWest Asia and Western and Central Europe. However, in 2012, there was an increase in heroin seizures in many other regions, mainly Eastern and South-Eastern Europe, South Asia and Oceania. Significantly, heroin seizures, and therefore presumably the flow of heroin, in key countries located along the "northern route" from Afghanistan to the Russian Federation, have gone down. At the same time, there is evidence of a significant number of small seizures of home made desomorphine, which is likely serving as a substitute for heroin.
The emergence of potentially more harmful behaviour, including the abuse of opioids such as fentanyl, has been noted among opioid-dependent persons in Estonia, Finland and the United States. It has been observed that opioid users may alternate between pharmaceutical and/ or prescription opioids and heroin, depending on which substance is more available, accessible and cheaper in the market.
Cocaine
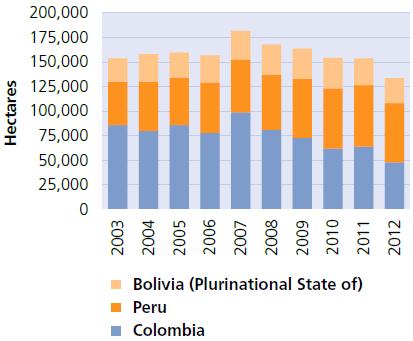
While cocaine manufacture and trafficking have had a serious impact in the Western hemisphere, there are indications that overall global availability of cocaine has fallen. The estimated net area under coca bush cultivation as of 31 December 2012 was the lowest since the beginning of available estimates in 1990: 133,700 hectares, a decline of 14 per cent from the estimate for 2011.
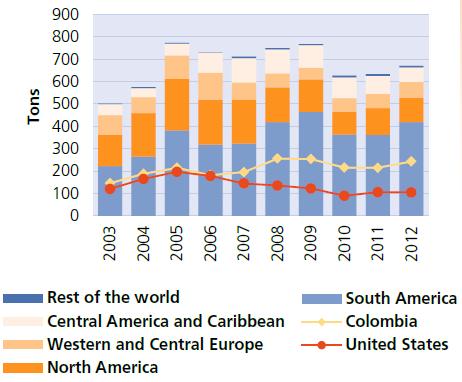
Global cocaine seizures increased to 671 tons in 2012, compared with the 634 tons seized in 2011. The main increase in the quantities of cocaine seized were in South America and Western and Central Europe.
Cocaine use is still relatively concentrated in the Americas, Europe and Oceania, and practically all of the world's cocaine is produced in three countries in South America. While there is no conclusive evidence with respect to the extent of cocaine use in Africa and Asia, expert opinion indicates that there may be pockets of emerging cocaine use in those two regions, related to the rise in trafficking through Africa and increased affluence in both continents.
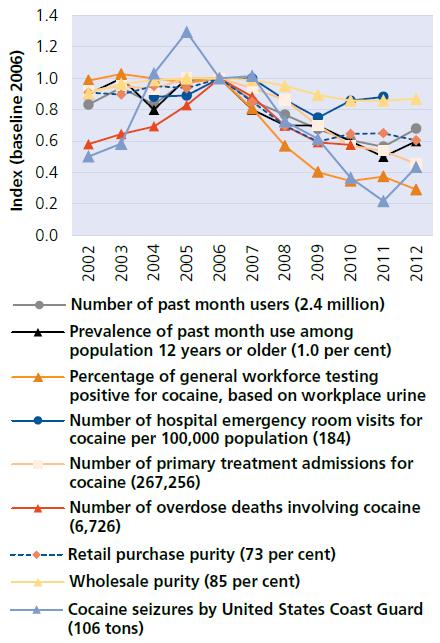
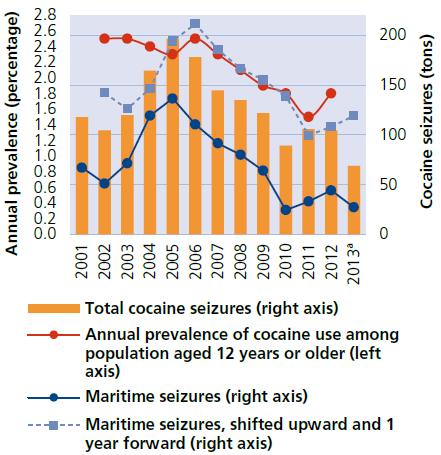
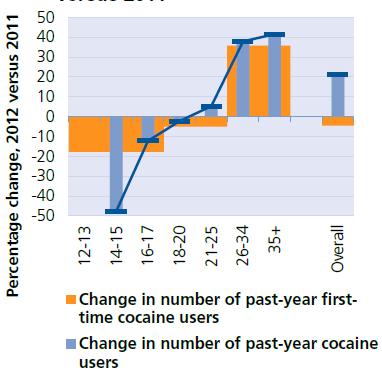
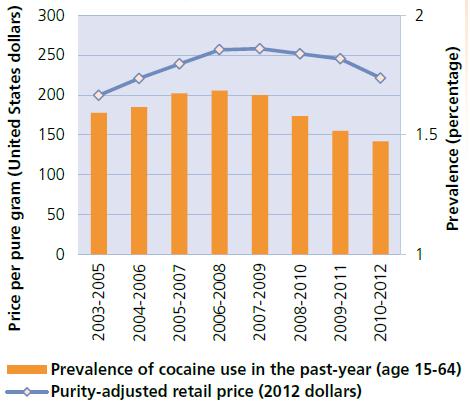
The most problematic use of cocaine is in the Americas. In North America, cocaine use has been declining since 2006, partly due to a sustained shortage. However, more recently, a slight increase in prevalence has been observed in the United States, as has an increase in maritime seizures.
In South America, cocaine consumption and trafficking have become more prominent, particularly in Brazil due to factors including its geographical location and a large urban population.
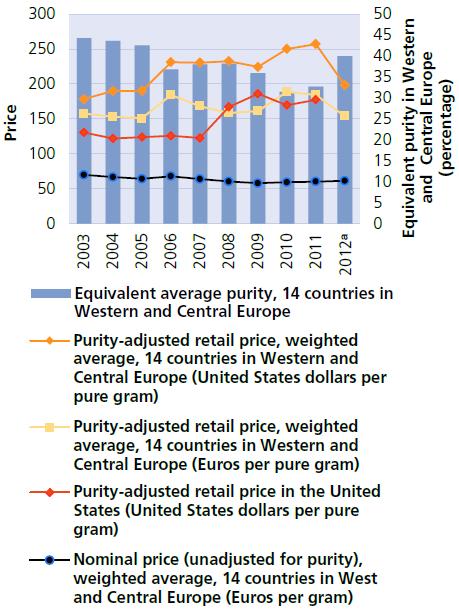
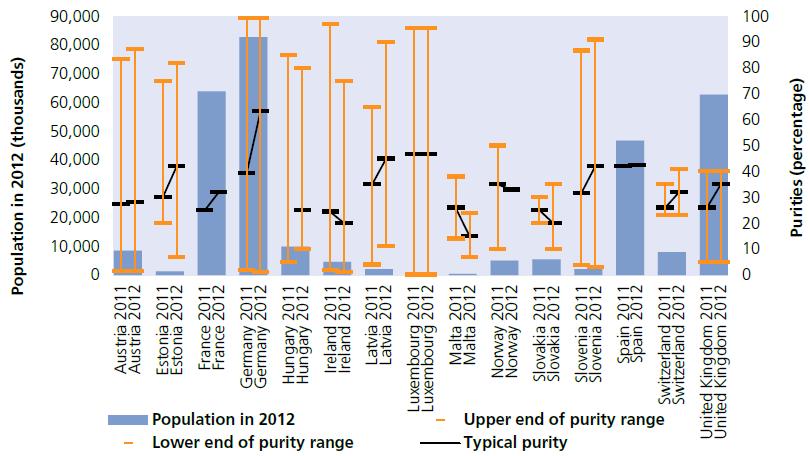
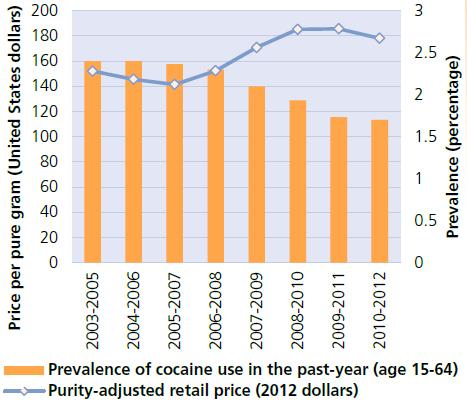
In Western and Central Europe, the second largest market after the Americas, indicators of overall supply suggest a possible rebound in the availability of cocaine; retail purity has increased in some countries with sizable consumer markets. On the other hand, they do not show an increase in demand. There has even been a decline in cocaine use in some of the countries that have had higher levels of use.
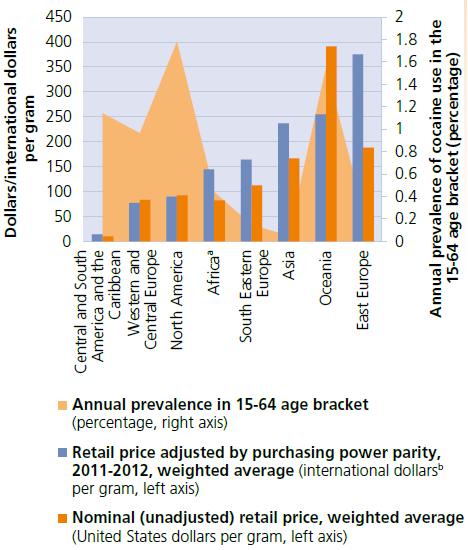
The market has expanded in Oceania in recent years, but the region has a different pattern of use compared with other consumer markets because it has a large body of users (a high prevalence) who use the substance with low frequency, perhaps due to the high price of cocaine.
Cannabis
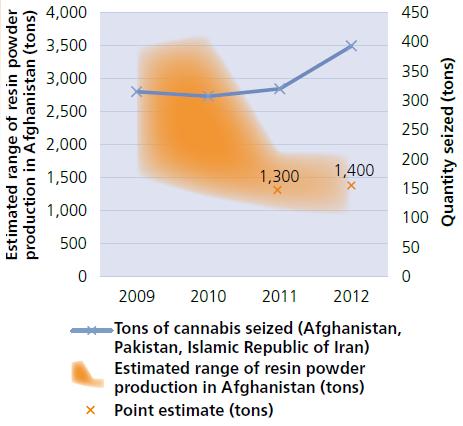
Cultivation and production of cannabis herb ("marijuana") remains widespread, while production of cannabis resin ("hashish") remains confined to a few countries in North Africa, the Middle East and South-West Asia. In Afghanistan, despite the fact that the area under cannabis cultivation has been decreasing, the potential cannabis resin production in 2012 was higher than in 2011 due to the greater yield per hectare.
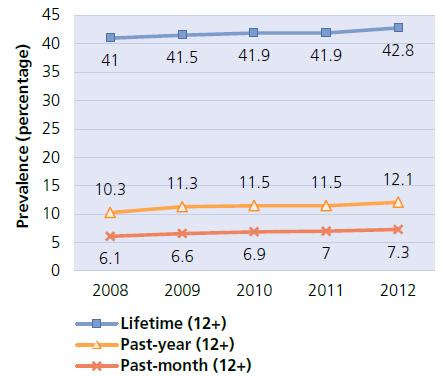
Global cannabis use seems to have decreased, essentially reflecting a decrease in cannabis use estimates reported by a number of countries in Western and Central Europe. However, in the United States, the lower perceived risk of cannabis use has led to an increase in its use. At the same time, more people using cannabis are seeking treatment each year.
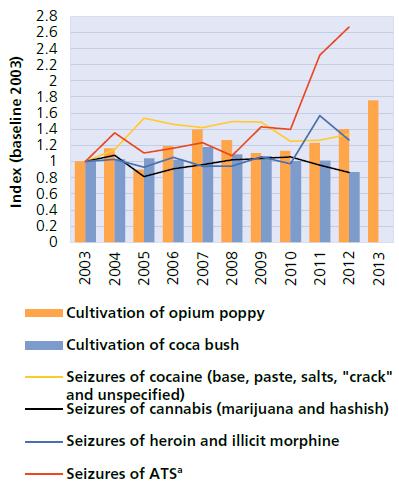
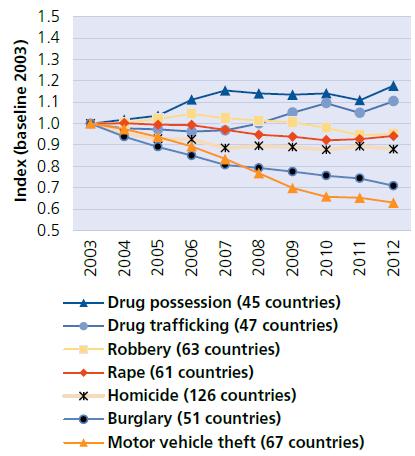
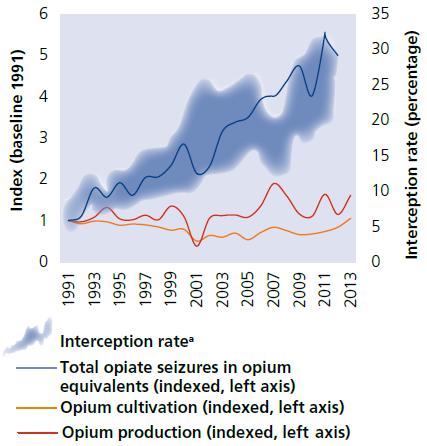
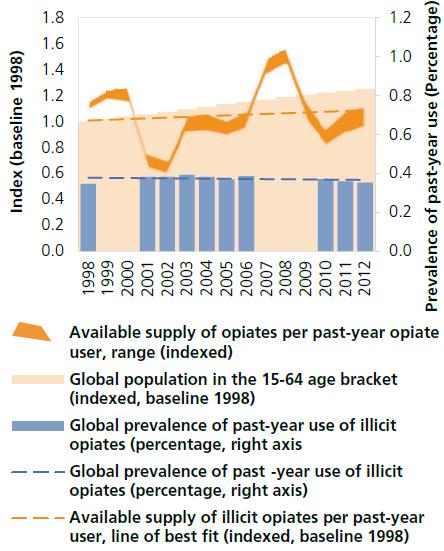
Trend in main indicators of drug supply and drug supply reduction, 2003-2013
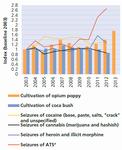
Click to enlargeSource: Seizure data: annual report questionnaire supplemented by other official sources.
Cultivation data: UNODC estimates based on national illicit crop monitoring systems supported by UNODC supplemented by other official data.
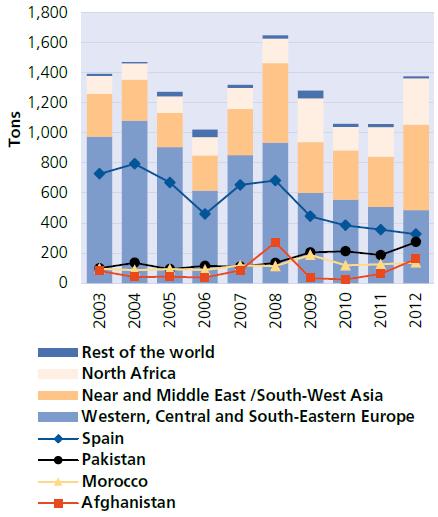
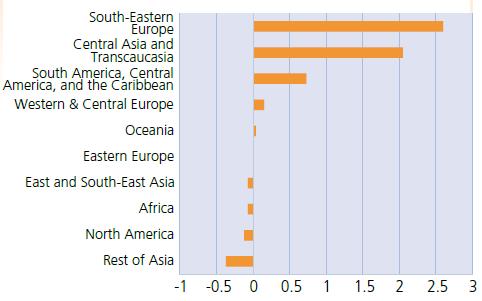
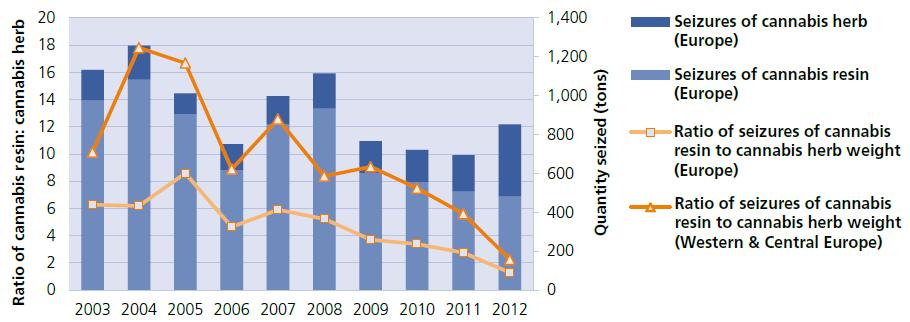
a Including amphetamine, "ecstasy"-type substances, methamphetamine, non-specified ATS, other stimulants and prescription stimulants. For the categories of other stimulants and prescription stimulants, seizures reported by weight or volume only are included.In Europe, the market has changed over the past decade, with cannabis herb produced locally or regionally now gaining ground over cannabis resin, largely sourced from Morocco, which previously was the dominant cannabis substance in Europe, as evidenced by seizure data.
New regulatory frameworks in the States of Colorado and Washington in the United States and in Uruguay now make the recreational use of cannabis legal under some restrictions. The new laws also include provisions for the supply chain, including both licensed and personal cultivation. It is too early to understand the impact of these changes on recreational and problematic use of cannabis and in the broad range of areas that they may affect, including health, criminal justice, and public revenues and expenditures. It will take years of careful monitoring to understand the broader effects of those novel regulatory frameworks in order to inform future policy decisions.
Based on existing research, it can be argued that with declining risk perception and increased availability, use and youth initiation may increase. Tax revenues from retail cannabis sales are expected to provide public revenue. However, expected revenue will need to be cautiously weighed against the costs of prevention and health care.
Amphetamine-type stimulants
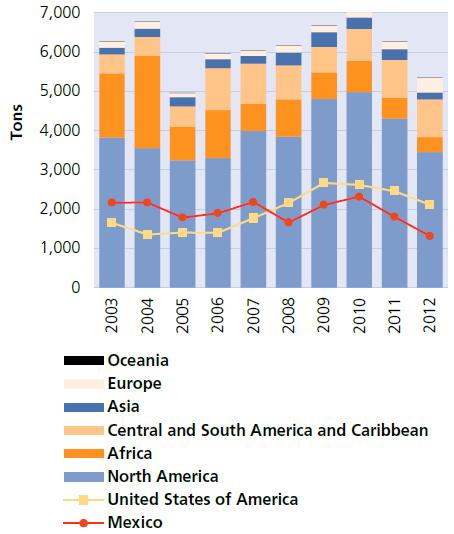
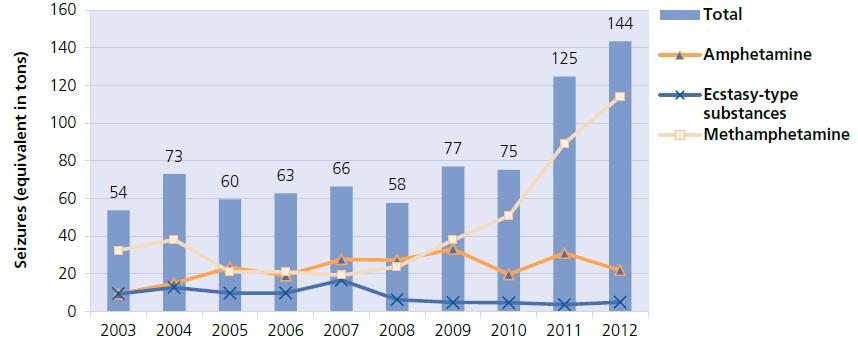
While it is difficult to quantify the global manufacture of amphetamine-type stimulants, the number of dismantled laboratories manufacturing amphetamine-type stimulants, which were mostly manufacturing methamphetamine, continued to rise. Manufacture of methamphetamine in North America expanded once again, with a large increase in the number of methamphetamine laboratories reported dismantled in the United States and Mexico.
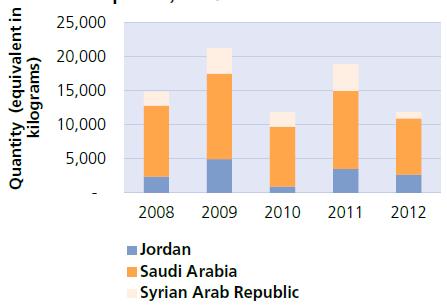
Of the total of 144 tons of amphetamine-type stimulants seized globally, half were seized in North America and a quarter in East and South-East Asia. Large quantities of amphetamine seizures continue to be reported in the Middle East, in particular in Jordan, Saudi Arabia and the Syrian Arab Republic.
Central and South-West Asia are emerging as new markets, with low levels of methamphetamine seizures and use being reported by two countries in those subregions. South-West Asia has also emerged as a significant production area for methamphetamine destined for East and South-East Asia. Production in West and Central Africa is also emerging.
Seizures of "ecstasy" increased in 2012, with major quantities of "ecstasy" being seized in East and South-East Asia, followed by Europe (South-Eastern and Western and Central Europe), which together accounted for over 80 per cent of global seizures of "ecstasy".
The misuse of prescription stimulants or medications for attention-deficit hyperactivity disorder (ADHD) is not uncommon, although only a few countries report any prevalence of misuse among the general and youth population. Although misuse of prescription stimulants in other regions is not negligible, such abuse is reported mainly by countries in North and South America.
New psychoactive substances and web-based marketplaces
While the Internet continues to be used as a means of drug trafficking and illicit trade in precursor chemicals, use of the so-called "dark net" has been growing. The "dark net" constitutes a virtual marketplace, which is inaccessible by web search, and where it is difficult for law enforcement authorities to identify website owners and users, as their identities remain hidden by means of sophisticated concealment methods. That makes the "dark net" a safe haven for buyers and sellers of illicit drugs, who trade principally in a digital currency (Bitcoin).
While the overall proportion of drug transactions that take place in the "dark net" is unclear, the value of transactions, as well as the range of drugs available, appears to be growing. The dismantling of one prominent "dark net" site, the "Silk Road", uncovered that the site had approximately $1.2 billion worth of total revenue from two to five years of operations. There is evidence of a niche market on the "dark net" for new psychoactive substancesas well as for high-quality cannabis, heroin, methylenedioxymetham-phetamine (MDMA) and cocaine.
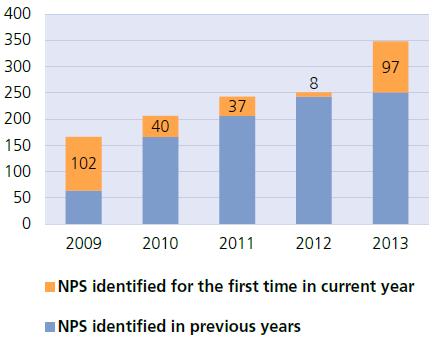
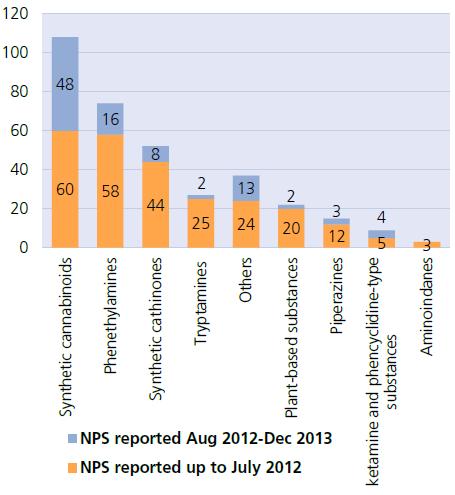
Finally, the proliferation of new psychoactive substances continues to pose a challenge, with the number of new psychoactive substances (348 such substances in December 2013, up from 251 in July 2012) clearly exceeding the number of psychoactive substances controlled at the international level (234 substances).
Drug-related crime
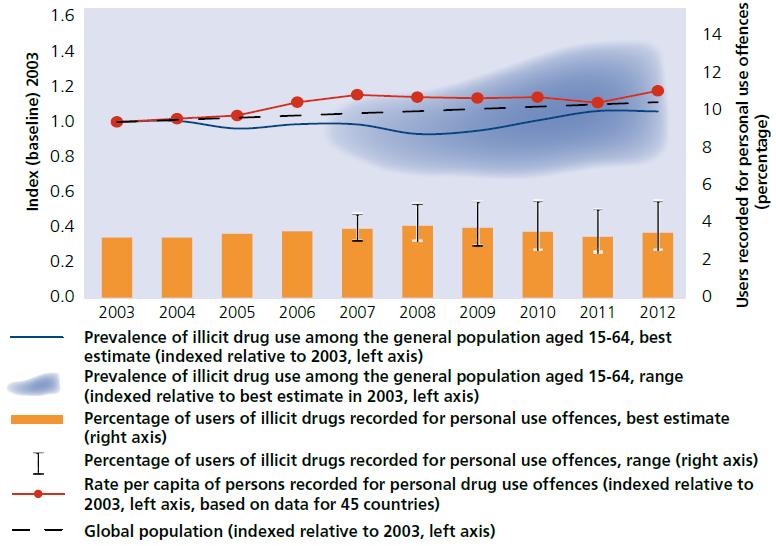
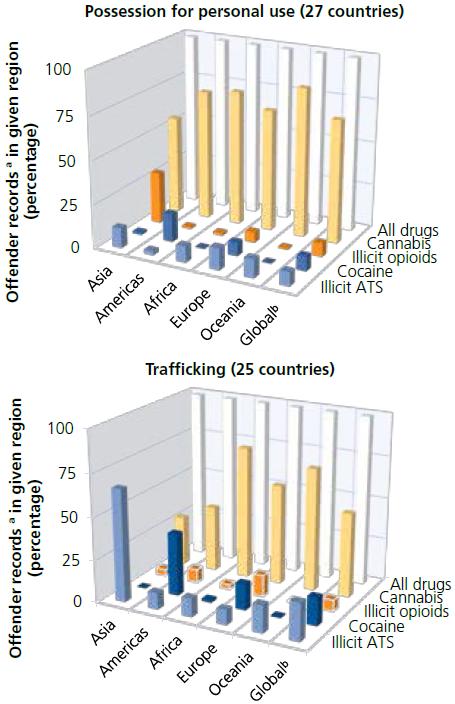
Crime recorded by the authorities in relation to personal use and trafficking of drugs assessed separately has shown an increase over the period 2003-2012, in contrast to the general declining trend in property-related and violent crime. However, the proportion of drug offenders who were drug users with recorded offences for personal use has remained stable, given the increased number of users during that period. Worldwide, the large majority of drug use offences are associated with cannabis.
Crime related to drug trafficking varies depending on the type of drug and the supply patterns involved in different regions.
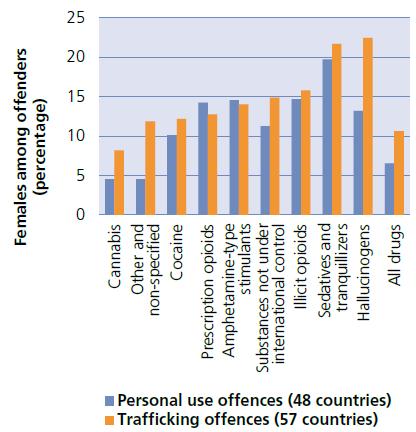
The majority of persons arrested for or suspected of drug offences are men; the involvement of women in drug offences varies according to drug type, reflecting the drugs of preference among women. The highest percentage of women arrestees or suspects can be observed in relations to crimes involving sedatives and tranquillizers (25 per cent).
Precursor control
Most drugs, whether plant-based or synthetic, require chemicals to transform them into the final product. While chemicals are only one of the components required for the clandestine manufacture of plant-based drugs (heroin and cocaine), they constitute the essential components of illicitly manufactured synthetic drugs.
Given the growing manufacture of synthetic drugs, the control of such chemicals, known as precursors, has emerged as a key supply control strategy because the traditional approaches, such as eradication of illicit crops and alternative development, cannot be applied to synthetic drugs.
There are potential vulnerabilities in the structure of and trends in the production of and trade in chemicals that are used in the illicit manufacture of drugs. The international community has, over the years, strenghtened a control system aimed at enabling the legal trade of such chemicals while preventing their diversion into illicit manufacture.
Some successes have been achieved in precursor control, but they have prompted a range of reactions from the traffickers and manufacturers of illicit drugs, which create new challenges for the international drug control system.
Vulnerabilities of the chemical industry to diversion of precursors
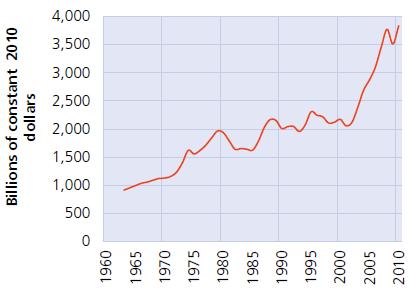
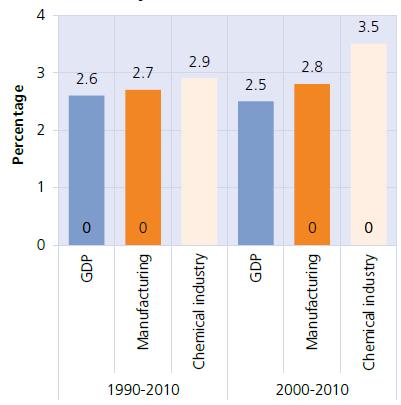
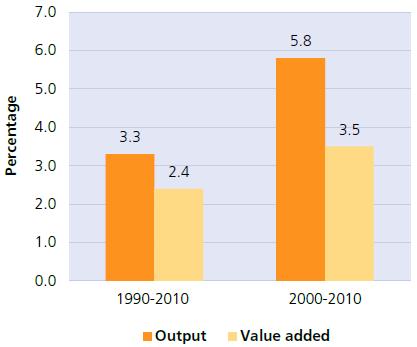
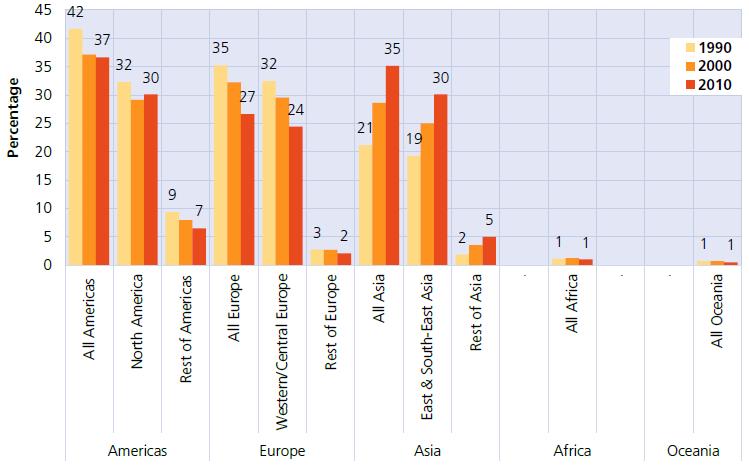
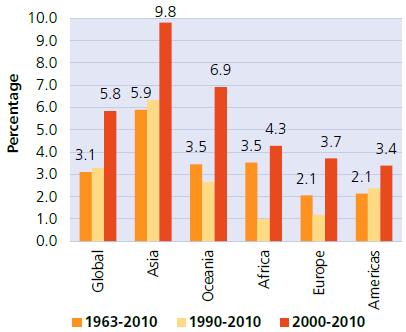
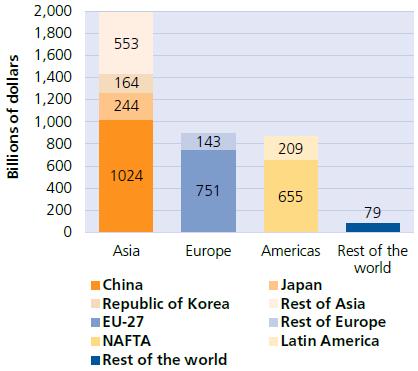
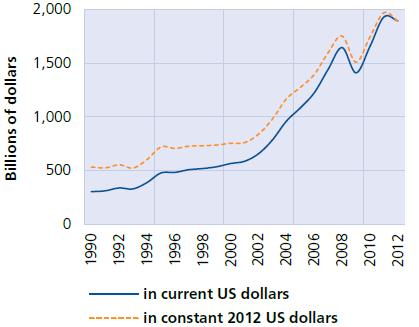
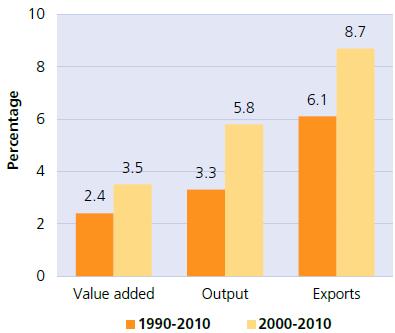
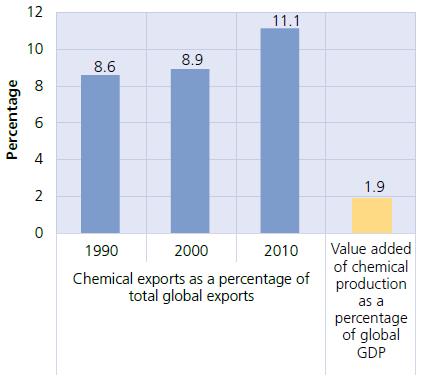
The chemical industry has seen strong growth rates and geographical shifts over the past few decades, notably the past two decades, when global production doubled and trade more than tripled. Also during that period, the bulk of production shifted to Asia, where the emerging chemical industry is now characterized by a sizeable cluster of small competing enterprises. In contrast to the past situation, when the chemical industry was dominated by large, vertically integrated conglomerates, these new developments have made the chemical industry potentially more vulnerable to the diversion of precursors.
Moreover, with more and more chemicals being traded across borders, a greater number of transit countries and the emergence of a number of chemical brokers and other intermediaries, the potential avenues for diversion of precursors to the clandestine manufacture of drugs have been increasing.
Response by the international community
Precursor control emerged as one of the key pillars of international drug control in the United Nations Convention against Illicit Traffic in Narcotic Drugs and Psychotropic Substances of 1988. The Convention sets out specific measures for the manufacture and distribution of and international trade in a number of chemicals frequently used in the manufacture of drugs. These are listed under two categories: the more strictly controlled substances in Table I and the relatively less controlled substances in Table II. The 1988 Convention entrusts the International Narcotics Control Board with the implementation of precursor control at the international level.
The system has been further enhanced by means of a number of resolutions adopted by the United Nations Commission on Narcotic Drugs, the Economic and Social Council and the General Assembly, as well as the Political Declaration adopted by the General Assembly at its twentieth special session, in 1998, and the Political Declaration and Plan of Action on International Cooperation towards an Integrated and Balanced Strategy to Counter the World Drug Problem, adopted by the General Assembly in 2009, including their related action plans. As of December 2013, 23 substances were under international control: 15 substances in Table I and 8 substances in Table II of the 1988 Convention. In March 2014, the Commission on Narcotic Drugs decided to schedule alpha-phenylacetoacetonitrile (APAAN) in Table I of the Convention.
Production and trade of precursor chemicals
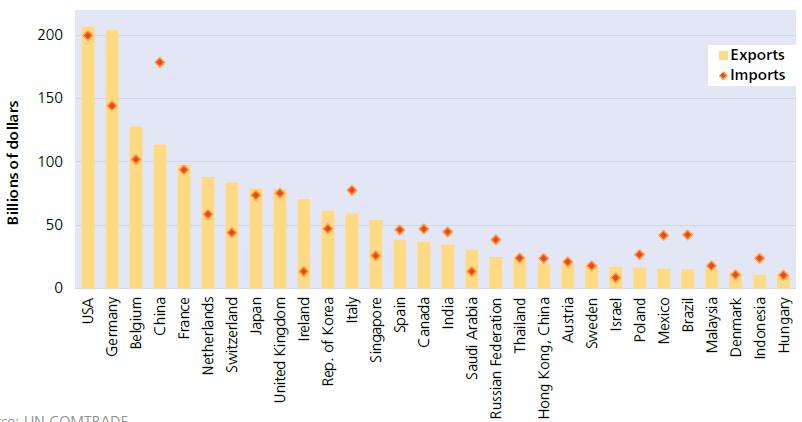
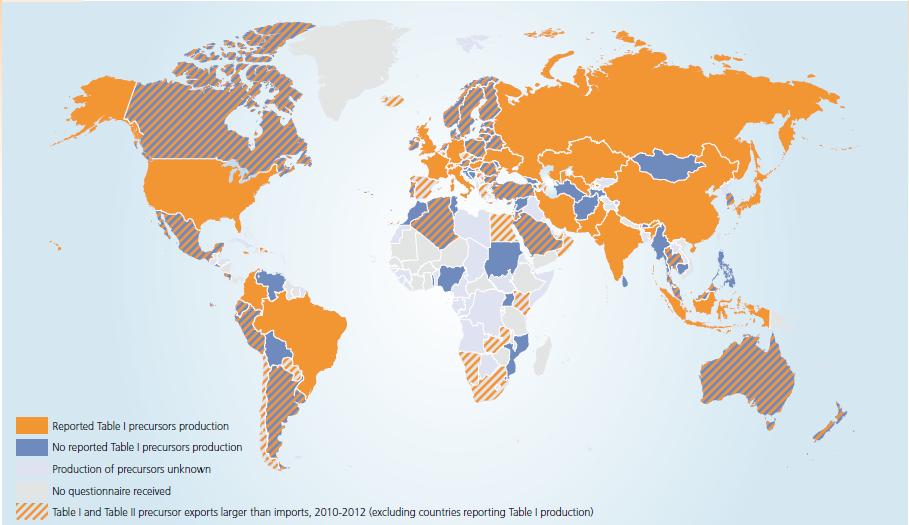
There is licit use and licit trade of precursors, and control includes the monitoring of the licit trade while preventing diversion. Through the analysis of information provided by countries to UNODC and international trade statistics, it can be concluded that over the period 2010-2012, some 77 countries were engaged in the manufacture of precursor chemicals.
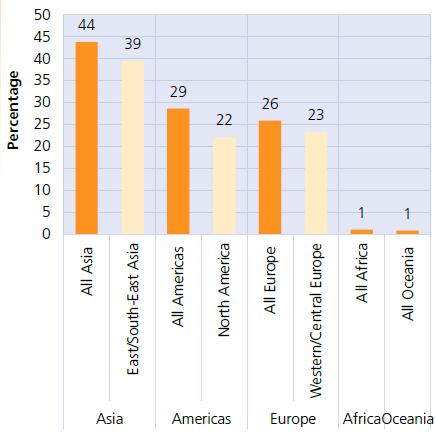
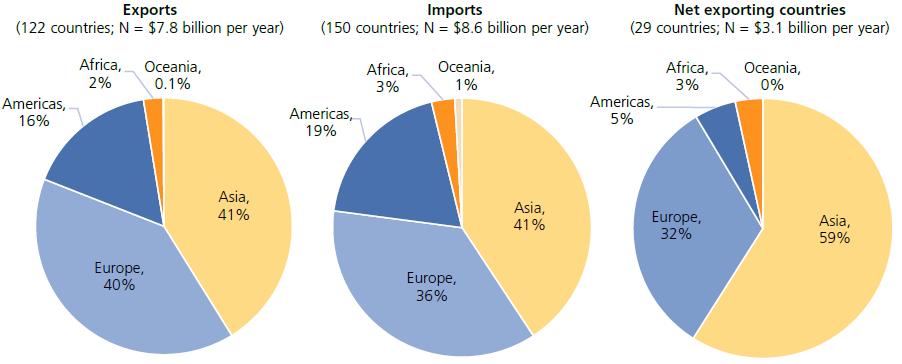
A much larger number of countries were involved in trade in precursors. 122 countries reported exports of precursor chemicals over the period 2010-2012, while 150 countries reported imports. The largest exports of precursors were reported by countries in Asia, followed by Europe and the Americas. If only net exporting countries of precursor chemicals are considered, Asian countries account for 59 per cent of total net exports over the 2010-2012 period. Global exports in precursor chemicals rose at a rate similar to that of chemicals in general.
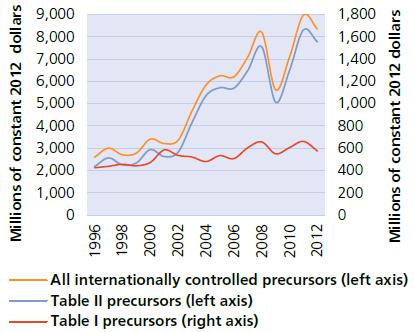
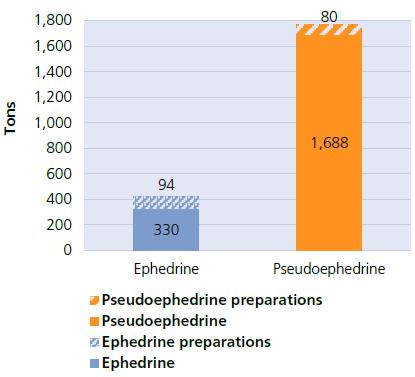
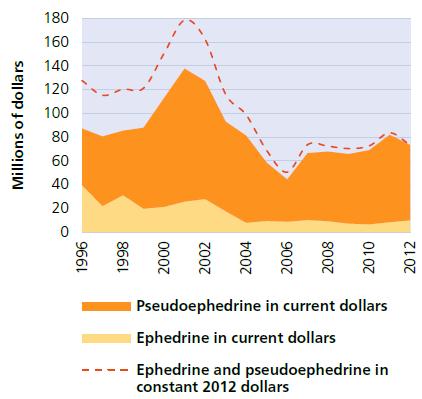
The licit requirements for and applications of various precursors differ from country to country. The bulk (93 per cent) of the international trade in precursor chemicals, in terms of economic value, is of substances listed in Table II of the 1988 Convention. In 2012, the more strictly controlled substances in Table I accounted for only 7 per cent of international trade in precursor chemicals, or 0.04 per cent of overall international trade in chemicals, and their export growth has been far lower than for Table II substances. The most important Table I substances, in economic terms, are acetic anhydride, used in the manufacture of heroin, followed by potassium permanganate, used in the manufacture of cocaine, and pseudoephedrine, used in the manufacture of methamphetamine.
The illicit trade in precursor chemicals cannot be quantified as easily as can the licit market, but information on seizures can provide some partial information on trends.
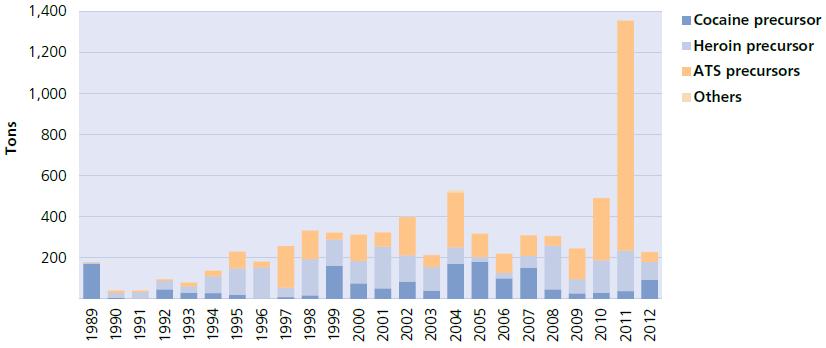
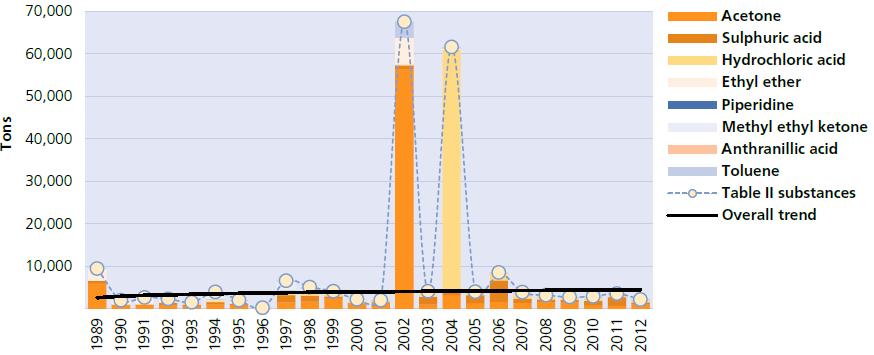
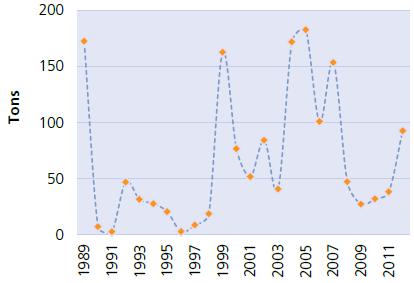
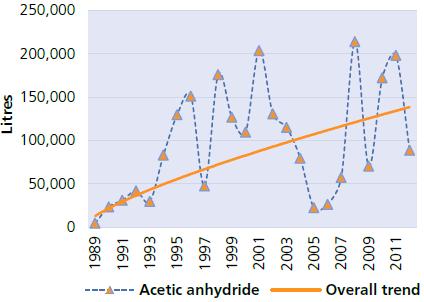
Although annual seizures of precursor chemicals fluctuate greatly, the overall trend for Table I precursors seems to show an increase over the last two decades. By contrast, seizures of Table II substances, although fluctuating, have been following a stable trend overall. The regional distribution of seizures of precursors in Table I and Table II shows a concentration in the Americas, followed, depending on the time frame examined, by Europe or, in more recent years, Asia.
Impact of precursor control on drug supply
Measures employed to control precursor chemicals have had a tangible impact on reducing the diversion of chemicals to the illicit manufacture of drugs, as could be observed through various methods of analysis:
a) Increased volume of chemicals saved from diversion. The number of shipments stopped before being diverted increased sharply, and seizures of Table I precursors rose 12-fold from the period 1990-1992 to the period 2010-2012, the former period being the initial years of international precursor control. This may point to the effectiveness of precursor control, although it is not conclusive proof;
b) High interception rates. Measuring seizures compared with the overall amount estimated to have been diverted into illicit manufacture, show that about 15 per cent of diverted potassium permanganate (in the range of 10-28 per cent) and 15 per cent of diverted acetic anhydride (in the range of 7-22 per cent) have been intercepted over the period 2007-2012. Estimated diversions are equivalent to just 2 per cent of international trade in potassium permanganate and 0.2 per cent of international trade in acetic anhydride;
c) Higher volumes of precursor seizures compared with the volume of seizures of the substances those precursors are used to manufacture. Seizures of precursors of "ecstasy", expressed in terms of the amount of "ecstasy" they could be used to manufacture (end-product equivalent), were almost a fifth larger than "ecstasy" seizures over the period 2007-2012. Seizures of amphetamine and methamphetamine precursors calculated in terms of their end-product equivalents were more than twice as high as amphetamine and methamphetamine seizures over the same period;
d) Reduced availability of drugs due to precursor control. Three examples can be cited in which precursor control appears to have reduced the supply of precursors and led to a consequent reduction in the availability of the drug. The first is the shrinking of the market for lysergic acid diethylamide (LSD), which could be at least partly attributed to improved control of LSD precursors. The shrinking of that market is reflected in the 75 per cent decline in use of LSD among high school students in the United States over the period 1996-2013, which is highly correlated to the decreased availability of the substance. The second example is the decline in "ecstasy" use in many countries, associated with a lower purity of the substance, connected with the limited availability of that drug's main precursor in the period 2007-2010. Thirdly, the improved control of precursors of methaqualone seems to have led to a decline in its availability and thus also its use over the past two decades;
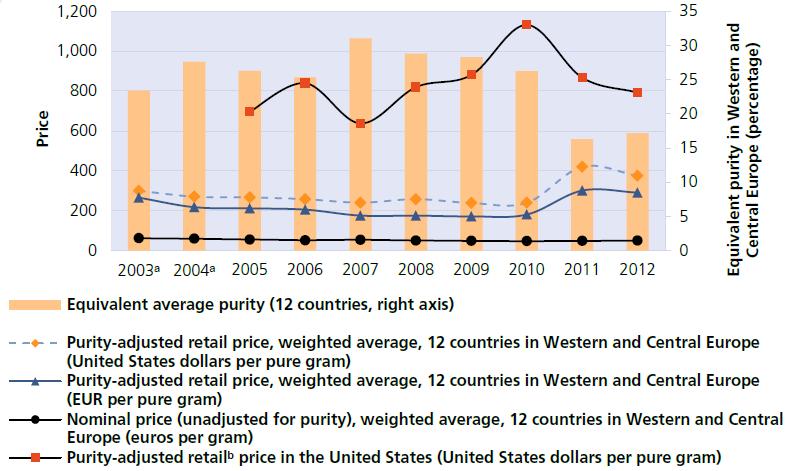
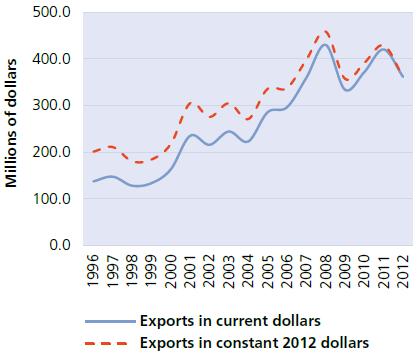
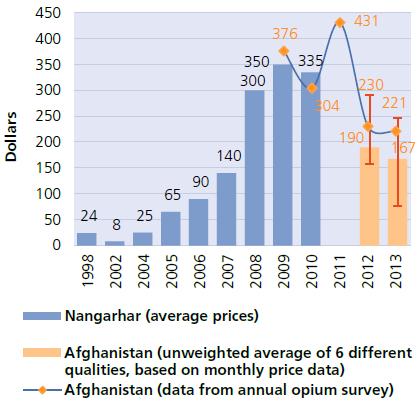
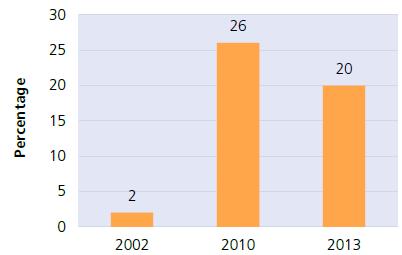
e) Prices in the illicit market. While the price of acetic anhydride in the licit market fluctuated between $1 and $1.50 per litre in recent years, the price of illicit acetic anhydride in Afghanistan rose over the years, at times reaching peaks of some $430 per litre (2011), up from $8 in 2002. The price rises can be linked to improvements in precursor control. They also had an impact on the cost of heroin production. The proportion of acetic anhydride in total production costs of heroin in Afghanistan rose from 2 per cent in 2002 to 26 per cent in 2010 before falling to some 20 per cent in 2013.
New strategies by operators of drug laboratories
Improved precursor controls at the global level have prompted clandestine operators of illegal laboratories to develop a number of counter-strategies. Those strategies include:
- the use of more sophisticated ways to obtain precursor chemicals
- the use of transit countries with weak control systems
- the emergence of organized criminal groups specialized in the supply of precursor chemicals
- the creation of front companies to conceal illegal imports
- the domestic diversion and subsequent smuggling of precursor chemicals to final destinations in order to bypass the international control system
- the use of the Internet
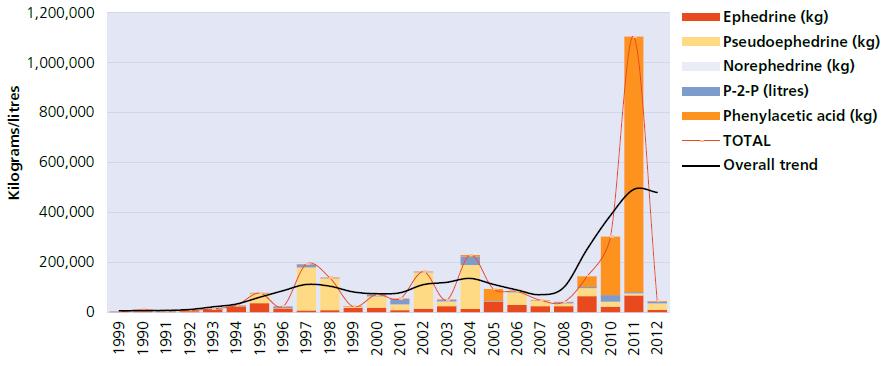
- the misuse of pharmaceutical preparations (notably preparations containing ephedrine or pseudoephedrine) and,
- the emergence of non-scheduled precursor chemicals, including various pre-precursors that can be easily converted into the required precursors.
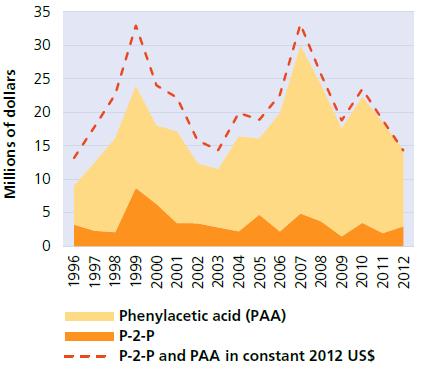
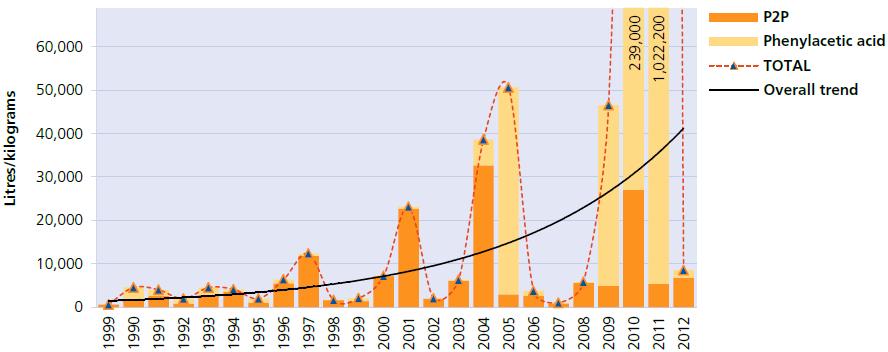
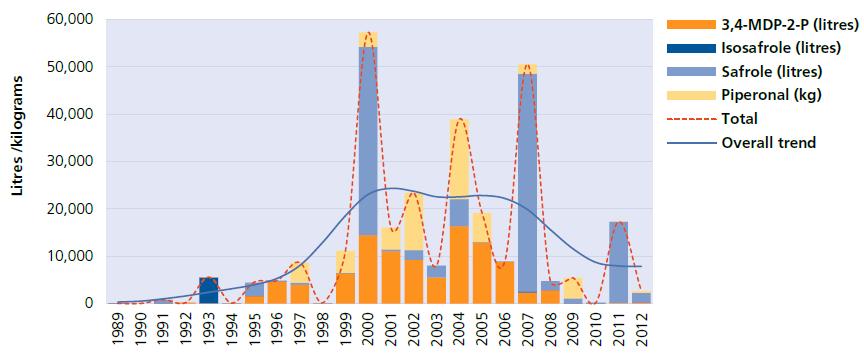
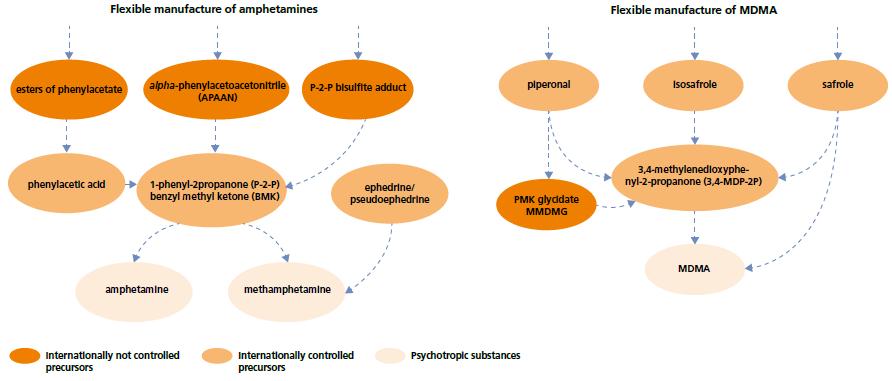
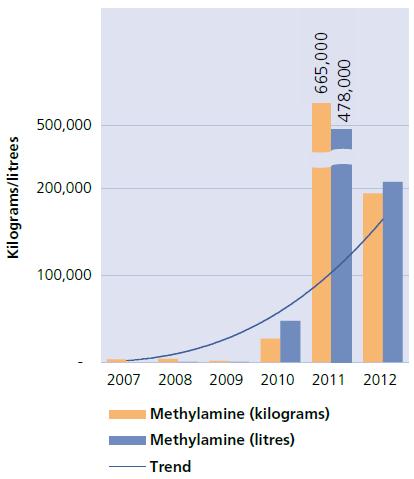
Thus, new pre-precursors for the manufacture of amphetamine-type stimulants have emerged in recent years, including APAAN, various esters of phenylacetic acid, 3,4-methylenedioxyphenyl-2-propanone, methyl glycidate and methylamine. Some of those substances, which are controlled only in a limited number of countries, have become major substitutes for the precursor chemicals used in the past and are now seized in greater quantities than are the internationally controlled precursors of amphetamine-type stimulants.
Another counter-strategy is the manufacture of new psy-choactive substances that can be manufactured with chemicals not under international control.
All of these strategies used by clandestine manufacturers create a new set of challenges for the international precursor control system. At the same time, they reflect the fact that precursor control does have an impact. There are already some instruments available at the international level to deal with the emerging problems -- use of the "know-your customer" principle, the limited international special surveillance list, the Pre-Export Notifications (PEN) Online and the Precursors Incident Communication System (PICS) -- but they are yet to be implemented in a number of countries. Their universal and effective implementation would be a step forward in meeting these challenges.
1. RECENT STATISTICS AND TREND ANALYSIS OF THE ILLICIT DRUG MARKET
A. EXTENT OF DRUG USE: GLOBAL OVERVIEW
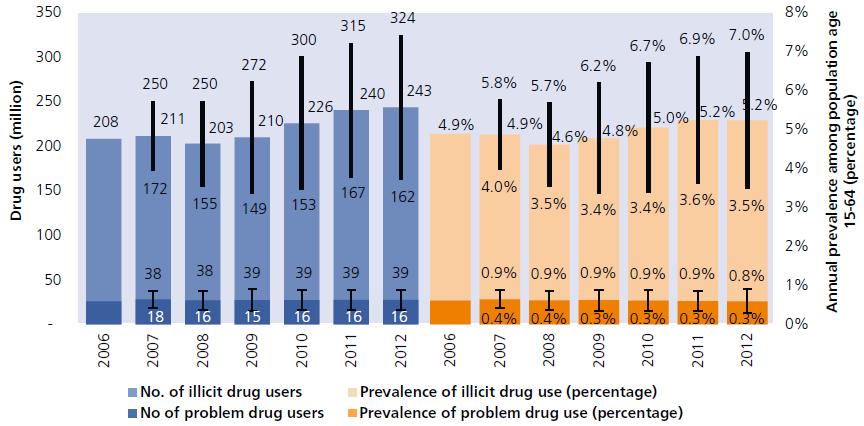
Fig. 1. Global trends in drug use, 2006-2012

Click to enlargeSource: Estimates based on the UNODC annual report questionnaire.
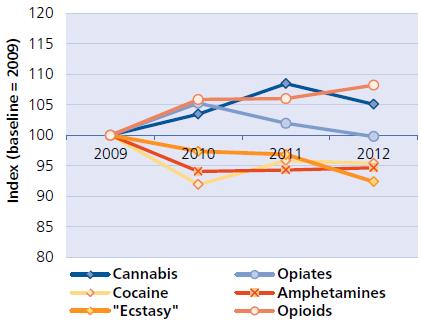
Fig. 2. Trends in the prevalence of use of different drugs, 2009-2012
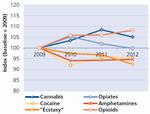
Click to enlargeSource: Estimates based on the UNODC annual report questionnaire.
Globally, it is estimated that in 2012, some 243 million people (range: 162 million-324 million) corresponding to some 5.2 per cent (range: 3.5-7.0 per cent) of the world population aged 15-64 had used an illicit drug -- mainly a substance belonging to the cannabis, opioid, cocaine or amphetamine-type stimulant (ATS) group -- at least once in the previous year. Although the extent of illicit drug use among men and women varies from country to country and in terms of the substances used, generally, men are two to three times more likely than women to have used an illicit substance. |4| While there are varying regional trends in the extent of illicit drug use, overall global prevalence of drug use is considered to be stable. Similarly, the extent of problem drug use, by regular drug users and those with drug use disorders or dependence, also remains stable, at about 27 million people (range: 16 million-39 million).
With respect to the different groups of substances, there has been an increase in opioid and cannabis use since 2009, whereas the use of opiates, cocaine and ATS (excluding "ecstasy") has either remained stable or followed a decreasing trend. However, not all countries conduct national surveys on drug use, and most countries that do so conduct them only periodically, once every three to five years.
Therefore, rather than looking at the year-to-year change, it is more meaningful to take a longer-term perspective. Also, year-on-year changes in a country's prevalence rate have only a slight impact on a region's overall prevalence unless they occur in a country with a large population. For 2012 data, updated prevalence estimates are available for 33 countries, mostly countries of Western and Central Europe and North America, representing nearly 12 per cent of the global population aged 15-64. Therefore, the trends and global annual estimates of overall drug use and of different substances reflect only the changes in or revision of the estimates for those countries and regions.
Table 1. Global estimates of users of different drugs, 2012
Number of users
(millions of users)Prevalence
(percentage)Best estimate Low High Best estimate Low High Cannabis 177.63 125.30 227.27 3.8 2.7 4.9 Opioids 33.04 28.63 38.16 0.7 0.6 0.8 Opiates 16.37 12.80 20.23 0.35 0.28 0.43 Cocaine 17.24 13.99 20.92 0.37 0.30 0.45 ATS 34.40 19.34 54.81 0.7 0.3 1.2 "Ecstasy" 18.75 6.4 28.24 0.4 0.2 0.6 Source: Estimates based on the UNODC annual report questionnaire.
Polydrug use Polydrug use is the use of two or more substances at the same time or sequentially; |1| it is a common occurrence among both recreational and regular drug users |2| |3| in all regions.
There are three distinct patterns of polydrug use:
One pattern is different substances being taken together to have a cumulative or complementary effect. |4| |5| This pattern is commonly seen among cannabis and cocaine users, who may use the drug in combination with alcohol; other combinations are the use of heroin in combination with benzodiazepines,|6| alcohol or other opioids (methadone, oxycodone, etc.) and the use of cocaine in combination with other stimulants.
A second pattern is the use of a drug to offset the adverse effects of another drug, e.g., cocaine and heroin use ("speedball"), or cocaine use with other opioids,|7| although in the latter case, there is also a complementary effect.
A third pattern is observed when a drug is gradually replacing or being substituted by another drug due to changes in price or availability or because the drug is in fashion. Common examples are heroin being substituted by oxycodone, desomorphine or other opioids, as observed in various regions, or "ecstasy" being substituted by mephedrone or some other new psychoactive substance.
Various studies have documented the extent of polydrug use. In a study conducted in 14 European countries in 2006, 60 per cent of cocaine users were polydrug users, of which 42 per cent used alcohol, 28 per cent used cannabis and 16 per cent used heroin. |8| in another study, in the South-Eastern United States, 48.7 per cent of treatment admissions were for polydrug use, with alcohol, cocaine and cannabis being the most common substances. |9| The main risks and consequences of polydrug use, for both recreational and high-risk drug users, continue to be the severe health consequences due to the increased toxicity, overdose and death. From a policy perspective, it is important to understand the patterns of polydrug use because such use invalidates the established profile and characterization of the user of a specific, single drug.
1 World Health Organization, Lexicon of Alcohol and Drug Terms (Geneva, 1994).
2 World Drug Report 2011 (United Nations publication, Sales No. E.11.X.10).
3 European Monitoring Centre for Drugs and Drug Addiction (EMCDDA), "Polydrug use: patterns and responses", Selected issue 2009 (Lisbon, November 2009).
4 ibid.
5 Annabel Boys, John Marsden and John Strand, "Understanding reasons for drug use amongst young people: a functional perspective", Health Education Research, vol. 16, No. 4 (2001), pp. 457-469.
6 Markus Backmund and others, "Co-consumption of benzodiazepines in heroin users, methadone-substituted and codeine-substituted patients", Journal of Addictive Diseases, vol. 24, No. 4 (2005).
7 Francesco Leri, Julie Bruneau and Jane Stewart, "Understanding polydrug use: review of heroin and cocaine co-use", Addiction, vol. 98, No. 1 (January 2003), pp. 7-22.
8 EMCDDA, Annual Report 2009: The State of the Drug Problem in Europe (Lisbon, November 2009), p. 42.
9 S. Kedia and others, "Mono versus polydrug abuse among publicly funded clients", Substance Abuse Treatment, Prevention and Policy, vol. 2, 2:33 (8 November 2007).Drug use and gender
Fig. 3. Estimated proportions of pharmaceutical and non-pharmaceutical illicit drug use in the past-year, by gender
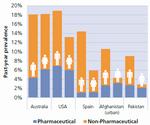
Click to enlargeSource: UNODC annual report questionnaire, Afghanistan National Urban Household Drug Use Survey, 2312, 2313 National Drug Strategy Household Survey Report (Australia), Drug use in Pakistan, 2312, Substance Abuse Mental Health Survey 2312, Encuesta Sobre Alcohol Y Drogas en Poblacion General En Espana (EDADES) 2312.
Note: Estimated proportions of non-medical use of pharmaceuticals are based on best available estimates and may not reflect all classes of pharmaceutical substances which are known to be abused.
Nearly all drug use surveys indicate that men are more likely than women to use drugs such as opiates and cannabis. However the gender gap shrinks when data on the misuse of pharmaceuticals are considered. In five recently surveyed countries (Australia, United States of America, Spain, Urban Afghanistan, and Pakistan), the illicit use of drugs is more common among men than women, but the non-medical use of pharmaceutical drugs is nearly equivalent, if not higher among women (see figure 3). Taking together the combined estimates of those five surveys, the illicit use of pharmaceuticals is notably different for the two sexes, as nearly half the women with past-year drug use had used pharmaceuticals, compared with only one third of men.
Problematic drug use as reflected in the demand for treatment
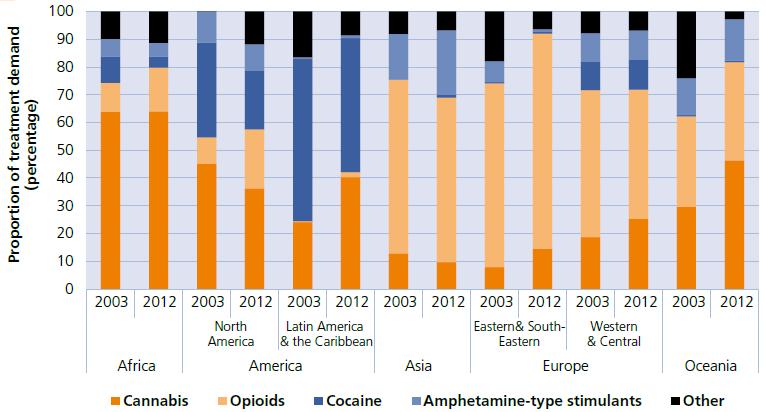
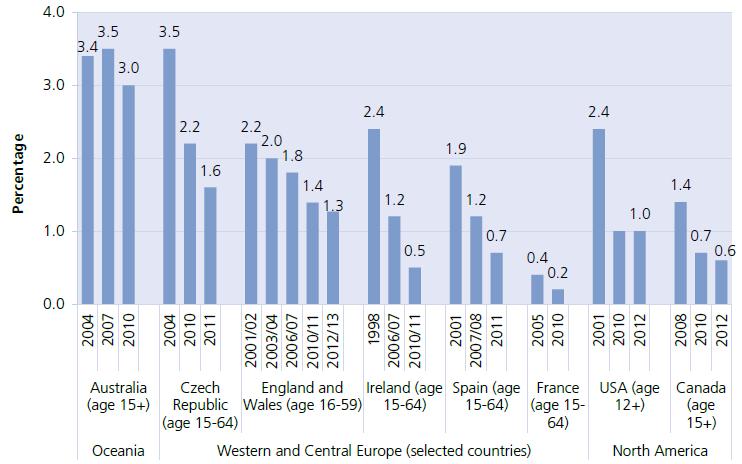
The need for treatment for drug use disorders and dependence reflects a problematic level of consumption. Therefore, analysing drug types that contribute to the demand for treatment can provide information on the drugs that have the highest negative impact on health in each region. Treatment for cannabis use is very evident in Africa, throughout the Americas and in Oceania. Although the general public may perceive cannabis to be the least harmful illicit drug, between 2003 and 2012 the proportion of total treatment admissions for cannabis increased in Western and Central Europe (from 19 per cent to 25 per cent), Eastern and South-Eastern Europe (from 8 per cent to 15 per cent), Latin America and the Caribbean (from 24 per cent to 40 per cent) and Oceania (from 30 per cent to 46 per cent). Opioids dominate the demand for treatment in Eastern and South-Eastern Europe and Asia. Cocaine is a major contributor to the demand for treatment in the Americas, in particular in Latin America and the Caribbean. ATS use is responsible for sizeable proportions of treatment demand in Asia and Oceania.
Globally, it is estimated that approximately one in six problem drug users |5| accesses treatment each year. However, there are large regional disparities, with approximately 1 in 18 problem drug users receiving treatment in Africa (primarily for cannabis use), compared with one in five problem drug users receiving treatment in Western and Central Europe, one in four in Oceania, and one in three in North America.
Drug-related deaths
Drug-related death |6| is the most extreme form of harm that can result from drug use. The United Nations Office on Drugs and Crime (UNODC) estimates that there were 183,000 (range: 95,000-226,000) drug-related deaths in 2012, corresponding to a mortality rate of 40.0 (range: 20.8-49.3) deaths per million persons aged 15-64. |7|
The current estimate of the total number of drug-related deaths is a downward revision from the value published in the World Drug Report 2013. However, this should not be interpreted as a decline in the global number of drug-related deaths. That revision was predominantly the result of the updated estimates from only a few countries (iran (islamic Republic of), Kazakhstan and Uzbekistan), which mostly affected the regional total for Asia and, consequently, the global number of drug-related deaths.
Fig. 4. Changes in the primary drug of concern among people in treatment, by region, 2003-2012
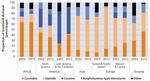
Click to enlargeSource: UNODC annual report questionnaire, national government reports.
Drug overdose is the primary contributor to the global number of drug-related deaths, and opioids (heroin and the non-medical use of prescription opioids) are the main drug type implicated in those deaths. Risk factors for overdose include the availability and purity of opioids; reduced tolerance due to a recent period of abstinence such as due to treatment, incarceration or self-imposed abstinence; lack of treatment for opioid dependence; and polydrug use, especially involving benzodiazepines and the use of alcohol. |8|
Deaths from opioid overdose are preventable not only by reducing opioid dependency or restricting supply but also by reversing the effects of opioids after an overdose has occurred. Naloxone, a pure opioid antagonist, is a medication recommended by the World Health Organization (WHO) that can be administered to immediately reverse the effects of an opioid overdose. it is highly effective and safe and has no significant side effects and no potential for misuse. |9|
Table 2. Estimated number of drug-related deaths and mortality rates per million persons aged 15-64 years, 2012
Region Number of drug-related deaths Mortality rate per million aged 15-64 % of population of countries
where mortality data
is availableBest estimate Lower estimate Upper estimate Best estimate Lower estimate Upper estimate Africa 96,000 17,500 56,200 61.9 29.4 94.3 .. North America 44,600 44,600 44,600 142.1 142.1 142.1 100 Latin America and the Caribbean 4,900 4,000 7,300 15.1 12.6 22.7 80 Asia 78,600 11,400 99,600 27.7 4.0 35.0 9 Western and Central Europe 7,500 7,500 7,500 23.2 23.2 23.2 100 Eastern and South-Eastern Europe 8,700 8,700 8,700 37.9 37.9 37.9 100 Oceania 1,900 1,600 1,900 77.5 65.3 78.5 75 Global 183,100 95,500 225,900 40.0 20.8 49.3 Source: UNODC annual report questionnaire; Inter-American Drug Abuse Control Commission; Louisa Degenhardt and others, "Illicit drug use", in Comparative Quantification of Health Risks: Global and Regional Burden of Disease Attributable to Selected Major Risk Factors, vol. 1, chap. 19, M. Ezzati and others, eds. (Geneva, World Health Organization, 2334).
Note: Data for Africa have been adjusted to reflect the 2012 population. The wide range in the estimates for Asia reflects the low level of reporting from countries in the region. The best estimate for Asia is placed towards the upper end of the reported range because a small number of highly populated countries reported a relatively high mortality rate, which produces a high regional average.
Two dots (..) indicate insufficient data. Also see footnote 7.A number of countries have implemented community-based programmes that make naloxone more readily available to appropriately trained opioid users, their peers and family members. in the United States, for example, there were 188 local opioid overdose prevention programmes distributing naloxone in 2010, and between 1996 and 2010, those programmes reported 10,171 opioid overdose reversals through use of naloxone. |10|
Preventing non-fatal overdose cases
A major health consequence of high-risk drug use -- especially among regular opioid users and people who inject drugs -- that remains largely underreported is the occurrence of non-fatal overdose cases. |11| Various studies conducted among opioid users and people who inject drugs have reported that the large majority of opioid users had survived an overdose episode in their lifetime (ranging between 30 and 83 per cent, as reported in different studies |12|). Additionally, it is estimated that in Europe, there are 20-25 non-fatal overdose cases to each drug-induced death. |13| Non-fatal overdose can significantly contribute to morbidity, including cerebral hypoxia, pulmonary oedema, pneumonia and cardiac arrhythmia, which may result in prolonged hospitalization, brain damage and disabilities. |14|
Most overdose cases occur when substances -- opioids, for example -- are mixed with other sedating substances, particularly alcohol and benzodiazepines (see the box on polydrug use). It may also occur when a person has had a short period of abstinence (e.g., after incarceration or having gone through a short-term episode of detoxification), resulting in lowered tolerance, and misjudges the dose.
People who inject drugs, health implications and prevention and treatment services
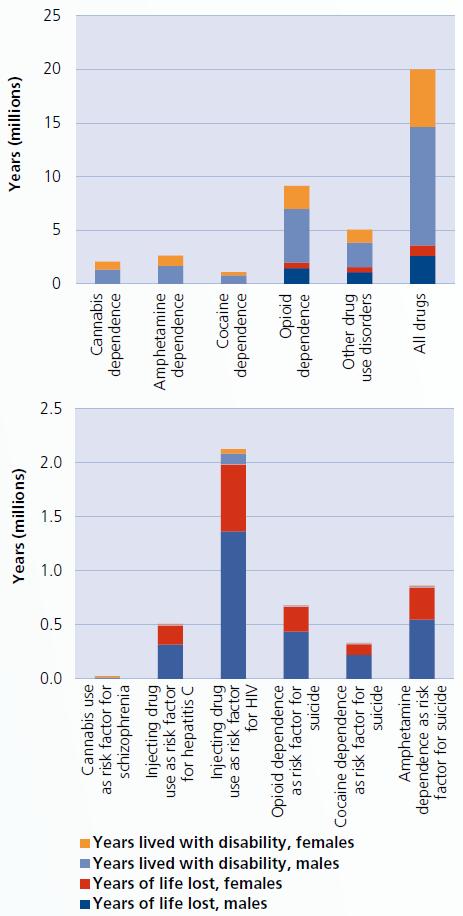
Unsafe injecting drug use can have very serious health implications due to the high risks of the transmission of blood-borne infections such as HiV, as well as hepatitis B and hepatitis C, contracted by sharing of contaminated injecting equipment. The Joint United Nations Programme on HIV/AIDS (UNAIDS) reports that the number of new cases of HIV among people who inject drugs (PWID) remains high, constituting up to 40 per cent of new infections in some countries and resulting in a major public health challenge. |15| A recent study on the global burden of disease from drug dependence estimated that in 2010, 1,980,000 years of life were lost in conjunction with unsafe injecting drug use, through premature death as a consequence of HIV infection, and a further 494,000 years of life were lost worldwide due to hepatitis C infection. |16|
Knowledge regarding the behaviour and health of people who use drugs, in particular among people who inject drugs, has expanded over the past decade. There has been a considerable effort over the past 10 years to conduct biological and behavioural surveillance studies specifically designed to measure hard-to-reach and hidden key populations (such as people who inject drugs) in order to estimate the size of those populations and the prevalence of infectious diseases, particularly HIV and hepatitis C, among them.
While the number of integrated biological and behavioural surveys carried out to date is not precisely known, it has been estimated that over the past 10 years (from 2003 to 2013) between 125 and 200 behavioural surveillance surveys and integrated biological and behavioural surveys (which include serological tests for HIV and, in some cases, for hepatitis C and syphilis) have been carried out in over 50 countries. |17|
Current estimates are based on the information available on the prevalence of injecting drug use in 89 countries (compared with 83 countries in the World Drug Report 2013), representing 83 per cent of the global population aged 15-64, and the prevalence of HIV among people who inject drugs in 111 countries (compared with 106 countries in the World Drug Report 2013), representing 92 per cent of the estimated global number of people who inject drugs. This represents an improvement in data coverage compared with what was available previously at the time of the published estimates of the former Reference Group to the United Nations on HIV and Injecting Drug Use in 2008, for which the estimate of injecting drug use prevalence was based on data from 61 countries. The estimated prevalence of HIV among people who inject drugs was based on data from 84 countries.
In calculating the 2012 estimates, UNODC, UNAIDS, WHO and the World Bank joined forces and reached out to a broad group of experts from academia, |18| regional, international and civil society organizations to ensure that the scientific approach to the methodology was used and to access the greatest number of data sets available worldwide on the subject. A combination of methodological differences and factors related to data quality makes it a challenging task to reliably assess global and regional change and trends in the epidemic of injecting drug use and HIV among people who inject drugs.
People who inject drugs
The joint UNODC/WHO/UNAIDS/World Bank global estimate for 2012 of the number of people who had recently injected drugs was 12.7 million (range: 8.9 million-22.4 million), corresponding to a prevalence of 0.27 per cent (range: 0.19-0.48 per cent) of the population aged 15-64. There are, however, large regional variations in terms of data coverage and quality.
Table 3. Estimated number and prevalence (percentage) of people who inject drugs among the general population aged 15-64 years, 2012
Region Subregion People who inject drugs Estimated Number Prevalence (percentage) Low Best High Low Best High Africa 300,000 1,020,000 6,240,000 0.05 0.17 1.05 America 2,470,000 3,130,000 3,910,000 0.39 0.49 0.61 North America 1,770,000 2,060,000 2,360,000 0.56 0.66 0.75 Latin America and the Caribbean 700,000 1,070,000 1,540,000 0.22 0.33 0.48 Asia 3,480,000 4,650,000 6,190,000 0.12 0.16 0.22 Central Asia and Transcaucasia 360,000 410,000 470,000 0.67 0.76 0.87 East and South-East Asia 2,450,000 3,260,000 4,420,000 0,16 0.21 0.28 South-West Asia 390,000 650,000 920,000 0.22 0.37 0.51 Near and Middle East 30,000 70,000 130,000 0.03 0.08 0.13 South Asia 250,000 250,000 260,000 0.03 0.03 0.03 Europe 2,530,000 3,760,000 5,850,000 0.46 0.68 1.06 Eastern and South-Eastern Europe 1,800,000 2,900,000 4,750,000 0.78 1.26 2.07 Western and Central Europe 740,000 870,000 1,100,000 0.23 0.27 0.34 Oceania 120,000 130,000 160,000 0.49 0.53 0.66 Global 8,910,000 12,690,000 22,350,000 0.19 0.27 0.48 Source: UNODC annual report questionnaire, progress reports of UNAIDS on the global AIDS response (various years), the former Reference Group to the United Nations on HIV and Injecting Drug Use, estimates based on UNODC data, and national government reports.
The current estimate represents a slight downward revision in the global number of people who inject drugs from the estimate published in the World Drug Report 2013. However, this should not be interpreted as an actual decline in the number of people who inject drugs worldwide but rather as a revision of the estimate, following the first joint UNODC/WHO/UNAIDS/World Bank data and methodology review and independent expert consultations conducted at the end of 2013. This led to an updating of national estimates on people who inject drugs for 23 countries, including highly populated countries such as China and Indonesia.
By far the highest prevalence of injecting drug use, with a rate 4.6 times the global average, is found in Eastern/ South-Eastern Europe, where 1.26 per cent of the population aged 15-64 are estimated to have recently injected drugs. Within that subregion, notably high rates of injecting drug use are observed for the Russian Federation (2.29 per cent), the Republic of Moldova (1.23 per cent), Belarus (1.11 per cent) and Ukraine (0.88-1.22 per cent).
In terms of the actual numbers of people who inject drugs, three countries (Russian Federation, China and the United States) combined account for 46 per cent of the global total.
HIV among people who inject drugs
UNAIDS reports that for the 49 countries for which data are available, the prevalence of HIV among people who inject drugs is at least 22 times higher than among the general population and, in 11 countries, is at least 50 times higher. |19|
The joint UNODC/WHO/UNAIDS/World Bank global estimate for 2012 of the number of people who inject drugs living with HIV is 1.7 million (range: 0.9 million-4.8 million), corresponding to an average prevalence of HIV among people who inject drugs of 13.1 per cent.
There are great challenges in collecting data on people who inject drugs. They are often hard to reach and difficult to sample. Surveys among people who inject drugs might capture only people currently injecting drugs, and the global estimate of people who inject drugs living with HIV may not fully represent the number of people who have a lifetime history of injecting drug use and are living with HIV but who are not currently injecting drugs.
The current estimate of the prevalence of HIV among people who inject drugs has been revised upwards from the estimate in the World Drug Report 2013. However, since the estimated total number of people who inject drugs has been revised downward, the estimated global number of people who inject drugs living with HIV remains essentially the same. Importantly, the new estimate reflects the results of the first joint UNODC/WHO/UNAIDS/World Bank data and methodology review and independent expert consultations conducted at the end of 2013, which led to updated national estimates for 36 countries, including the three countries with large populations (China, the Russian Federation and the United States).
Table 4. Estimated number and prevalence (percentage) of HIV among people who inject drugs, 2012
Region Subregion HIV among people who inject drugs Estimated number Prevalence
Best estimate
(percentage)Low Best High Africa 24,000 123,000 2,006,000 12.1 America 197,000 267,000 421,000 8.6 North America 148,000 189,000 254,000 9.2 Latin America and the Caribbean 49,000 79,000 167,000 7.4 Asia 331,000 556,000 966,000 12.0 Central Asia and Transcaucasia 26,000 31,000 41,000 7.7 East and South-East Asia 196,000 312,000 596,000 9.6 South-West Asia 88,000 188,000 298,000 28.8 Near and Middle East 1,000 3,000 8,000 3.8 South Asia 20,000 21,000 22,000 8.4 Europe 364,000 719,000 1,434,000 19.1 Eastern and South-Eastern Europe 320,000 667,000 1,368,000 23.0 Western and Central Europe 44,000 52,000 66,000 6.0 Oceania 1,000 1,000 2,000 1.0 Global 917,000 1,667,000 4,828,000 13.1 Source: UNODC annual report questionnaire; progress reports of UNAIDS on the global AIDS response (various years), the former Reference Group to the United Nations on HIV and Injecting Drug Use, estimates based on UNODC data, and national government reports.
Two regions stand out as having a very high prevalence of HIV among people who inject drugs. In South-West Asia, it is estimated that 28.8 per cent of people who inject drugs are living with HIV, predominantly reflecting the high prevalence of HIV among people who inject drugs in Pakistan. In Eastern/South-Eastern Europe, an estimated 23.0 per cent of people who inject drugs are thought to be living with HIV, primarily reflecting the high prevalence observed in both the Russian Federation (range: 18.4-30.7 per cent) and Ukraine (21.5 per cent).
In terms of the actual number of people who inject drugs living with HIV, four countries combined (China, Pakistan, the Russian Federation and the United States) account for 62 per cent of the global total.
An examination of the numbers of new cases of HIV diagnosed each year among people who inject drugs provides insight into changes in the epidemic over time and progress towards achieving the target set in the Political Declaration on HIV and AIDS adopted by the General Assembly in 2011 of reducing HIV transmission among people who inject drugs by 50 per cent by 2015. |20| Although the changes in the numbers of newly diagnosed cases may reflect improved surveillance, they also reflect changes in the transmission of HIV within that most-at-risk group.
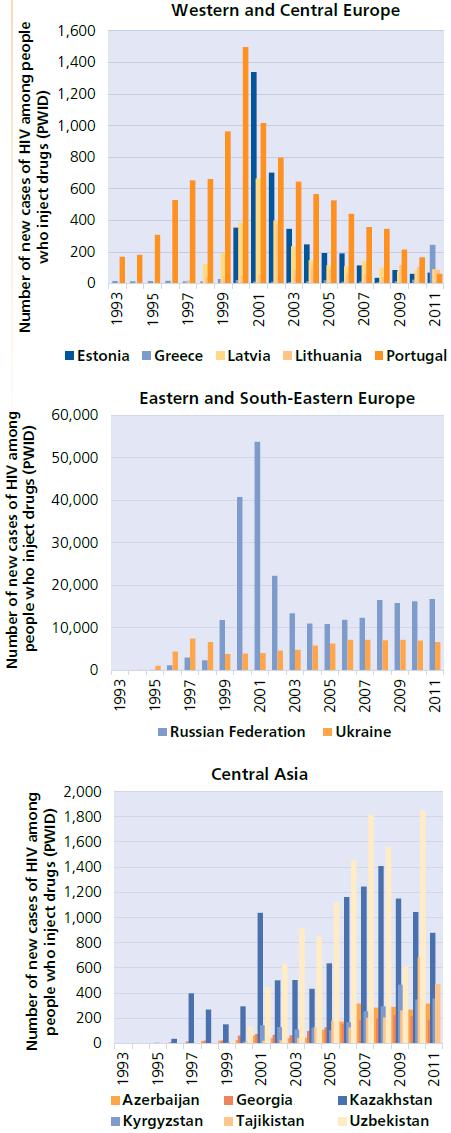
Fig. 5. Countries with a high occurrence of newly diagnosed cases (incidence) of HIV among people who inject drugs in Europe and Central Asia, 1993-2011
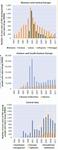
Click to enlargeSource: EMCDDA Statistical Bulletin 2013; European Centre for Disease Prevention and Control/World Health Organization, table INF-104; Federal Scientific and Methodological Center for Prevention and Control of AIDS, Russian Federation; Republican AIDS Center, Ministry of Health, Tajikistan.
In several European countries |21| with a high occurrence of newly diagnosed cases (incidence) of HIV among people who inject drugs, there was a noticeable peak in the number of new cases between 1999 and 2003, indicating that the epidemic in the region was greatest in those years and subsequently declined. That development is visible also in the sharp decline in the number of deaths from AIDS attributed to unsafe injecting drug use that occurred in later years in the western part of the WHO European region, |22| with the number of deaths declining from 1,358 in 2006 to 179 in 2012 |23|. During that time period, the contribution of unsafe injecting drug use to total AIDS-related deaths in that region declined from 43 per cent to 25 per cent. The decline in newly diagnosed HIV cases and AIDS-related deaths among people who inject drugs are consistent with the scaling-up of the provision of harm reduction services, a decline in the prevalence of injecting and a change in the behaviour of people who inject drugs, with less frequent injecting and safer injecting practices being observed in many Western European countries. |24|
There are some exceptions to the general downward trend in the number of new HIV cases among people who inject drugs in Europe, which demonstrate how the situation with regard to the HIV epidemic can change very rapidly. Greece (Athens) and Romania recently experienced significant increases in HIV cases among people who inject drugs. Those outbreaks were related to the increased frequency of injecting associated with a changing pattern of injecting, from heroin to cocaine in Greece and to amphetamines in Romania, and an increase in the sharing of needles and syringes. |25| |26| The European Monitoring Centre for Drugs and Drug Addiction (EMCDDA) notes a temporal association between those outbreaks and the low levels of harm reduction services in Greece (compared with international standards) and Romania. |27|
Eastern/South-Eastern Europe has very high prevalence rates and numbers of people who inject drugs and people who inject drugs and are also living with HIV, predominantly reflecting the situation in the Russian Federation and Ukraine. In those two countries, the number of people who inject drugs who are newly diagnosed with HIV each year continues to be higher than in other countries of the region. According to the Russian Federal Research and Methodological Centre for Prevention and Control of AIDS, the proportion of newly diagnosed cases of HIV attributed to injecting drug use was 58.7 per cent in 2009 and 57.0 per cent in 2013. In Ukraine, the number of newly diagnosed cases of HIV among people who inject drugs is levelling off at about 6,000-7,000 new cases annually. In Central Asia, a region with a high prevalence of injecting drug use, several countries with a high occurrence of newly diagnosed cases (incidence) of HIV among people who inject drugs have seen the incidence continue to rise over the past decade. |28| Very high levels of risky injecting behaviour are reported in the region and, although some progress has been made in the scaling-up of HIV prevention, treatment and care services for people who inject drugs, many obstacles still remain. |29|
South-West Asia has the highest prevalence of HIV among people who inject drugs, with Pakistan contributing the most to that prevalence rate, as that country has a large number of people who inject drugs and a very high prevalence of HIV among people who inject drugs (37 per cent). In Pakistan, a recent cohort study |30| conducted in three drop-in centres in Karachi followed 636 HIV-negative people who injected drugs over a period of two years (between 2009 and 2011). Even though all of those participating in the study were attending basic risk reduction programmes, the HIV incidence rate among them was 12.4 per 100 person-years. At the end of the 24-month study period, 24.9 per cent of the participants were HIV-positive. The authors reported that underfunding compromised the quality and quantity of outreach services and the full implementation of harm reduction programmes. The greatest risk factor for HIV infection was found to be the sharing of syringes, for which the risk of infection was 2.3 times higher than for those who did not share injecting equipment. The authors concluded that the absence of opioid substitution therapy and inadequate needle and syringe programme coverage undermined the success of the HIV harm reduction programmes studied. Other countries of South-West Asia might have similarly high levels of HIV incidence among people who inject drugs, but there is a lack of available data.
Hepatitis among people who inject drugs
Hepatitis B and C can lead to liver disease such as cirrhosis, liver cancer and death. Hepatitis C is highly prevalent among people who inject drugs and is transmitted through the sharing of contaminated injecting equipment even more easily than is HIV. The first year of injecting is the time of greatest risk for hepatitis C infection from sharing needles and syringes. |31| |32| The joint UNODC/WHO/ UNAIDS/World Bank global estimate for 2012 of the percentage of people who inject drugs who are living with hepatitis C is 52.0 per cent, corresponding to 6.6 million people aged 15-64. For 2012, the global estimate of the percentage of people who inject drugs living with hepatitis B is 6.7 per cent, corresponding to 850,000 people aged 15-64.
Coverage of services for the prevention and treatment of HIV among people who inject drugs
Addressing HIV among people who inject drugs is a major component of the global response to the spread of HIV. A comprehensive package of nine evidence-based interventions, as a component of what are also known as "harm reduction" services, for the prevention, treatment and care of HIV among people who inject drugs, as outlined in the WHO, UNODC, UNAIDS Technical Guide |33| (referred to hereafter as the Technical Guide) has been widely endorsed by high-level political bodies including the General Assembly, the Economic and Social Council, the Commission on Narcotic Drugs and the Programme Coordinating Board of UNAIDS. In addition, donor agencies, including the Global Fund to Fight AIDS, Tuberculosis and Malaria (GFATM) and the United States President's Emergency Plan for AIDS Relief (PEPFAR) have committed to using that framework.
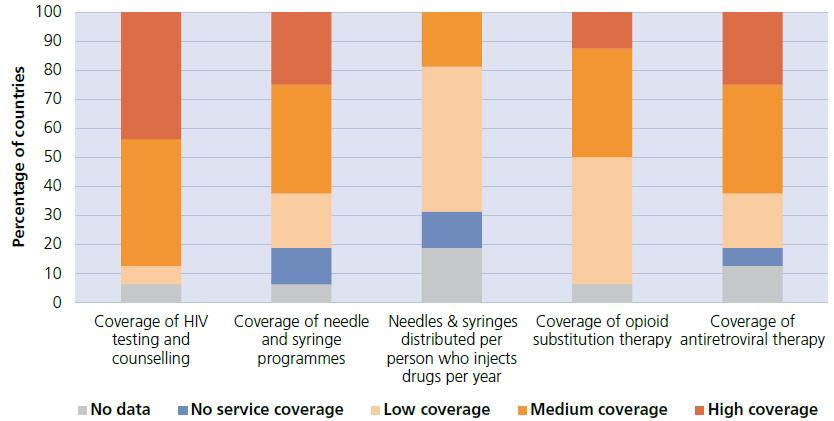
Table 5. Overview of the level of provision of harm reduction services
Response at the global level Classification of coverage targets Countries reporting low, medium or high coverage (percentage) Number of countries reporting Global median value Low Medium High Low Medium High Less than From - to More than Percentage of people who inject drugs who were tested for HIV in the last 12 months and who know the results 31% 29% 40% 83 36%a 40% 40 - 75% 75% Percentage of all people who inject drugs who were reached by a needle and syringe programme over the last 12 months 49% 25% 26% 85 20% 20 - 60% 60% Number of needles-syringes distributed per person who injects drugs per year 62% 20% 18% 55 74 100 100 - 200 200 Percentage of opioid-dependent people who inject drugs on opioid substitution therapy 35% 32% 33% 79 20% 20 - 40% 40% Percentage of all HIV positive people who inject drugs receiving antiretroviral therapy at a specified date 32% 31% 37% 74 25% 25 - 75% 75% Source: UNODC annual report questionnaire, UNAIDS.
Note: The table provides the classification and level of service provision for HIV testing and counselling, needle and syringe programmes, opioid substitution therapy and antiretroviral therapy among people who inject drugs and those among them living with HIV, according to the Technical Guide; the percentage of countries reporting low, medium or high coverage for those services; and the global average level of service provision.
a Based predominantly on behavioural survey data.
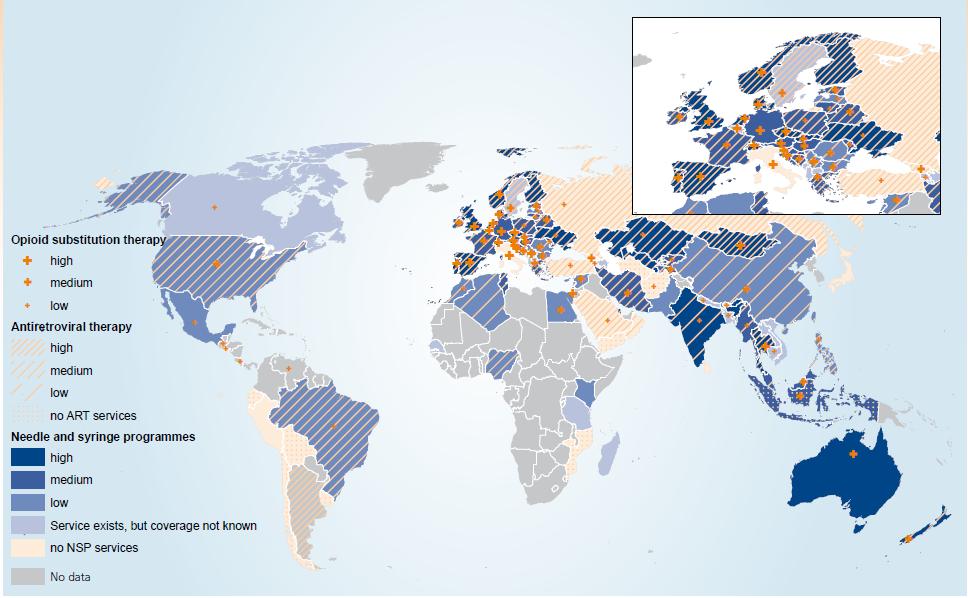
Map 1. Service coverage for people who inject drugs and those among them living with HIV, classified according to the Technical Guide
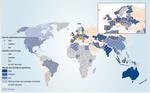
Click to enlargeSource: UNODC annual report questionnaire, UNAIDS and the former Reference Group to the United Nations on HIV and Injecting Drug Use.
Note: In reporting on the level of service coverage via the annual report questionnaire, Member States have the option of categorizing the level of service coverage as "not applicable". That response has been interpreted as meaning that there is no service coverage. For some countries the level of service coverage for needle and syringe programmes is not known, but the service is known to exist in that country. However, the scale of provision of needle and syringe programmes in those cases can vary substantially.
The boundaries shown on this map do not imply official endorsement or acceptance by the United Nations. Dashed lines represent undetermined boundaries. Dotted line represents approximately the Line of Control in Jammu and Kashmir agreed upon by India and Pakistan. The final status of Jammu and Kashmir has not yet been agreed upon by the parties. The final boundary between the Sudan and South Sudan has not yet been determined.Fig. 6. Levels of service provision for countries with the highest prevalence rates (among those reporting on service provision) of injecting drug use and HIV among people who inject drugs
Click to enlargeSource: UNODC annual report questionnaire, UNAIDS.
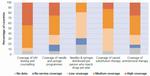
Note: In reporting on the level of service coverage via the annual report questionnaire, Member States have the option of categorizing the level of service coverage as "not applicable". That response has been interpreted as meaning that there is no service coverage. 16 countries have been assessed for this figure.In order of priority, the four most important interventions are needle and syringe programmes, opioid substitution therapy, HIV testing and counselling, and antiretroviral therapy. |34|
National estimates of the level of service coverage in the community (the extent to which people who inject drugs actually receive the intervention) and the distribution of needles and syringes are presented using a classification of "low", "medium" or "high" as defined according to the targets set in the Technical Guide.
In most countries, the extent of services provided to people who inject drugs falls below the lower-level targets presented in the Technical Guide. However, global estimates mask important regional variations.
The coverage of services is highest in Western and Central Europe, with 50-60 per cent of reporting countries indicating that a high proportion of people who inject drugs are accessing needle and syringe programmes, opioid substitution therapy, HIV testing and counselling and antiretroviral therapy services. In Eastern/South-Eastern Europe, despite the increase in service availability in some countries, access to needle and syringe programmes in particular remains low. In North America, none of the countries report a high level of access of people who inject drugs to any of the services, with needle and syringe programmes consistently reaching only a low proportion of people who inject drugs. In Latin America (no countries from the Caribbean reported information), the two overall most important interventions (needle and syringe programmes and opioid substitution therapy) are generally reaching only low numbers of people who inject drugs. It should be noted that in Latin American countries, the prevalence of use of opiates is very low and therefore, in reporting by countries, opioid substitution therapy would not be indicated as relevant. Also six of the seven Latin American countries reporting through the annual report questionnaire indicated that needle and syringe programmes were "not applicable", reflecting that the practice of injecting drugs is at a low level. In Central Asia and Transcaucasia, a region with a high prevalence of injecting drug use, only two countries indicate a high level of HIV testing and counselling, and access to needle and syringe programmes, and overall low levels of access to opioid substitution therapy. In East and South-East Asia, a region with a large number of people who inject drugs and, among them, a significant number of people living with HIV, 50 per cent of the countries reporting indicate a high level of HIV testing and counselling among people who inject drugs. However, needle and syringe programmes are not reaching many people who inject drugs in many countries in the region. South-West Asia has the highest prevalence of HIV among people who inject drugs, but no country in the region reported a high level of coverage for any of the services.
In the 16 countries |35| that have the highest prevalence of people who inject drugs and the highest prevalence of HIV among people who inject drugs -- which account for 45 per cent of the global number of people who inject drugs and 66 per cent of the global number of people who inject drugs living with HIV -- a generally low level of service provision can be noted, particularly with regard to needle and syringe programmes and opioid substitution therapy.
Drug use among prisoners and implications for health
It is estimated that worldwide, on any single day, there are more than 10.2 million people held in prisons (including pretrial detention), with the numbers growing in every continent. |36| However, prison population rates differ considerably from region to region and between different parts of the same continent. |37| Many of those held are incarcerated for offences related to the use, possession or supply of drugs.
Drug use and injecting drug use are both highly prevalent among prison populations, often more so than among the general population. EMCDDA reports that the proportion of prisoners who had used an illicit substance during incarceration in individual countries in Europe (mostly Western and Central Europe) ranged from 4 to 56 percent, with 11 countries reporting levels of 20 per cent or higher. Further, countries reported proportions of prisoners who had injected drugs while incarcerated ranging from 0.7 to 31 per cent, with seven countries reporting rates of injecting drug use of 7 per cent or higher. |38|
Global Burden of Disease Study 2010: Estimating the burden of disease from drug dependence
Estimated disability-adjusted life years, years of life lived with disability and years of potential life lost due to premature death for drug use disorders, and attributable to illicit drug use as a risk factor for other health outcomes, by gender, 2010
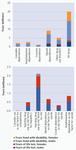
Click to enlargeSource: L. Degenhardt and others, "Global burden of disease attributable to illicit drug use and dependence: findings from the Global Burden of Disease Study 2010", The Lancet, vol. 932, No. 3334 (23 August 2319), pp. 1564-1574.
Illicit drug use can have a profoundly negative effect on a person's health. It can lead to premature death, such as in the case of overdose, but can also severely curtail the quality of life through disability (any short-term or long-term health loss), such as from liver disease, or infection with HIV and hepatitis B and C as a result of sharing contaminated needles and syringes. |1|
These effects can be quantified in an indicator called "disability-adjusted life year" (DALY), which encompasses both the years of potential life lost due to premature death (YLL) and the years of life lived with disability (YLD). A recent study published by Degenhardt and others (2013) |2| produced global estimates of disability-adjusted life years for illicit drug dependence |3|, and drug use as a risk factor for other health outcomes (schizophrenia from cannabis use, hepatitis and HIV from injecting drug use, and drug dependence as a risk factor for suicide).
The findings of that study reveal that in 2010, drug dependence on illicit drugs was responsible for 3.6 million years of life lost through premature death and 16.4 million years of life lived with disability globally. Combined, this is equal to 20 million years of disability-adjusted life years (representing 0.8 per cent of global all-cause disability-adjusted life years), an increase from 13.1 million years estimated for 1990. Opioid dependence contributed most to the burden of disease, being responsible for 55 per cent of years of life lost due to premature death and 44 per cent of years of life lost through disability. The increase in the global burden of disease from cannabis, amphetamine and cocaine dependence between 1990 and 2010 is essentially attributable to population growth, but this is not the case for opioid dependence. The burden of disease from opioid dependence increased by 74 per cent between 1990 and 2010, with 42 per cent of that increase attributable to an increase in the prevalence of opioid dependence. According to UNODC data, the prevalence of opioid use has been increasing globally over the past five years as a consequence of the increased misuse of prescription opioids, whereas the prevalence of opiate (heroin and opium) use has been stable at the global level and declining in some regions such as Europe. A total of 43,000 deaths were attributed to opioid dependence in 2010, which suggests that life expectancy was typically cut short by 46 years in each of those cases of death. The global burden of disease attributed to cannabis dependency is higher than that for cocaine. Although cocaine use is associated with greater harm, the far higher number of cannabis-dependent users results in the greater global burden of disease overall. Broadly speaking, males contribute two thirds of the number of years of life lost and years lived with disability for all drug types. Disability-adjusted life years rose sharply between the ages of 15-24, reaching a peak in the relatively young 20-30 age group, consistently across all drug types. Illicit drug use was estimated to be the cause of 0.8 per cent of disability-adjusted life years worldwide in 2010 (ranking as the 19th leading risk factor). In comparison, tobacco smoking was the cause of an estimated 6.3 per cent of global disability-adjusted life years, and alcohol the cause of an estimated 3.9 per cent. However, for drug use, disability-adjusted life years reach a peak among users aged 20-30 years, and among that age group it contributes a higher proportion to the burden of disease.
The burden of disease from acquiring HIV through injecting drug use was estimated to be 2.1 million years in 2010, of which 2.0 million were from years of life lost through premature death. The burden of disease from hepatitis C acquired through injecting drug use is also high and was estimated to be responsible for 494,000 years of life lost in 2010 through premature death.
1 WHO, Neuroscience of psychoactive substance use and dependence (Geneva, 2004).
2 L. Degenhardt and others, "Global burden of disease attributable to illicit drug use and dependence: findings from the Global Burden of Disease Study 2010".
3 Defined as the presence of three or more indicators of dependence for at least a month within the previous year. These indicators consist of a strong desire to take the substance, impaired control over use, a withdrawal syndrome on ceasing or reducing use, tolerance to the effects of the drug, the need for larger doses to achieve the desired psychological effect, a disproportionate amount of time spent by the user obtaining, using and recovering from drug use, and persistence of drug taking despite the problems that occur.
Fig. 7. Prevalence of drug use, injecting drug use and HIV infection among prisoners
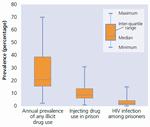
Click to enlargeSource: UNODC annual report questionnaire, EMCDDA and national government reports.
Note: Data are available for only a limited number of countries, mostly from Western and Central Europe. The countries included in each category vary.Several studies document that a very high percentage (56-90 per cent) of people who inject drugs report a history of imprisonment since starting injecting. |39| An overview of HIV in prisons in all regions identified rates of infection many times higher than among the general population. |40| A study that compiled information on HIV prevalence in prisons for 75 low-income and middle-income countries found rates greater than 10 per cent in 20 of those countries. |41| The situation is of particular concern in women's prisons. Although there are fewer women in prison, both drug use and HIV infection are more prevalent among women in prison than among imprisoned men. |42|
Although the availability of data is limited, there is a high level of illicit substance use in prisons, in particular the regular use of opioids |43|. Injecting drugs is also a common practice. This is of concern because the prison environment is one in which there are limited prevention and treatment options for dealing with drug dependence and its associated health consequences.
The lack of access to and availability of health care, especially drug dependence treatment and HIV prevention and care services, in prisons is of major concern, since the prison population, at a minimum, should have access to these services to an extent equivalent to those available to the community outside.
C. REGIONAL TRENDS IN DRUG USE
Africa
Reliable and comprehensive information on the drug situation in Africa is not available. The limited data available suggest, however, that cannabis use, notably in West and Central Africa (about 12.4 per cent) is probably higher than the global average (3.8 per cent). The prevalence of use of other substances -- except for cocaine, which remains at the global average -- is low overall in Africa. A recent survey conducted in Cabo Verde in 2012 |44| found that 7.6 per cent of the population had used an illicit substance at least once in their lifetime, 2.7 per cent had used an illicit substance in the past year and 1.6 per cent in the past 30 days. Cannabis was the most popular drug (2.4 per cent reporting use in the past year) followed by cocaine (0.2 per cent annual prevalence). The survey also reported common use of a "cocktail" containing crack cocaine and cannabis. ATS use, although at low levels (0.1 per cent lifetime prevalence), seems to be emerging.
In Nigeria, the expert perception is that there has been a large increase in the use of cannabis, with some increase in the use of ATS. |45| According to the national survey on alcohol and drug use in Nigeria conducted in 2009, aside from alcohol, the non-medical use of tranquillizers had the highest annual prevalence (5.5 per cent) among the population aged 15-64 years. The misuse of prescription opioids was also reported to be high and more prevalent than the use of heroin (3.6 per cent annual prevalence of other opioids, and 2.2 per cent annual prevalence of heroin).
High levels of use of other substances were also reported, with annual prevalence as follows: cannabis, 2.6 per cent; amphetamine, 1 per cent; methamphetamine, 1.6 per cent; "ecstasy", 1.7 per cent; cocaine, 1.6 per cent; and crack, 2 per cent. The prevalence in the last year of people injecting drugs was reported as 1.9 per cent. |46|
In South Africa, expert perception is that there is some increase in the use of heroin and methamphetamine and some decrease in the use of crack cocaine (with use of other drugs being stable). |47| Treatment facilities report that cannabis remains the most common illicit substance used, particularly among young people. Almost half of the admissions at specialist treatment centres were primarily related to cannabis use disorders. Polydrug use appears to be a common phenomenon among drug users in treatment. |48|
Americas
With the exception of opiate use, use of all other groups of substances (cannabis, opioids, cocaine, ATS and "ecstasy") remains at levels higher than the global average in the region.
North America
In the United States, past-year illicit drug use by persons aged 12 years or older reached the highest level in the past 10 years, increasing from 14.9 per cent in 2011 to 16.0 per cent in 2012. That overall increase in drug use, led mainly by the increase in cannabis use, is considered to be linked with lower risk perceptions of cannabis use, especially among young people. |49| The use of cannabis rose from 11.5 per cent to 12.1 per cent and the non-medical use of psychotherapeutic drugs, particularly prescription opioids, rose from 5.7 per cent to 6.4 per cent after declining in 2011. In 2012, use of cocaine also increased slightly among the adult population but remained stable or declined among youth. |50| In 2012, drug use was reported to be the highest among those in their late teens or twenties, while drug use among older adults, e.g., among those in their fifties, was also increasing, partly due to the ageing cohort of "baby boomers", whose levels of drug use have been higher than those of previous cohorts. |51|
However, past-year use of any illicit substance declined from 19.0 per cent in 2011 to 17.9 per cent in 2012 among the youth population aged 12-17 years, reaching the lowest level in the previous 10 years. From 2011 to 2012, past-year and past-month use of almost all drug types declined or remained stable among the 12-17 years age group. |52|
In the United States, the increasing non-medical use of pain relievers (prescription opioids) is also reflected in the continuing increase in the percentage of treatment admissions for opiates other than heroin, |53| which now surpass treatment admissions for cocaine and methamphetamine. |54| The number of deaths resulting from prescription painkiller overdose also continues to rise, especially among women. |55| However, increases in heroin-related overdose deaths in the United States have also been reported (see "The interplay between illicit and pharmaceutical opioid use"). In addition, medical emergencies related to the nonmedical use of pharmaceuticals increased 132 per cent over the period 2004-2011, with the number of medical emergencies involving opiates and/or opioids rising 183 per cent. |56|
In Canada, however, past-year use of cannabis in 2012 among the population aged 15 years or older remained unchanged from the previous year, while there was an increase in cannabis use among those aged 25 years or older: from 6.7 per cent in 2011 to 8.4 per cent in 2012. Past-year use of other illicit substances was estimated at about 1 per cent, and no changes were observed in the prevalence of those substances in the short term (20112012) or the long term (2004-2012). |57|
Latin America and the Caribbean
In South and Central America and the Caribbean, use of cocaine remains high, especially in South America, where cocaine use is currently at levels comparable to high-prevalence regions. With the exception of ATS, the use of other illicit substances remains low in the subregion.
According to a recent survey conducted among university students in the four Andean countries, the annual prevalence of cannabis use ranged between 15.2 per cent in Colombia and 3.6 per cent in the Plurinational State of Bolivia. Cocaine use was high in Colombia (2.2 per cent) compared with 1.1 per cent in Ecuador, 0.5 per cent in Peru, and 0.3 per cent in the Plurinational State of Bolivia. ATS prevalence was reported at 0.9 per cent in Colombia, 0.7 per cent in Ecuador and 0.5 per cent in Peru. Comparing the trends between 2009 and 2012, among students in the four countries there has been an overall increase in cannabis use (from 4.8 per cent in 2009 to 7.9 per cent in 2012), a small increase in the use of ATS and stable trends with regard to cocaine use. A major finding of the survey was the high prevalence of use of lysergic acid diethylamide (LSD) among university students, which increased from 0.2 per cent in 2009 to 0.95 per cent in 2012. |58| LSD use was reported as being particularly high among students in Colombia. |59|
Asia
Reliable prevalence estimates are available for only a few countries in Asia. Those data suggest that consumption of illicit drugs is at levels similar to or below the global average. Tentative estimates suggest that cannabis is the most common illicit substance, with an annual prevalence of use of 1.9 per cent among those aged 15-64 years, followed by ATS (excluding "ecstasy") at 0.7 per cent, "ecstasy" at 0.4 per cent, opiates at 0.35 per cent and cocaine at 0.05 per cent. As reported by experts, the use of methamphetamine continues to rise in most countries in East and SouthEast Asia, with accompanying seizures of methamphetamine in pill and crystalline forms reaching record levels in 2012. "Ecstasy" use seems to be staging a comeback, while use of new psychoactive substances is on the rise. |60|
Fig. 9. Trends in registered drug users and proportion of registered drug users by drug type in China, 2000 - 2012
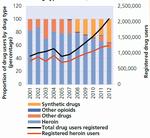
Click to enlargeSource: Information provided by China in the UNODC annual report questionnaire and the annual reports on drug control in China published by the Office of the National Narcotics Control Commission.
In the absence of reliable survey data, national experts have indicated that in East and South-East Asia, the use of ATS has both increased and diversified. ATS have been ranked among the three drug types most used in countries in the subregion since 2009.
Methamphetamine pills are predominantly used in countries such as Cambodia, the Lao People's Democratic Republic, Myanmar, Thailand and Viet Nam, whereas crystalline methamphetamine is the primary drug of concern in Brunei Darussalam, Cambodia, Indonesia, Japan, the Philippines and the Republic of Korea. |61| There has also been a resurgence in the "ecstasy" market, with increased use in 2012 being reported by experts in a number of countries following a decline for several years.
"Ecstasy" seizures more than tripled in 2012 compared with the previous year. The new psychoactive substances market is also growing rapidly in the subregion. Ketamine use has been long-standing in the region. Its use is considered to be stabilizing, while kratom continues to be used as a traditional stimulant in Malaysia, Myanmar and Thailand. The use of synthetic cannabinoids has also been reported in China, Indonesia, Japan, the Republic of Korea and Singapore. |62|
Experts from China report a stable situation with regard to the consumption of cannabis, cocaine, and tranquillizers and sedatives. However, the number of registered drug users continued to increase. Opioid use remains high in China, with 1.272 million opioid users registered by the end of 2012, compared with 1.18 million in 2011. |63| The proportion of heroin users among registered drug users (59 per cent of users) decreased in 2012, as the number of registered synthetic drug users increased more than heroin users, especially because, as reported by the experts, there has been a large increase in the use of methamphetamine. |64| Moreover, recent estimates of people who inject drugs -- primarily heroin -- are lower than previous estimates. The estimated prevalence of people who inject drugs in China, at 0.19 per cent in 2012, is less than the estimate of 0.25 per cent for 2005. |65|
Compared with East and South-East Asia, South-West and Central Asia are marked by high prevalence of opiate use, with an accompanying high prevalence of people who inject drugs and who are living with HIV: 28.8 per cent in South-West Asia and 7.7 per cent in Central Asia. The prevalence of opiate use in Afghanistan, Iran (Islamic Republic of) and Pakistan is among the highest globally (average of 1.5 per cent of the adult population in the three countries), whereas it is 0.8 per cent in Central Asia -- twice the global average.
Europe
In Europe, cannabis is by far the most commonly consumed illicit substance, with an estimated 24 million past-year users (4.3 per cent of those aged 15-64), followed by cocaine with 3.7 million past-year users (0.7 per cent of those aged 15-64). The use of opioids and opiates is comparable to global average levels. ATS (excluding "ecstasy") are consumed at a level little below the global average, but the use of "ecstasy" is higher, with an annual prevalence of 0.5 per cent compared with the global average of 0.4 per cent. Illicit drug consumption patterns are quite different between the two subregions in Europe. The use of cannabis and cocaine is much higher in Western and Central Europe, whereas the consumption of opioids and opiates is much higher in Eastern and South-Eastern Europe.
Western and Central Europe
In Western and Central Europe, although cannabis use remains high (5.7 per cent annual prevalence), there is evidence of trends of decreasing use, especially in countries with long and established cannabis use. |66| The recent household surveys in Poland and Italy show substantially lower prevalence of cannabis use than previously reported, which can also be ascribed to methodological differences in those two most recent surveys. |67| There is also an increasing diversity in the types of cannabis products available, especially high-potency herbal cannabis and the synthetic cannabis-like products that are emerging in the subregion. |68|
Fig. 10. Trends in drug use in England and Wales, 2003/04-2012/13
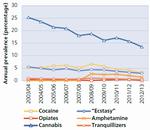
Click to enlargeSource: United Kingdom, Home Office, "Drug misuse: findings from the 2012/13 Crime Survey for England and Wales" (London, July 2013).
Cocaine consumption in Western and Central Europe remains high, at 1 per cent of the adult population. However, countries with high levels of use, e.g., Denmark, Italy, Spain and the United Kingdom of Great Britain and Northern Ireland, report a declining trend in cocaine use as well as in treatment demand. |69|
The past-year use of opioids, mainly heroin, is estimated as 0.4 per cent of the population aged 15-64. However, in Western and Central Europe, other opioids such as buprenorphine, fentanyl and methadone are available in the illicit markets, with reports that heroin has been replaced with fentanyl and buprenorphine in some countries. |70| Overall, most countries in the subregion report declining trends in the use of heroin. The number of heroin users entering treatment for the first time has also been declining, resulting in an ageing cohort of heroin users currently in treatment. Injecting heroin, a common practice, has also been declining. Coupled with other interventions, this is likely to have contributed to the decline in the number of new HIV infections among heroin users who inject drugs. |71|
Amphetamine and "ecstasy" remain the most commonly used synthetic stimulants in the subregion, with an annual prevalence of use of 0.6 per cent and 0.5 per cent of the adult population respectively. Injecting amphetamine continues to be seen as common among chronic drug-use populations. While amphetamine use has been stabilizing in parts of the subregion, there are concerns that it is being displaced by methamphetamine, given the increasing availability of methamphetamine in some markets. |72|
Eastern and South-Eastern Europe
The main concern in Eastern and South-Eastern Europe is the high level of consumption of opioids, notably opiates, with annual prevalence rates of 1.2 per cent and 0.8 per cent, respectively. "Ecstasy" use is also above global average levels, with an annual prevalence of 0.6 per cent. The subregion is also marked by having one of the highest prevalence rates of people who inject drugs, as well as a high prevalence of people who inject drugs living with HIV. In two countries with high rates of opiate consumption, Belarus and Ukraine, experts perceive a significant increase in the use of opiates, with Belarus also reporting a significant increase in the use of opium. Heroin use is reported as stable in Ukraine, and there is an increase in the use of ATS in the country. |73|
The Russian Federation has the highest prevalence of opiate use in the subregion. However, heroin use is reportedly being replaced by cheaper and more readily available prescription or over-the-counter preparations containing opioids. |74| The use of ATS, synthetic opioids and synthetic cannabinoids is also perceived to be increasing, particularly among the youth population. |75|
Oceania
Drug use information in Oceania is limited to Australia and New Zealand. No new data are available for 2012. The region has high levels of use of most substances: cannabis, 10.8 per cent; synthetic opioids, 3.0 per cent; cocaine, 1.5 per cent; ATS, 2.1 per cent; and "ecstasy", 2.9 per cent.
In Australia, expert opinion points to an increase in the consumption of cannabis, cocaine, hallucinogens, and solvents and inhalants, but a decline in the use of "ecstasy". There is a wide range of drug analogues and new psycho-active substances that are currently available in the Australian illicit drug market. |76|
In New Zealand, experts have reported that there has been an increase in the use of heroin, pharmaceutical opioids, prescription stimulants and synthetic cannabinoids. There has also been a diversification of new drugs available in a wide variety of forms: a range of synthetic drugs sold under the broad product name "ecstasy", a large number of new synthetic cannabinoids and new analogues of existing controlled drugs and so-called "research chemicals". |77|
Drug use and the financial crisis in Europe
The global financial crisis had, and continues to have, significant effects on joblessness and income inequality, as well as physical and mental well-being. |78| |79| |80| |81| Although European economies are recovering, |82| reductions in health services related to austerity measures have been observed, with 15 out of 19 countries in Europe reporting cuts to drug-related budgets ranging between 2 and 44 per cent. |83|
The "dark net", bitcoins and the increasing sophistication of online drug sales
The "Silk Road" in numbersa
Estimated number of registrants: 200,000
Total revenue from 2.5 years of operation: 9.5 million bitcoins (approx. $1.2 billion)
Top three items for sale: "weed", "drugs", "prescriptions"
Origin of sales: 44 per cent shipped from the United States, 10 per cent from the United Kingdoma Nicolas Christin, "Traveling the "Silk Road": a measurement analysis of a large anonymous online marketplace", see footnote 6. United States of America FBI Indictment against the alleged administrator of the "Silk Road" website.
The online marketplace for illicit drugs is becoming larger and more brazen, now capitalizing on technological advancements in private web transactions and virtual online currency to protect the identities of suppliers, consumers and website administrators. Buyers and sellers are connecting online via "dark net" sites |1| and most often, traffic drugs directly through the postal service. UNODC global seizure data indicate that over the past decade, there was a 300 per cent increase in cannabis seizures obtained through the postal service between 2000 and 2011, the majority of which are coming from seizures reported from countries in Europe and the Americas. |2|
The "dark net" cannot be accessed through traditional web searches; it requires logging in through a web proxy, such as to a Tor |3| network, which connects to another location in the network, ensuring that the Internet Protocol (IP) address is not visible on either side of the transaction. These websites do not function as stores per se but work in a manner similar to eBay, |4| where users and buyers can connect and are provided a venue to manage transactions and track fraudulent sales. Transactions are mostly conducted using the online peer-to-peer currency "bitcoin", which remains in escrow, until it is transferred to the seller once the product is satisfactorily delivered. At the time of this writing, 1 bitcoin was worth $625.
Several websites such as "Black Market Reloaded", "The Armory" and "The General Store", like the now defunct "Silk Road" website, sell a wide variety of products using this method. Despite the efforts to keep the site administrators, users and sellers unknown, 2013 saw the successful dismantling of several of these large-scale online drug trafficking operations, most notorious among them being the "Silk Road", which was seized by the Federal Bureau of Investigation of the United States, along with $28 million in bitcoins belonging to the administrator. |5|
While "Silk Road" sold approximately 24,400 drug products, websites such as "The Armory" have taken over broader elements of weapons and ammunitions trafficking after they were no longer available on the "Silk Road". |6| In a research paper on the user experience of the "Silk Road", an interviewee, after detailing his favourite purchases (good-quality cannabis, 3,4-methylenedioxymethamphet-amine (MDMA), and 2,5-dimethoxy-4-iodophenethyl-amine (2C-I)) stated that the "Silk Road" provided users with access to substances they otherwise would not have tried. |7|
While there are no reliable statistics on how many people are buying drugs on the Internet, the variety available and purchased on the "dark net" appears to be diverse and growing. Because purchases and sales through the "dark net" pose unique challenges for law enforcement and presents a niche market for high-quality drugs and new psy-choactive substances, if the past trend continues, it has the potential to become a popular mode of trafficking in controlled substances in years to come.
1 The term "dark net" refers to a distribution network of users, obscured by encryption technology, and anonymized by hidden IP addresses. "Dark nets" are niches within the "deep web", which includes network connected sites that are not searchable by major search engines.
2 UNODC, individual drug seizure database.
3 "TOR" is the acronym for "The Onion Router" and works by encrypting communications to relay Internet traffic through multiple proxies worldwide to mask users' locations and hide servers.
4 An online auction and shopping website in which people and businesses buy and sell a wide variety of goods and services worldwide.
5 United States, Federal Bureau of Investigation, "Manhattan U.S. Attorney announces seizure of additional $28 million worth of bitcoins belonging to Ross William Ulbricht, alleged owner and operator of "Silk Road" website", press release, 2013.
6 Nicolas Christin, "Traveling the "Silk Road": a measurement analysis of a large anonymous online marketplace", in Proceedings of the 22nd International Conference on the World Wide Web, International World Wide Web Conference Steering Committee (Geneva, 2013), pp. 213-224.
7 M. C. Van Hout and T. Bingham, "'Silk Road', the virtual drug marketplace: a single case study of user experiences", International Journal of Drug Policy, vol. 24, No. 5 (2013), pp. 385-391.Data are not yet available to explore the comprehensive impact of the crisis on drug markets, but early information describes two phenomena that have developed in parallel to the crisis: first, the reduction of services provided as a result of decreased funding, and second, a shift from more expensive to cheaper drugs (see below), and increased risk of harm due to the use of substances that require more frequent injections (see: HIV among people who inject drugs). While surveys on the number of problem drug users in many of the hardest hit countries are not yet available, experts expect the number of dependent users to remain stable. |84|
Shifting trends in patterns of drug use
In some of the countries most affected by the financial crisis, demand for heroin declined, as users shifted to cheaper drugs. For example, between 2008 and 2009 in Milan, Italy, decreases in cocaine and heroin, which are more expensive, were observed, but increases in metham-phetamine and cannabis, which are less expensive drugs, were noted. |85| In Romania, among people who inject drugs, a shift was observed, with 97 per cent interviewed in 2009 reporting heroin as the main drug of injection and in 2012, most respondents (49.4 per cent) reportedly injecting ATS (mostly synthetic cathinones) and only 38.1 per cent injecting heroin. |86| In Greece, increased injection of a cheap new stimulant-type drug called "sisa", has been reported. "Sisa" can be made in a kitchen from ephedrine, hydrochloric acid, ethanol and car battery fluid. |87| Widespread polydrug use also facilitated those shifts.
Drug-related crime (drug law offences)
According to available information, during the period 2003-2012, both the number of persons arrested/suspected for possession for personal use |88| and the number of users of illicit drugs increased: the former group by 31 per cent and the latter by approximately one fifth. Relative to the total population, the rate of persons arrested for or suspected of offences related to possession for personal use increased by 18 per cent, while the point estimate prevalence of drug users (as a percentage of the population in the 15-64 age bracket) has remained fairly stable.
Fig. 11. Comparison of growth in prevalence of illicit drug use and in per capita rate of persons recorded for personal drug use offences, 2003-2012
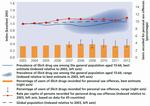
Click to enlargeSource: UNODC estimates based on annual report questionnaire supplemented by other official sources.
The increases in drug-related crime were also apparent in offences for drug trafficking, |89| while other kinds of crime declined. Although these indicators come with a large degree of uncertainty, they suggest that, over the period 2003-2012, the annual global proportion of drug users that was arrested for possession for personal use has fluctuated between 3 and 4 per cent. This suggests that the increase in crime rates for possession for personal use was due to the increase in the total number of drug users.
Comparing the relative importance of the various drugs in records of drug-related crime, cannabis is clearly the most prominent drug in cases of possession for personal use, followed by ATS (see figure 14).
Asia and the Americas both exhibit features which distinguish them from the prevalent global trend. In the Americas, cocaine follows cannabis as the second most prominent drug with respect to possession related to personal use, and was almost at par with cannabis (in first place) with respect to trafficking. In other regions, opioids or ATS take second place for possession related to personal use.
In Asia, illicit opioids offer some competition to cannabis as the most prominent drugs for possession related to personal use, and illicit ATS emerge as the most prominent for trafficking offences.
In Europe, illicit ATS ranked last among these four drug classes in terms of trafficking offences, despite being in second place (after cannabis) in terms of personal drug use offences.
Fig. 12. Global trend in crime rates per population for selected types of crime, 2003-2012
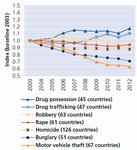
Click to enlargeSource: UNODC estimates based on United Nations Survey of Crime Trends and Operations of Criminal Justice Systems, UNODC Homicide Statistics, annual report questionnaire and European Monitoring Centre for Drugs and Drug Addiction.
Fig. 13. Female offenders among persons recorded for drug-related offences, by drug class and type of offence, 2012
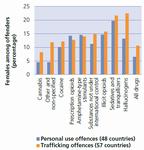
Click to enlargeSource: UNODC estimates based on annual report questionnaire.
Fig. 14. Share of the four major drug classes in drug offender records, by region and globally, 2012
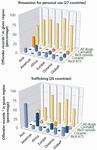
Click to enlargeSource: UNODC estimates based on annual report questionnaire.
a Since a given offender can be recorded in connection with different drugs, the percentage of records given does not necessarily coincide with the percentage of offenders. In addition, offenders recorded in connection with other substances are not included in the graph. Hence the total may not add up to 100 per cent.
b Average of the five regions, weighted by the estimated number of offenders (for all drug types) in each region.An analysis of the gender make-up of persons recorded for drug-related offences indicates that the population apprehended for using controlled substances tends to be predominantly male, in keeping with the picture that emerges from drug use data. The same is true for trafficking. For all drug classes and with respect to both possession for personal use and trafficking offences (separately), less than one quarter of offenders were female. However, that proportion of female offenders varied significantly for the various drug classes, with the category of sedatives and tranquillizers standing out as the one with relatively high proportions of females, for both possession for personal use and trafficking offences. This conforms with drug use data for women.
The proportion of female offenders tended to be higher for trafficking offences than for possession related to personal use, but typically only marginally so, and still far below 50 per cent. Moreover, the relative importance (ranking) of each drug class, in terms of frequency of offending by females, was quite similar for trafficking and drug-use offences.
Cultivation and production
The global area under illicit opium poppy cultivation in 2013 was 296,720 hectares (ha), the highest level since 1998 when estimates became available. An increase in cultivation was seen in both Afghanistan and Myanmar. The main increase was observed in Afghanistan, where the area of opium poppy cultivation increased 36 per cent, from 154,000 ha in 2012 to 209,000 ha in 2013. The main area of cultivation in Afghanistan was in nine provinces in the southern and western part of the country, while the major increase was observed in Helmand and Kandahar. |90| In Myanmar, the increase in the area of cultivation was not as pronounced as in Afghanistan.
In South-East Asia, the total area under cultivation in the Lao People's Democratic Republic in 2013 was estimated as 3,900 ha (range: 1,900-5,800 ha). However, the 2013 estimates are not comparable with the estimates of 2012 due to the varying methodology in the use of high-resolution satellite images and time of conducting the helicopter survey. |91| Myanmar continued the trend of increasing cultivation that began after 2006. |92| (See tables in annex I for details on opium poppy cultivation and production in the different countries and regions).
The potential production of opium in 2013 is estimated at 6,883 tons, which is a return to the levels observed in 2011 and 2008. The opium production in Afghanistan accounts for 80 per cent of the global opium production (5,500 tons). The potential production of heroin (of unknown purity) has also increased to 560 tons, comparable to 2008 estimates of 600 tons (see figure 16).
Seizures
Globally, seizures of heroin and illicit morphine went down 19 per cent in 2012. The main declines in opiate seizures were reported in South-West Asia and Western and Central Europe, where seizures declined by 29 per cent and 19 per cent, respectively (from 117 tons in 2011 to 82 tons in 2012 in South-West Asia, and from 6 tons in 2011 to 4.85 tons in 2012 in Western and Central Europe). A substantial increase in heroin seizures, however, was reported in Eastern and South-Eastern Europe (15.98 tons in 2012 compared with 9.88 tons in 2011), mainly as a result of increased quantities reported seized in Turkey. Heroin seizures also increased substantially in Australia and New Zealand (1.09 tons in 2012 compared with 0.61 tons in 2011) and in South Asia (1.3 tons in 2012 compared with 0.723 tons reported in 2011). In North America, heroin seizures declined by 58 per cent in Mexico but increased in the United States, to 5.5 tons in 2012, compared with 4.8 tons in 2011. However, overall heroin seizures in North America have remained stable over the previous year.
Fig. 15. Opium poppy cultivation and eradication in Afghanistan, 1997-2013
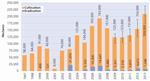
Click to enlargeSource: 1997-2002: UNODC; since 2003: National Illicit Crop Monitoring System supported by UNODC.
Fig. 16. Global potential opium production, 1998-2013
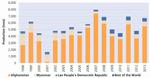
Click to enlargeSource: 1997-2002: UNODC; since 2003: National Illicit Crop Monitoring System supported by UNODC.
Fig. 17. Seizures of heroin and illicit morphine, in selected countries and by region, 2003-2012
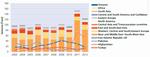
Click to enlargeSource: UNODC data from annual report questionnaire and other official sources.
Extent of use
Past-year use of opioids, including heroin and prescription painkillers, is estimated at between 28.6 and 38 million people globally. Compared to the global average prevalence of 0.7 per cent, opioid use remains high in North America and Oceania, with prevalence rates of 4.3 per cent and 3 per cent respectively. While opioid use has increased globally over the past year, the main increase has been observed in the United States. Although recent and reliable estimates are not available from Asia and Africa, many experts from countries in those regions also perceive an increase in opioid use. The use of opiates (heroin and opium), however, remained stable globally, with 12.8 million to 20.2 million past-year users. Opiate use at levels much higher than the global average of 0.4 per cent remain in SouthWest Asia (1.21 per cent), Eastern and South-Eastern Europe (0.82 per cent) and in Central Asia and Transcaucasia (0.81 per cent).
Opiates: market analysis
In comparison with other plant-based drugs, the global market for illicit opiates is perhaps the most complex. In contrast to cannabis, illicit cultivation and production feeding the illicit opiate market are limited to certain countries and regions. Consequently, illicit opiates are necessarily trafficked across large distances and through multiple countries in order to meet demand. In contrast to coca bush, illicit cultivation of opium poppy occurs on a significant scale in at least three geographically distinct areas -- South-West Asia, South-East Asia and Latin America.
Moreover the historical delineations whereby the supply of illicit opiates in a given consumer market could be assumed to originate in one of those source regions -- rather than from several -- have blurred, with trafficking routes diversifying accordingly. Moreover, demand for illicit opiates is widespread and cannot be assumed to be concentrated in certain regions. These layers of production and consumption are intertwined. For instance, opium is consumed as is and further used to manufacture morphine, which is then used in the manufacture of heroin. Furthermore, opiates and other opioids, chemically and pharmacologically very similar, are also widely available and used as licit pharmaceutical products, resulting in an interplay that may involve diversion from licit to illicit markets at various stages of the supply chain.
Long-term assessment
In spite of the apparent complexity and the fluctuations in key supply indicators, a long-term perspective (taking 1991 as a starting point) reveals some elements of stability in the underlying fundamental indicators at a global level. As of the early 1990s, opium poppy was predominantly cultivated in South-East Asia; following a significant decline in that region, cultivation in Afghanistan increased significantly (reaching a record level in 2013), and cultivation returned to an increasing trend, as of 2007, in Myanmar. Global cultivation reached a low around 2005 and in 2013, returned for the first time to a level comparable to the high level of 1991 (even exceeding it by a small margin). However, owing to the typically higher yields in South-West Asia (disregarding transitory year-on-year fluctuations attributable to environmental factors), the overall trend over the period 1991-2013 was one of increasing production of opium poppy, even if the sharp increase in Afghanistan in 2013 is excluded.
Over the same period, seizures of illicit opiates worldwide (aggregated by assuming a conversion factor of approximately 10 kg of opium per 1 kg of heroin) increased quite steadily. This increase has a significant impact on global supply of opiates. UNODC estimates indicate that the ratio (sometimes referred to as the "interception rate") of seizures of opiates to illicitly produced opiates present in the illicit market (both expressed in opium equivalents) increased from 4-9 per cent in 1991 to 18-30 per cent |93| in 2012.
With respect to the demand side, the earliest UNODC estimates of global consumption date to the late 1990s.
Those estimates have always been produced on the basis of the latest available data, using a methodology that was being continually updated, and are therefore not strictly comparable. Nevertheless, they indicate a generally stable trend in terms of prevalence rate of annual use. However, since the global population has also been increasing, this means that there has been an increase in the number of users. That growth in demand appears to be weaker than the growth in supply. However, the growth trend in supply moves closer to the growth trend in demand once seizures are taken into account. Further, these estimations do not take into account any possible losses that may occur in times of excess production. If such losses did occur, it would suggest that the appropriately adjusted trend in supply would move even closer to the trend in demand. Even without that additional adjustment, and notwithstanding the large degree of fluctuation and uncertainty inherent in these estimates, the available supply of opiates (net of seizures) per opiate user appears to have increased only marginally, if at all, over the period 1998-2012.
Numerically, it would appear that the impact of opiate seizures by law enforcement authorities worldwide, while becoming more discernable in the big picture, had the effect of bringing the apparently strong growth in supply more in line with the growth in demand, which increased more slowly than opium production. However, it is not a foregone conclusion that there is in fact a causal relationship; it could possibly be the outcome of supply adjusting to the circumstances in order to keep meeting demand. In other words, one possibility is that the available supply was contained as a consequence of seizures, but the opposite cannot be excluded: that production adjusted to correct for seizures so as to keep supply stable. Most importantly, this picture is an assessment of the end result, but it is difficult to ascertain, for the purposes of comparison, what would have happened had the efforts of the international community been different. Moreover, it is important to note that the estimates on drug use are based on limited data and therefore subject to a high degree of uncertainty.
Recent trends
Although global supply and demand may be evening out globally in the long term, the illicit market for opiates is far from static, especially when shorter-term trends are taken into account. There is growing evidence of significant changes in the flows of heroin out of Afghanistan, of heroin from Afghanistan becoming more available in consumer markets other than the long-established European destinations, and of the interplay between the illicit and licit markets for opioids (including opiates).
Fig. 18. Evolution of main opiate supply and supply reduction indicators, 1991-2013
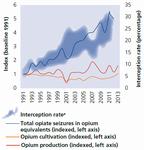
Click to enlargea The practical significance of the "interception rate" should be approached with caution, as this concept is ultimately an abstract ratio which, depending on the context, may not always be intuitive (see footnote 93).
Source: UNODC estimates based on annual report questionnaire and national illicit crop monitoring systems supported by UNODC, supplemented by other official data.Fig. 19. Comparison of growth rates in supply of and demand for illicit opiates, 1998-2012
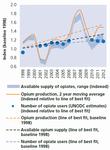
Click to enlargeSource: UNODC estimates based on annual report questionnaire and national illicit crop monitoring systems supported by UNODC, supplemented by other official data.
Fig. 20. Global prevalence of illicit opiate use and supply of illicit opiates per user, 1998-2012
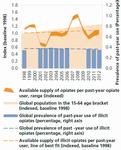
Click to enlargeSource: UNODC estimates based on annual report questionnaire, national illicit crop monitoring systems supported by UNODC and UNPD population data, supplemented by other official data.
Note: Comparable data is not available for 1999, 2000 and 2007-2009.European markets and their relationship to Afghanistan
It appears that the flow of heroin along the long-established Balkan route, from Afghanistan to Western and Central Europe via Iran (Islamic Republic of) and Turkey, has declined in recent years. Various factors may have contributed to the decline in seizures along this route, including the success of law enforcement authorities in key transit countries and a decline in demand in the destination market.
Based on UNODC estimates, the number of past-year users of opiates in Western and Central Europe may have declined by almost one third between 2003 and 2012 (from 1.6 million to 1.13 million). This is also observed for example, in the data from Germany, where the number of people arrested for the first time for heroin use fell steadily between 2003 and 2012 -- overall, by more than one half. Even so, in 2011 and 2012, there may have been a certain deficiency in the available supply of heroin (which may yet be corrected), as the purity-adjusted price of heroin underwent a distinct transition between 2010 and 2011, and maintained the increased level in 2012. Indeed, the decline in heroin flowing on the Balkan Route appears to have been too sudden to be accompanied by a corresponding drop in demand. The ensuing shortfall may have helped trigger the development of routes serving as alternatives to the Balkan route -- whose emergence is suggested by other evidence -- to supply Europe, possibly via the Near and Middle East and Africa, as well as directly from Pakistan, suggesting that the so called Southern Route is expanding. |94|
Fig. 21. Heroin seizure trends in key countries and regions along the Balkan and northern routes, compared with heroin seizure trends in Pakistan and opium production in Afghanistan, 2003-2012
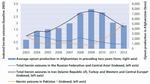
Click to enlargeSeizure data: UNODC annual report questionnaire supplemented by other official data.
Production: National illicit crop monitoring system supported by UNODC.
a Taken as representative of the northern route.
b Taken as representative of the Balkan route.
c Possibly representative of the southern route.Fig. 22. Heroin seizures in key locations along the Balkan route and prominence of Turkey as a transit country for heroin, 2002-2012
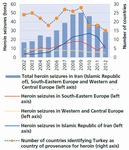
Click to enlargeSource: Seizure data: UNODC annual report questionnaire supplemented by other official data.
Fig. 23. First-time arrestees for heroin use in Germany, 2003-2012

Click to enlargeSource: Germany Bundeskriminalamt.
In the replies to the annual report questionnaires for the reporting years 2002-2011, Africa was only sporadically indicated as a region of provenance for heroin reaching Europe; in contrast, in 2012, East Africa which had previously never been identified by a European country as an area of provenance, was among the more prominent such regions in terms of number of mentions, following the Near and Middle East/South-West Asia (including Afghanistan) and South-Eastern Europe (including Turkey). Among East-African countries, the United Republic of Tanzania, which throughout the period 2010-2012 registered annual levels of seizures significantly higher than in previous years, appears to be the most prominent as a country of provenance, although Ethiopia, Kenya and Uganda were also mentioned. Italy in particular appears to be affected by this flow to a significant extent.
Fig. 24. Heroin retail prices in Western and Central Europe and the United States, 2003-2012
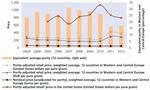
Click to enlargeSource: For European countries, UNODC annual report questionnaire, EMCDDA, European Police Office (Europol). For the United States, Office of National Drug Control Policy, United States.
a For 2003 and 2004, comparable price data for the United States were unavailable.
b Purchases recorded in the System to Retrieve Information from Drug Evidence (STRIDE) database of the United States Drug Enforcement Agency.Fig. 25. Number of cases of heroin being seized from air passengers recorded in selected European airports with selected countries of provenance, 2007-2012
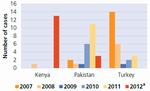
Click to enlargeSource: Database on illicit drug seizures with relation to European airports IDEAS, German Customs.
a Data for 2012 were incomplete.In an analysis of 120 cases in the period June 2006-October 2012 in which heroin was seized from air passengers on itineraries involving Europe, |95| Pakistan was the second most cited country of provenance, second only to Turkey and followed by Kenya. While the role of Turkey as a transit country appeared to be on the decline over that time period, the cases involving Kenya related almost exclusively to the year 2012. In addition to European countries, other countries from Africa, including East and West Africa, as well as the Near and Middle East, also appeared as countries of provenance in those itineraries.
Data on individual heroin seizure cases |96| from Pakistan up to the first quarter of 2012 also confirm a recently increasing frequency of use of airports in Europe (notably the United Kingdom), the Near and Middle East (notably, in 2012, Oman and Saudi Arabia) and Bangladesh (although that increasing mention of Bangladesh was offset by decreasing mention of other countries in South Asia) as a destination for heroin couriers leaving Pakistan by air. However, consignments trafficked via passenger aircraft are necessarily small, and it is not clear to what extent such trafficking can affect the flow of heroin; these emerging patterns are likely most significant to the extent that they reflect a broader tendency to source heroin from a given region using maritime or land transportation. The number of heroin seizure cases involving sea transport reported by Pakistan was much more limited; however, since 2009 the only such cases with a known destination were predominantly of shipments being sent to West and Central Africa, with all others destined for Western and Central Europe.
A distinct market for heroin, also supplied for several years by heroin from Afghanistan, is that of Eastern Europe, where the levels of opiate use are significantly higher than the global average. The Russian Federation remains a major consumer market for illicit opiates, with significant quantities of heroin flowing northwards from Afghanistan via Central Asia. A marked increase in total heroin seizures in the Russian Federation and Central Asia together (representative of that northern route) was observed between 1998 and 2004. Since then, overall seizures declined, but it is plausible that the increased availability may have stimulated a demand for opioids, which was met by alternative sources when the influx of heroin subsequently declined. If that is the case, it would be yet another instance of the interaction between the licit and illicit markets for opioids. In 2011 and 2012, |97| in addition to seizures of heroin, the Russian Federation reported seizures of desomorphine -- a substitute for heroin that can be derived relatively easily from pharmaceutical products -- amounting to 100 kg in 2011 and 95 kg in 2012. Although these quantities are small in comparison with the quantities of seized heroin, in terms of number of cases, in 2012 there was approximately one desomorphine seizure for every three heroin seizures in the Russian Federation. (For comparison, in 2011, there had been approximately three desomorphine seizures for every four heroin seizures in that country.) The fact that the average quantity per seizure of desomorphine was low (8.2 g in 2012 and 3.5 g in 2011, compared with 65 g of heroin in 2012 and 55 g in 2011) confirms that desomorphine is typically home-made and not usually trafficked in large quantities.
Other markets and new flows through Pakistan
Approximately one fifth of illicit opiate users worldwide live in the subregion of the Near and Middle East/South-West Asia, in spite of the fact that the region accounts for only 6 per cent of the global population aged 15-64 years. Although opiate use, particularly the use of opium, is not new in that region, it is plausible that the high levels of production in Afghanistan may have brought about an increase in the use of opiates (and, by association, possibly other opioids) close to this major source of illicit opium. In Pakistan, the annual prevalence of regular opiate use is estimated to have risen from 0.7 per cent in 2006 to 1.0 per cent in 22013. |98| With reference to the period 21 March 2011-19 March 2012, |99| experts in the Islamic Republic of Iran, a country with relatively high rates of opium use, perceived an increase in both opium and heroin use.
Fig. 26. Ranking of past-year use of illicit opiates by subregion, based on prevalence and number of users, 2012
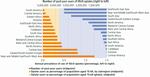
Click to enlargeSource: UNODC estimates based on annual report questionnaire and UNPD population data, supplemented by other official sources.
With respect to Afghanistan, a recent study |100| conducted by the United States Government found high (in comparison with other countries) levels of use or exposure in the urban population of Afghanistan (overall and among both men and women), with 2.6 per cent of the urban test population (of all ages) testing positive for opioids (including pharmaceutical opioids). Users of opioids in the form of opium and heroin were predominantly men, while women predominantly used codeine. Even a relatively high proportion of children tested positive for opioid use (including heroin): the study indicates that some 1.3 per cent of urban children were exposed to an opioid present in their physical environment or had been given the drug by an adult.
Although the annual prevalence of use of illicit opiates in East and South-East Asia is estimated to be significantly below the global average, this subregion accounts for approximately one fifth of all users globally, mainly by virtue of the large population of China. In the past, the heroin market in China was supplied mainly from South-East Asia; although Myanmar in particular continues to be a major source country for heroin reaching China, it appears that around 2006, a surplus of heroin from Afghanistan started to find its way to China, via Pakistan and other countries in South-East Asia. |101| By 2007, the number of registered heroin users in China, which had declined in 2005, was on the increase, and heroin seizures in China followed a similar pattern, with a slight delay, which could be attributable to a time lag as law enforcement authorities adjusted their efforts to the changing flow.
This evidence does not immediately translate into a conclusion that heroin use in China is on the rise, especially since some of these indicators could reflect drug supply and demand reduction efforts rather than supply itself; indeed, the latest UNODC estimates suggest that annual prevalence of opiate use in China (in 2012) is lower than previously thought (0.19 per cent of the general population aged 15-64, compared with 0.25 per cent in 2005). However, it seems clear that the share of heroin in the Chinese market originating in South-West Asia continues to increase, as has also been indicated by Chinese authorities, |102| who detected 98 instances of heroin trafficking from South-West Asia in 2012 and 148 cases in 2013. |103| Heroin seizures in the Chinese province of Yunnan (bordering Myanmar), continued to increase, reaching 5.4 tons in 2012, constituting 74 per cent of the total for China for that year. It is likely that these quantities originate in Myanmar, in line with the increasing trend in opium poppy cultivation in this country in recent years.
More broadly, South-West Asia (or countries therein) has recently been mentioned as a source of heroin with increasing frequency by countries in South-East Asia, including Indonesia and Malaysia, both of which have registered increasing heroin seizures since 2006. Malaysia in particular has a significant market for heroin, with a relatively high level of heroin use (although declining according to expert perception |104|), and an increasing inflow of heroin, trafficked via sea and air cargo, facilitated by groups with ties to Pakistan (possibly in collusion with West African groups active mainly in Malaysia in the trafficking of methamphetamine and cocaine) and intended for both the local market and for onward trafficking. |105|
Nevertheless, the main source for heroin in Malaysia likely continues to be Myanmar. |106| In addition to heroin, it appears that the use of morphine is, or at least was in 2010, widespread in Malaysia; moreover, in recent years, authorities have dismantled a number of clandestine laboratories processing heroin (seven in 2011), apparently producing a low purity end product. |107| |108| The fact that heroin seizures in Pakistan have increased markedly since 2009, independently of the trend in opium production in Afghanistan and in contrast to seizures in key countries along the Balkan and northern routes, suggests a major transformation in the flows out of Afghanistan, with Pakistan playing an important role.
Given the extensive coastline of Pakistan on the Indian Ocean and that maritime channels generally provide the possibility of trafficking large quantities over long distances, it is likely that significant quantities of heroin are trafficked by sea out of Iran (Islamic Republic of) and Pakistan. Seizures by the Pakistan Anti-Narcotics Force (one of several law enforcement agencies in Pakistan) at seaports reached almost 1.2 tons in 2013, more than double the annual amounts throughout the period 2010-2012. |109| Reports of individual seizure cases also corroborate those maritime patterns of heroin trafficking. Based on a limited number of officially reported seizures of heroin consignments known to have been trafficked by sea, the proportion of total weight seized in cases for which Pakistan was mentioned as a country of provenance (including seizures made by authorities of Pakistan) rose sharply to a record level in 2009 and since then, has remained higher than in any prior year. In terms of the number of seizures, the increase was more gradual, but the proportion also climbed to record levels in 2010 and 2011. Further information from national law enforcement agencies |110| and international forces on specific, particularly significant seizures in the Indian Ocean, as well as in seaports and coastal regions in Africa, reinforces the evidence that heroin is being transferred for maritime conveyance on the southern coast of Iran (Islamic Republic of) and Pakistan. Laboratory analysis of several large heroin seizures (at least five seizures in excess of 100 kg each) in 2012 and 2013 made by the Combined Maritime Forces |111| in international waters have confirmed that Afghanistan is the country of origin for the heroin trafficked in those cases. |112|
Fig. 27. Indicators of heroin use and supply in China, compared with selected indicators of opiate supply in South-West Asia, 2002-2012
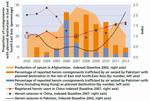
Click to enlargeSource: UNODC annual report questionnaire, National illicit crop monitoring system in Afghanistan supported by UNODC, UNODC IDS database, Office of the National Narcotics Control Commission of China (annual reports).
India, with almost 18 per cent of the world's population in the 15-64 age bracket, is exposed to illicit opiates originating in both South-East Asia and South-West Asia. According to Indian authorities (i.e. country report submitted by India to Thirty-seventh Meeting of Heads of National Drug Law Enforcement Agencies, Asia and the Pacific, and the reply submitted by India in response to the 2011 UNODC annual report questionnaire) heroin from South-West Asia reaches India across the India-Pakistan border and tends to be trafficked onward to destinations such as Europe, the United States and South-East Asia. These destinations are presumably more lucrative markets than India, given the relatively low price of heroin in India (reported to be the equivalent of $8.6-$13 per gram, as of 2011, compared with a range of $100-$400 per gram of heroin from South-West Asia in the United States and an average price, taken from 17 countries in Western and Central Europe and weighted by population, of $72, both in the same year). The share of heroin of South-West Asian origin as a proportion of total heroin seizures in India in 2011 was assessed at 45 per cent, while most of the remainder (54 per cent) originated in India itself (according to information submitted by India in the annual report questionnaire).
Moreover, Indian authorities also indicate illicit cultivation of opium poppy in some pockets within India, suspected diversion of opium from licit cultivation and manufacture of "brown sugar" (also referred to as "low-quality heroin") indigenous groups. |113| |114| Thus, it appears that the consumer market in India is mainly supplied by heroin of domestic origin, quite plausibly derived from a minor proportion of licitly produced opium diverted into the illicit market.
Access to pain medication As stated in the International Narcotics Control Board (INCB) annual report for 2009, "One of the fundamental objectives of the international drug control treaties is to ensure the availability of narcotic drugs and psychotropic substances for medical and scientific purposes and to promote the rational use of narcotics drugs and psychotropic substances".
While opioids are essential in the management of pain experienced by millions of people who might be suffering from late-stage cancers, AIDS, surgical procedures and other debilitating diseases and conditions, |1| they are also susceptible to abuse. |2| This means that countries face the challenging task of balancing two public health needs: ensuring the availability of these controlled substances for medical purposes and preventing their misuse and diversion.
Many countries have expressed concern about misuse, and available data show a high prevalence of misuse of prescription opioids in some countries. This includes the high-income countries, |3| such as Australia, Canada and the United States that have high per capita consumption of opioids for medical purposes, and even lower-middle-income countries such as Nigeria and Pakistan, which have the lowest per capita consumption of opioids for medical purposes. |4| That suggests that the dynamics of misuse of prescription opioids does not necessarily follow making opioids accessible or available for medical purposes. |5|
As a response to potential or real misuse of these medicines, many countries, contrary to the provisions of the drug control conventions, have laws and regulations that are unduly restrictive or burdensome, |6| resulting in a situation where a large part of the population does not have access to most of the opioid medications commonly used for the treatment of pain and dependence syndrome. |7|
Globally, in 2011, the opioid consumption for medical purposes in morphine equivalence (ME) per person was 61.66 milligrams (mg) per person. |8| |9| This comprises six main opioids: fentanyl, hydromorphone, methadone, morphine, oxycodone and pethidine. However, there is a great disparity among levels of consumption and accessibility of pain medications. The high-income countries, which comprise 17 per cent of the global population, account for 92 per cent of the medical morphine consumed, whereas more than half of the countries that reported to INCB in 2011 had consumption levels of less than 1 mg of morphine per person.
Comparison of per capita opioid consumption in morphine equivalence among lowest and highest consumption countries, 2011
Lowest consumption countries
(mg per capita of morphine equivalence)Highest consumption countries
(mg per capita of morphine equivalence)Nigeria 0.0141 Canada 812.1855 Myanmar 0.0152 United States 749.7859 Pakistan 0.0184 Denmark 483.1678 Australia 427.1240 Source: Pain and Policy Studies Group, University of Wisconsin-Madison.
A survey conducted by INCB in 2011 found that the laws and regulations in place for control of pain medications in many countries were unduly restrictive or burdensome and were perceived to be a significant limitation on availability. Other impediments to accessibility to pain medication included insufficient training of health-care professionals in the recognition and management of pain, and economic and procurement impediments such as deficiencies in drug supply management due to low financial resources or low priority given to health care, among other areas.
1 WHO, Ensuring Balance in National Policies on Controlled Substances: Guidance for Availability and Accessibility of Controlled Medicines (Geneva, 2011).
2 UNODC, discussion paper based on a scientific workshop, entitled " Ensuring availability of controlled medications for the relief of pain and preventing diversion and abuse: striking the right balance to achieve the optimal public health" (Vienna, 2011).
3 Based on the World Bank classification of income levels and development.
4 The annual prevalence of misuse of prescription opioids is as follows: Australia, 3.1 per cent; Canada, 1 per cent; Nigeria, 3.6 per cent; Pakistan, 1.5 per cent; and United States, 5.2 per cent.
5 B. Fischer and others, "Non-medical use of prescription opioids and prescription opioid related harms: why so markedly higher in North America compared to the rest of the world?" Addiction, vol. 109, No. 2 (February 2014), pp. 177-181, and the related debate.
6 Report of the International Narcotics Control Board on the availability of internationally controlled drugs: ensuring adequate access for medical and scientific purposes (United Nations publication, Sales No. E.11.XI.7), para. 131.
7 UNODC, discussion paper entitled "Ensuring availability of controlled medications for the relief of pain".
8 INCB data on global per capita opioid consumption, 2011.
9 Pain and Policy Studies Group, "Global opioid global consumption, 2011" (University of Wisconsin-Madison), available at www.painpolicy.wisc.edu/2011-global-regional-and-national-opioid-consumption-statistics-now-available.Moreover, heroin originating in India also reaches other countries in South Asia, such as Bangladesh and Sri Lanka, although the flow to Sri Lanka has reportedly declined, |115| and both those countries have long indicated South-West Asia as being among the sources for heroin reaching their territory. |116|
In Africa, aside from its increasing role as a transit area, |117| the number of past-year users of opiates is estimated at between 0.92 million and 2.29 million. That broad range is a consequence of the paucity of data from African countries, which also extends to data from law enforcement authorities. The estimated annual prevalence of heroin use in West and Central Africa is above the global average, those subregions being long associated with small-scale trafficking by air, notably through Nigeria. |118| Based on the latest available responses to the annual report questionnaire, South Africa is also believed to be a major consumer market, deriving its heroin supply from South-West Asia via East Africa and the Near and Middle East.
In Oceania, the annual prevalence of opiate use is relatively low. However, the annual prevalence of opioid use in Oceania is estimated to be more than four times the global average. According to Australian authorities, |119| in 2011 and in the first six months of 2012, approximately one half of heroin samples from seizures analysed by the Australian Federal Police were of South-West Asian origin.
According to the United States, in 2012, the availability of heroin continued to increase in that country, likely due to high levels of heroin production in Mexico and Mexican traffickers expanding into "white heroin" markets. |120| Some metropolitan areas in the United States experienced an increase in heroin overdose deaths. Apart from heroin originating in Latin America, heroin from South-West Asia may be reaching the North American market in larger quantities. Canada, which continues to identify Pakistan and India as being among the prominent countries of provenance for heroin reaching its market, mentioned an increase in the number of heroin seizures from couriers on commercial airlines in the latter part of 2012 and in early 2013, and reported that this could be due to a resurgence in the use of heroin across Canada, as well as possible export to other countries, such as the United States. |121| However, the United States has not reported a significant flow of heroin from Canada. India and the United States both indicated that there was a flow of heroin from India to the United States; it is plausible that the flow of heroin reaching North America from India, while probably still small in relation to the size of the North American consumer market, is of South-West Asian origin (as discussed above).
In Latin America, despite illicit cultivation of opium poppy in some countries and the manufacture of heroin in Colombia and Mexico, destined mainly for the United States, the prevalence of opiate use is relatively low. South America, Central America and the Caribbean collectively accounted for less than 3 per cent of global seizures of heroin in 2012.
The interplay between illicit and pharmaceutical opioid use
At the heart of opioid addiction is the powerful rewarding effect that occurs when the active compound binds to the �-opioid receptor, triggering a cascade of intense pleasurable responses related to the brain dopamine release. Users describe an initial rush followed by feelings of warmth, pleasure and sedation. |122| Once regular use is established, vulnerable individuals develop an uncontrollable compulsive behaviour that is the main characteristic of opioid dependence, seeking to obtain the substance in spite of any negative consequence.
The rewarding effect is progressively modulated by tolerance until a point at which people using the opioid no longer obtain a reward but are aiming to re-establish a "normal" mood. The entire reward system is hijacked by the opioid substance, with motivational reactions no longer being driven by normal life rewards or salient stimuli but by the opioid. Once established, that mechanism is stable and persistent because it is related to significant changes in the expression of the genes of the brain cells.
Fig. 28. Price of heroin and past-month prevalence of use of OxyContin and heroin in the United States, January 2006-December 2012
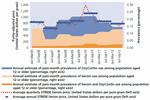
Click to enlargeSource: Office of National Drug Control Policy, US Government and data from National Surveys on Drug Use and Health (NSDUH) of the Substance Abuse and Mental Health Services Administration and extracted from SAMHDA (Substance Abuse and Mental Health Data Archive) hosted by the Inter-university Consortium for Political and Social Research at the University of Michigan.
The use of multiple opioids is common among dependent users, who may choose one or the other depending on factors such as the local accessibility, availability and price of the opioids.
In the United States, where over 5 million people abused prescription pain relievers in 2010, |123| those with the most severe dependency on pharmaceutical opioids were found to be 7.8 times more likely to have used heroin in the past year. |124| In 2012, people in the United States who had ever used heroin were almost five times more likely to have used pain relievers, for other than medical purposes, than people in the general population, and about one third had misused OxyContin, a commercial brand of oxycodone. Conversely, among people who had ever used OxyContin, almost one quarter had also used heroin. |125| Another study compared admissions rates for overdoses from prescription opioids and heroin between the years 1993 and 2009 and found that overdose from one strongly predicted an overdose from the other -- evidence that the markets of heroin and prescription opioids are strongly interconnected. |126|
In the United States, the shift in the opioid market towards heroin is also evidenced by high availability and lower prices of heroin. Also, fluctuations in the heroin market, reflected in the price of heroin since 2007, appear to have compensated for the use of other opioids, notably OxyContin, with the price of heroin correlating strongly with the past-month use of OxyContin (see figure 28).
In line with these findings, according to the United States Drug Enforcement Agency, law enforcement officials nationwide have noted prescription opioid abusers switching to heroin because it was cheaper and/or more easily obtained than prescription drugs. Given the variable levels of heroin purity, the replacement of heroin with prescription opioids is also fraught with risks of overdose. In several places in the United States, heroin overdoses have increased substantially. For example, in Minneapolis-Saint Paul, overdoses tripled in the span of one year, rising from 16 overdoses in 2010 to 46 overdoses in 2011. |127|
These changes in the heroin market have been concurrent with national measures to control the misuse of prescription drugs. In 2010, OxyContin was modified to make it a controlled-release formulation so that it could no longer be crushed and snorted or injected. Tangible impacts of these measures can also be seen in a study over the transition period (2009-2011), during which OxyContin users were found to be switching to other opioids, including heroin. A United States-based study of 2,566 patients undergoing treatment for opioid dependence before and after the formulation change found that it had led to a decrease in OxyContin misuse among the clients (from 35.6 per cent to 12.8 per cent), but as a replacement, fen-tanyl and hydromorphone use went up and heroin use had doubled. |128|
Fig. 29. Correlation of heroin use versus OxyContin use in the United States, past-month prevalence among population aged 12 or older, 2006-2012
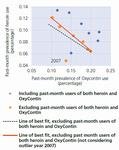
Click to enlargeSource: UNODC estimates based on data from National Surveys on Drug Use and Health (NSDUH) of the Substance Abuse and Mental Health Services Administration and extracted from SAMHDA (Substance Abuse and Mental Health Data Archive) hosted by the Inter-university Consortium for Political and Social Research at the University of Michigan.
In contrast, the declining availability of heroin in parts of Europe appears to have resulted in an increase in the use of prescription opioids. In Estonia, over the past decade, injecting drug users have switched from home-made opiates and heroin to illicitly manufactured fentanyl and amphetamine: |129| in 2012, 87.5 per cent of the clients in treatment listed fentanyl as their primary drug. |130| Also, between 2011 and 2012, there was a 38 per cent increase in overdose deaths in Estonia, 80 per cent of which were related to fentanyl and its derivatives. |131| INCB now reports that fentanyl and buprenorphine have displaced heroin in Estonia and Finland. |132| Similarly, in the Russian Federation, decreased availability of heroin led to its partial replacement with local and readily available substances such as acetylated opium and desomorphine, a home-made preparation made from over-the-counter medicines containing codeine. |133|
A similar trend can be observed in Australia and New Zealand. In 2001, the heroin market in Australia underwent a supply drop and a consequent change in consumption patterns, |134| in which most indicators of heroin use declined and some consumers resorted to prescription opioids as a substitute. In particular, use of oxycodone increased significantly, displacing morphine in some cases. |135| A comparison of price data for heroin and oxycodone in Queensland, Australia, in 2011 and 2012 shows that a tablet containing 60 mg of oxycodone cost 20-30 Australian dollars, while an equivalent amount of heroin at retail prices would have cost 40-50 Australian dollars. |136| Price data from New Zealand suggest that domestically produced "home bake" -- a locally produced substance made from a chemical process involving prescription painkillers -- remains a cheaper alternative to costly imported heroin. |137|
These trends in the overlap of heroin and prescription opioid use can be observed in other regions for which limited data are available. In Afghanistan, a survey in urban households showed that over half the women surveyed who reported opioid use (64 per cent) were combining heroin and/or opium with pharmaceutical painkillers, and 9 per cent of opioid-using women used only a prescription opioid. |138| In recent years, the misuse of tramadol (a lower potency opioid) has also been reported. |139| in parts of Africa, the Middle East and Asia.
What is clear is that the people who are dependent on opioids will move between the different opioids, interchanging one for another, all the while increasing their risks of serious health consequences. However, in the presence of accessible and evidence-based treatment, the situation can be prevented, while supply reduction efforts alone are likely to induce a balloon effect where one controlled substance is replaced by another.
Cultivation and production
Fig. 30. Coca bush cultivation 2003-2012
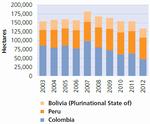
Click to enlargeSource: Bolivia: 2002: CICAD and US Department of State, INCSR. Since 2003: National Illicit Crop Monitoring System supported by UNODC. Colombia: National Illicit Crop Monitoring System supported by UNODC. Peru: National Illicit Crop Monitoring System supported by UNODC.
Coca bush cultivation, which remains limited to Plurina-tional State of Bolivia, Colombia and Peru, continued to decline in 2012 with the net area under coca bush cultivation on 31 December 2012 totalled 133,700 ha, a decline of 14 per cent from the previous year's estimates and the lowest levels since the beginning of available estimates in 1990. That decline was driven mainly by a 25 per cent decline in coca bush cultivation in Colombia, from an estimated 64,000 ha in 2011 to 48,000 ha in 2012. However, those figures refer to the net area under coca cultivation on 31 December of the year given. In 2012, the Colombian Government manually eradicated 34,486 ha of cultivation and conducted aerial spraying of 100,549 ha. The addition of geographical data available on the presence of coca bush cultivation shows that 135,000 ha had been under cultivation at some point during 2012. |140| The greatest reduction in coca bush cultivation in Colombia took place in the departments of Narino, Putumayo, Guaviare and Cauca. |141| The decline in coca bush cultivation observed in the Plurinational State of Bolivia continued in 2012 (25,300 ha in 2012 compared with 27,200 ha in 2011) and in Peru, where it declined to 60,400 ha from 62,500 ha in 2011. As a result, the estimated global production of cocaine has also declined. In Colombia, the potential production of pure cocaine was estimated at 309 tons, the lowest level since 1996. (For details see tables on coca bush cultivation and production estimates in annex.)
Seizures
Globally, cocaine seizures have slightly increased over the past year, going up to 671 tons in 2012, compared with 634 tons in 2011, driven largely by increased seizures in South America |142| (418 tons in 2012 compared with 362 tons in 2011) and in Western and Central Europe, another major cocaine market, where seizures increased from 63 tons in 2011 to 71.2 tons in 2012.
Fig. 31. Seizures of cocaine worldwide and in selected countries, 2003-2012
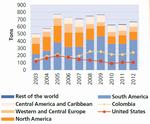
Click to enlargeSource: UNODC annual report questionnaire and other official sources.
Note: Includes seizures of cocaine salts, coca paste, cocaine base and crack cocaine.Extent of use
Cocaine use remained stable over 2012, with 14 million-21 million estimated past-year users globally (0.4 per cent annual prevalence). Cocaine use remained high in North and South America (1.8 per cent and 1.2 per cent annual prevalence rates, respectively), Oceania (1.5 per cent) and Western and Central Europe (1 per cent). While there has been an increase in cocaine use in North America (between 2011 and 2012) due to a number of factors explained below, prevalence of cocaine use in Western and Central Europe declined from an estimated 1.3 per cent in 2010 to 1.0 per cent in 2012.
Cocaine: market analysis
Overall, the latest supply indicators suggest that the global availability of cocaine has fallen in the medium term. However, in 2012, there were signs of a levelling-off or even a possible rebound in some markets. In addition, given that cocaine use is still relatively concentrated in certain markets, there is a certain degree of uncertainty with respect to the extent of the phenomenon in Africa and Asia.
Fig. 32. Indicators of the cocaine market in the United States, 2002-2012, indexed relative to 2006
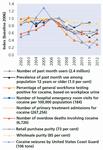
Click to enlargeSource: Office of National Drug Control Policy, US Government.
Note: Values in 2006 indicated in brackets.Fig. 33. Annual prevalence of cocaine use and cocaine seizures in the United States, 2001-2013
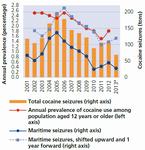
Click to enlargeSource: Office of National Drug Control Policy (US Government), Substance Abuse and Mental Health Services Administration.
a Prevalence data for 2013 were unavailableFig. 34. Year-on-year changes in past-year cocaine use and first-time use in the United States, by age bracket, 2012 versus 2011
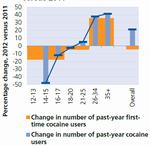
Click to enlargeSource: Substance Abuse and Mental Health Services Administration, United States.
Global cultivation of coca bush is estimated to have fallen by approximately one quarter between 2007 and 2012. However, it is not clear whether the gradual decline brought about a shortage in meeting global demand or represented a return to equilibrium following a surplus around 2007. Indeed, the total area under cultivation, which had been quite stable in the period 2003-2006, at 153,000-157,000 ha, returned to that range in 2010 and 2011. The further decline in 2012 brought the total area of cultivation down to its lowest level since the beginning of available estimates (1990). However, the significance of that recent decline is tempered by the improvements in the efficiency of the cocaine manufacture process that are believed to have taken place over the long term.
Numerous indicators show that the cocaine market in the United States experienced a significant drop in cocaine availability, beginning around 2006, resulting in sustained decreased levels of availability and use. The average cocaine purity (wholesale, retail and overall) as recorded in the System to Retrieve Information from Drug Evidence (STRIDE) database of the United States Drug Enforcement Agency, seizures by the United States Coast Guard and United States authorities along the United States-Mexico border, prevalence of past-month and past-year cocaine use among the general population, the percentage of the workforce testing positive for cocaine based on urinalysis testing, among other indicators, all exhibit turning points in 2005 or 2006.
Cocaine reaching the United States is believed to originate to a large extent in Colombia and to enter the country via Mexico. |143| On the basis of the assessment of the Drug Enforcement Administration of the United States, it appears that, in addition to the decrease in levels of manufacture of cocaine, law enforcement efforts that hindered the activities of Colombian traffickers may have contributed to the reduced availability in the United States, as well as a possibly self-perpetuating cycle of shortages of cocaine and violent conflicts between competing drug trafficking organizations in Mexico. |144| In addition, the marked decline in coca bush cultivation in Colombia in particular may also have contributed to the shortage of cocaine in North America. Cultivation of coca bush in Colombia halved between 2007 and 2012.
In the United States, the trend in some of the cocaine market indicators changed in 2011 and 2012: cocaine seizures rose from 89 tons in 2010 to 106 tons in 2011, and the estimated prevalence of past-year cocaine use in the population aged 12 years or older rose from 1.5 per cent in 2011 to 1.8 per cent in 2012, following a steady decline between 2006 and 2011.
Fig. 35. Cocaine retail prices in the United States and Western and Central Europe, 2003-2012
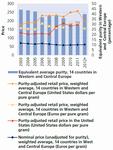
Click to enlargeSource: For European countries, UNODC annual report questionnaires, EMCDDA and Europol; for the United States, estimates based on the 2013 National Drug Control Strategy Data Supplement, Office of National Drug Control Policy, United States.
a For 2012, comparable price data for the United States were unavailable.Fig. 36. Reported retail purities of cocaine salts in Western and Central Europe, 2011 and 2012 (typical purity and ranges)
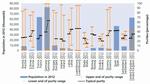
Click to enlargeSource: UNODC annual report questionnaire and other official data.
Fig. 37. Annual prevalence of cocaine use (2012) versus cocaine retail prices, nominal and adjusted by purchasing power parity (unadjusted for purity), by region, 2011-2012

Click to enlargeSource: UNODC estimates based on World Bank Purchasing Power Parities and annual report questionnaire, supplemented by other official sources
a Price data for Africa were available from a very limited number of countries.
b An international dollar would buy in the region concerned a comparable amount of goods and services a United States Dollar would buy in the United States.The general behaviour of the cocaine market in the United States from 2006 onward appears to be that of a tight market where use patterns were constrained by, and thus to a certain extent followed, the available supply. |145| In particular, the apparent rebound in cocaine use in 2012 may be associated with a slight comeback in cocaine availability towards late 2011. However, in 2013 seizures returned to a declining trend, suggesting that was only a transitory aberration. Moreover, the increase in past-year use in 2012 appears to have been driven by the consumption patterns of older users, including past users returning to the habit, rather than a predisposition of younger people at risk of initiating cocaine use; indeed, the number of first-time users actually declined in 2012, while the trend in past-year use was increasing only in the older age categories.
South America, long the source of the world's cocaine supply, has seen an increase in terms of consumption of cocaine (including crack). The number of past-year cocaine users in South America was estimated at almost 2 million in the period 2004-2005 and 3.35 million in 2012. A significant component of cocaine use in South America is the smoking of various forms of cocaine, including crack as well as other crude forms of cocaine base.
Brazil contains approximately one half of the population of South America; it is a country that is vulnerable to both cocaine trafficking, due to its geography (which makes it a convenient staging area for cocaine trafficked to Europe), as well as to cocaine consumption, due to its large urban population. The last official estimate of annual prevalence of cocaine use in Brazil based on a general population survey dates to 2005. A more recent survey |146| among college students in Brazilian state capitals estimated the annual prevalence of use of cocaine powder among college students (of all ages) at 3 per cent in 2009.
In Western and Central Europe, supply indicators overall suggest a possible rebound in availability of cocaine. Following a clear decline from the peak of 2006, cocaine seizures reached a low in 2009 at 53 tons and climbed back to 71 tons by 2012. The increase in 2012 was, however, concentrated in a few important transit countries, notably Belgium, Spain and, to a lesser extent, Portugal, while major consumer countries such as France, Germany and Italy registered decreases. However, the retail purity of cocaine increased in some countries with sizeable consumer markets, such as France, Germany and the United Kingdom. Consequently, on the basis of data from 14 countries in Western and Central Europe with relatively good availability of both price and purity data, the estimated weighted average of the purity-adjusted retail price in Western and Central Europe fell significantly, with the equivalent (constant across countries) purity returning to its highest level since 2005.
On the demand side, the data currently available do not indicate any changes in the recent overall decreasing trend in cocaine use in Western and Central Europe; that indication, however, is inconclusive, given that data on use are usually updated less frequently and less promptly than supply indicators such as seizures, prices and purity, and that changes in use may follow changes in availability with a short time lag. The apparent increasing availability in Europe (if confirmed to be real), could possibly be driven by an increasing supply originating in Peru, |147| and if the trend in use continues to diverge from the trend in availability, it would raise the question of whether a portion of the cocaine entering Europe is possibly destined for emerging markets outside the established markets in Western and Central Europe.
One such possible destination could be Oceania, where the market has expanded in recent years and where prices are higher than in Western and Central Europe. Cocaine seizures in Oceania reached a record of 1.9 tons in 2010, and remained high in 2012, at 1.6 tons. In particular, past-year use of cocaine among the general population aged 14 years or older in Australia rose from 1.6 per cent in 2007 to 2.1 per cent in 2010, although the average frequency of consumption appears to be low, |148| possibly due to the high prices. Indeed, this is corroborated by the fact that Oceania is something of an exception among the major consumer markets, in that both the price and the prevalence are relatively high, while the retail price would be expected to have an inverse relationship to the levels of use, especially when adjusted for purchasing power parity (all other factors being equal).
In terms of the number of cocaine seizure cases in 2012, categorized by country of departure, Australia ranked the Netherlands first and Germany second. It is likely that the majority of those seizures were of small consignments; in terms of weight, and with reference to a slightly different reporting period (July 2011-June 2012), the most prominent European country was the United Kingdom (in fifth place). Moreover, it appears that Peru has increased in importance as a country of origin of cocaine reaching Australia (including possibly through Europe) although, as of mid-2012, Colombia remained foremost among the three producer countries.
Fig. 38. Origin of coca leaf used to produce cocaine as a proportion of analysed seizures made by the Australian Federal Police, by number and by total weight of seizures, 2007-2012
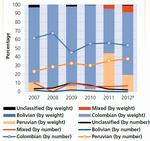
Click to enlargeSource: Australian Crime Commission.
a January-June only.Fig. 39. Cocaine consumption and purity-adjusted price in Western and Central Europe, weighted by population of countries, 2003-2012
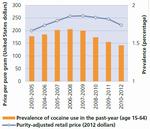
Click to enlargeSource: UNODC annual report questionnaire.
Note: Prevalence figures displayed as moving average.Fig. 40. Cocaine prevalence and purity-adjusted price, United States, 2003-2012
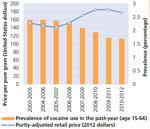
Click to enlargeSource: UNODC annual report questionnaire, and Substance Abuse and Mental Health Services Administration and price data from the System to Retrieve Information from Drug Evidence (STRIDE) database of the United States Drug Enforcement Agency.
Note: Prevalence figures displayed as moving averageIn Eastern Europe, seizures of cocaine continue to be limited. Aside from Latin America, countries in Eastern Europe exclusively cited European countries as transit countries for cocaine reaching their territory in 2010-2012. It is likely that the Baltic region serves as an entry point for cocaine entering the Russian Federation. |149| Limited quantities of cocaine may also reach Central and Eastern Europe from the south, via countries in Eastern and SouthEastern Europe, including countries traditionally associated with the Balkan route for heroin entering Europe. |150|
The extent of drug trafficking and consumption in Africa is hard to assess. Although seizures in the subregion of West and Central Africa remained below 3 tons in 2012 (including 2.2 tons seized in Cabo Verde alone), cocaine trafficking via West Africa to Europe is believed to be continuing. In 2012, Algeria in particular registered a spike in cocaine seizures, reporting that cocaine transited through countries in West and Central Africa prior to seizure, and identifying trafficking by air as the main mode of transportation. Some of the cocaine may also be diverted to other destinations, possibly including Asia; it is also likely that there is a link with South Africa. |151|
The estimated prevalence of cocaine use in South Africa rose from 0.78 per cent of the general population in the 15-64 age bracket in 2008 to 1.02 per cent in 2011, confirming the continued existence of a sizeable and apparently expanding consumer market for cocaine. Owing to the paucity of supply-side data, it was not possible to complete the picture of the situation in that country.
Seizures of cocaine in East Africa, while still small on a global scale, have also increased in recent years, notably in the United Republic of Tanzania.
The extent of cocaine use in Asia has always been limited, and the most recent available evidence does not give reason to change that assessment. Nevertheless, cocaine has made its first inroads in this continent, and as pockets of consumption, trafficking and trade in cocaine emerge, factors including affluence |152| appear to play a role in determining which countries are affected first. In 2012, the largest aggregate quantities of cocaine seizures in Asia were those seized in Hong Kong, China, followed by the United Arab Emirates and Israel (in that order). The United Arab Emirates, a prominent stopover point for air passenger traffic, has been identified as a transit country by a disparate group of countries with a small, possibly emerging market for cocaine, including countries in Asia and Africa. Israel and Lebanon appear to be destination countries for cocaine, with Jordan and the Syrian Arab Republic serving as transit countries. |153| Annual seizures in China and India were below 100 kg in 2011; more significant, relative to the size of the population, were the quantities (each in excess of 25 kg) seized in Japan, Saudi Arabia and Thailand in 2011.
Cultivation and production
Cannabis cultivation remains widespread in most regions, ranging from personal cultivation to large-scale farm and indoor warehouse operations, thus making it difficult to estimate the global levels of cannabis cultivation and production. While cannabis herb is grown in almost every country in the world, |154| the production of cannabis resin is confined to only a few countries in North Africa, the Middle East and South-West Asia. In Afghanistan, on the basis of available cultivation and production estimates, in 2012, the total area under cultivation of cannabis was 10,000 ha, down from 12,000 ha in 2011. But potential resin production, due to higher yields per hectare, was estimated at 1,400 tons in 2012, compared with 1,300 tons in 2011. The decline in the price of cannabis resin in Afghanistan between December 2011 and December 2012 supports the assumption of a possible increase in availability over that period. |155|
Among countries reporting in 2012 through the annual report questionnaire, Italy, the United States and Ukraine reported eradication of a large number of plants and cultivation sites.
Seizures
Global cannabis herb seizures in 2012 were reported at 5,350 tons, down from the 6,260 tons reported in 2011. With the exception of the Caribbean and Europe, seizures have declined slightly in most regions. The largest quantities of cannabis herb were seized in North America, which accounts for over 64 per cent of seizures worldwide.
In contrast to cannabis herb, cannabis resin seizures increased in 2012, with 1,269 tons seized, compared with 1,058 tons in 2011. Resin seizures increased significantly in Afghanistan, from 62 tons in 2011 to 160 tons in 2012, and in North Africa (mainly due to increases reported in Algeria (rising from 53 tons to 157 tons) and, to a lesser extent, in Morocco (rising from 126 tons to 137 tons). Spain accounts for 26 per cent of global cannabis resin seizures; although seizures in that country declined slightly from 2011 (356 tons) to 2012 (326 tons).
Based on an analysis of supply indicators for cannabis herb at the retail level (see annex for details), availability remains high in the Americas and appears to be growing in the subregion of Western and Central Europe and in SouthEastern Europe. Despite reports of falling seizures, consumer access to marijuana herb is likely increasing in North America, Oceania, Western and Central Europe and South-Eastern Europe. When retail prices are adjusted by taking into account purchasing power in order to compare prices worldwide, cannabis herb is found to be relatively inexpensive in North America, cheapest in Africa and South Asia (India and Sri Lanka) and most expensive in East and South-East Asia.
Fig. 41. Production of cannabis resin in Afghanistan and seizures in neighbouring countries, 2009-2012
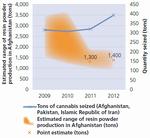
Click to enlargeSource: Afghanistan cannabis surveys (published by UNODC) and UNODC annual report questionnaires.
Fig. 42. Seizures of cannabis resin worldwide and in selected countries, 2003-2012
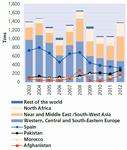
Click to enlargeSource: UNODC annual report questionnaire.
Fig. 43. Seizures of cannabis herb worldwide and in selected countries, 2003-2012
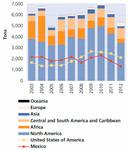
Click to enlargeSource: UNODC annual report questionnaire.
As for eradication of outdoor sites and plants, the United States reported a major decrease in sites eradicated (6,470 sites eradicated in 2012 compared with 23,622 sites in 2011), but it is not known to what extent the decrease was due to declining law enforcement activity in that area or to increasing licit cultivation due to the new cannabis laws in the States of Colorado and Washington. The other countries reporting high numbers of cannabis plants and cultivation sites eradicated are given in the table below.
Table 6. Countries reporting eradication of cannabis plants and sites, 2012
Country (in order of area eradicated) Eradication (outdoors) Eradication (indoors) Plants Sites Plants Sites Italy 4,114,911 1,318 United States 302,377 2,596 United States 3,631,582 6,470 Switzerland 83,450 Ukraine 2,200,000 New Zealand 21,202 783 Tajikistan 2,180,121 Chile 18,526 1,377 Philippines 1,224,738 188 Australia 17,668 322 Costa Rica 965,320 129 Italy 7,706 458 Brazil 616,133 5 Latvia 3,796 4 Indonesia 341,395 Slovakia 2,927 Chile 216,902 291 Republic of Moldova 152,961 New Zealand 119,059 Source: UNODC annual report questionnaire and government data.
Extent of use
In 2012, between 125 million and 227 million people were estimated to have used cannabis, corresponding to between 2.7 and 4.9 per cent of the population aged 15-64 years. West and Central Africa, North America, Oceania and, to a lesser extent, Western and Central Europe remain the regions with prevalence rates considerably higher than the global average. Over the past five years in North America, the largest cannabis herb market, prevalence rates have followed an upward trend in the United States |156| but declined in Canada between 2008 and 2011, increasing again between 2011 and 2012. |157| Although recent epide-miological data from Asia are not available, experts from nearly half of the countries in Asia consider cannabis use to be increasing in the region.
Cannabis: market analysis
Lower perceived risk and increased harm in consumer markets
Worldwide, the cannabis market (herb and resin) continues to expand, with almost two thirds of reporting countries ranking cannabis as the primary substance of abuse. |158| In major consumer markets, treatment enrolment and hospitalizations related to cannabis use have been increasing. In the United States, between 2006 and 2010, there was a 59 per cent increase in cannabis-related emergency department visits |159| and a 14 cent increase in cannabis-related treatment admissions. |160| |161| Additionally, according to the Potency Monitoring Project of the University of Mississippi, levels of tetrahydrocannabinol (THC) in seized or eradicated cannabis herb crops in the United States increased from 8.7 per cent in 2007 to 11.9 per cent in 2011. Because of the relationship between increased potency and dependence, that trend may be contributing to the increased risk of drug use disorders and dependence. |162|
Fig. 44. Lifetime, past-year, and past-month use of cannabis herb among people 12 years and older, United States, 2008-2012
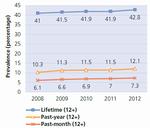
Click to enlargeSource: Substance Abuse and Mental Health Services Administration survey of the United States.
Fig. 45. Trends in lifetime use among school children, United States, 2008-2013
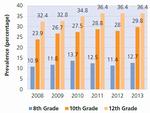
Click to enlargeSource: Monitoring the Future Survey, United States.
Fig. 47. Change in inflation-adjusted retail price, from the biennium 2009-2010 to the biennium 2011-2012, weighted average (percentage)
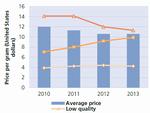
Click to enlargeSource: PriceOfWeed.com.
Fig. 47. Change in inflation-adjusted retail price, from the biennium 2009-2010 to the biennium 2011-2012, weighted average (percentage)
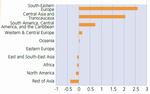
Click to enlargeSource: UNODC annual report questionnaire.
The phenomenon of increased harm is not unique to one specific region. Nearly two thirds of those enrolled in drug treatment in Africa listed cannabis as their primary drug of use, and in Brazil, increasing dependence among cannabis users has been reported. |163| In a recent national survey in Pakistan, three in four past-year cannabis users (mostly users of cannabis resin), were found to be dependent. |164| However, among key informants, the herbal form of cannabis (consumed in a traditional drink called "bhang") was ranked as the tenth most harmful drug, whereas resin was ranked as the second most harmful. |165|
Increase in supply of cannabis herb in South-Eastern Europe and Central Asia
With respect to supply measures, although global seizures have declined 24 per cent (from 7,049 tons in 2010 to 5,351 tons in 2012), the market for cannabis herb has become more diversified, with the largest percentage increases in seized herb noted in markets where cannabis resin had previously been predominant throughout Western, Central and South-Eastern Europe. Concomitant with the seizure increases, prices of cannabis herb have increased significantly in South-Eastern Europe and Central Asia. Since 2009, cannabis prices in Turkey have increased the most among all countries reporting worldwide. Increases in herb price were also noted in the region, in Azerbaijan, Kazakhstan, Kyrgyzstan, Greece and Uzbekistan.
Overall, cannabis resin seizures have increased for the third straight year, with decreases in the Americas and Europe and increases in Africa and Asia. Further, the price of resin has also increased in Kazakhstan, Kyrgyzstan and Pakistan, a regional phenomenon potentially related to higher levels of regional interdictions, which is likely resulting in supply shortfalls at the consumer level.
Fig. 48. Trends in seizure of cannabis resin and herb, Europe, 2003-2012
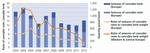
Click to enlargeSource: UNODC annual report questionnaire
Seizures of cannabis herb now equivalent to cannabis resin in the European markets
There continues to be evidence that cannabis resin is decreasing in popularity in Europe. Whereas cannabis resin had previously dominated the market, now there are nearly equivalent levels of resin and herb seizures, implying a continuing shift away from imported resin coming mainly from Morocco to more locally or regionally produced cannabis herb. Unfortunately, drug use surveys typically do not distinguish between cannabis resin and herb; therefore this cannot be corroborated by drug use data.
Price declines in North America together with higher potency levels
Regarding the cannabis herb market in countries with regulatory changes such as the United States and Uruguay, changes in rates of interdiction and in prices are expected. Between 2009 and 2012 in the United States, the price of cannabis herb declined 12 per cent |166| after adjustment for inflation. According to self-reported information on purchases reported to the PriceOfWeed website, since 2010, the price, adjusted for quality, has fallen only 6 per cent, but the price of high-quality cannabis herb has fallen 20 per cent, and the price of medium-quality cannabis herb has risen 40 per cent. Overall, the prices of various qualities of cannabis herb have converged, implying that the price of cannabis herb in the United States has become less variable, indicating more retail market integration. |167|
Changing cannabis policy in the Americas
Recent policy changes to cannabis regulation in Uruguay |168| and in the states of Washington |169| and Colorado |170| in the United States |171| now make the authorized production, distribution and consumption of marijuana legal, |172| under some conditions, such as purchasing age. The International Narcotics Control Board has expressed concern that "a number of States that are parties to the 1961 Convention are considering legislative proposals intended to regulate the use of cannabis for purposes other than medical and scientific ones" and it urged "all Governments and the international community to carefully consider the negative impact of such developments." In the Board's opinion "the likely increase in the abuse of cannabis will lead to an increase in related public health costs". |173|
Although in those three jurisdictions, the purchase, possession and consumption of cannabis are now legal, the details, design and implementation of the new laws vary significantly. For example, in Uruguay users must register in a database to monitor cumulative purchases (maximum 40 g per month), |174| but in the State of Colorado, purchases of up to 1 oz (28 g) are allowed per outlet, with no central registry of cumulative purchases per buyer nor any limit on the amount that can be purchased each month. |175| Because of these and other notable differences in each law, there is unlikely to be one uniform impact of these policy changes, but rather measurable distinct changes reflecting the contexts of each jurisdiction.
The impact of the new legislation could differ substantially from current cases of depenalization, decriminalization or "medical" cannabis laws by allowing the establishment of a licit supply chain, including large-scale licensing for production, personal cultivation and retail commercialization |176| of the market. While it is not yet clear how the market will change, the commercialization of cannabis may also significantly affect drug-use behaviours. Commercialization implies motivated selling, which can lead to directed advertisements that promote and encourage consumption.
For instance, in the case of tobacco companies, advertising was directed to attract new users, which resulted in effective marketing to youth. |177|
Because laws of this kind have never before been enacted or implemented in a national or state jurisdiction, no previous case studies are available to predict what changes should be expected. Thus, monitoring and evaluation will provide critical data for policymakers. For this reason, it is important that the impacts of this legislation are measured against a number of factors, ranging from the impact on health and criminal justice (effects on the individual as well as institutions and society) to the balance of public revenues against costs and to other social impacts.
At this time, countries and states surrounding Uruguay, Colorado and Washington have not adopted similar regulatory or legislative measures. In consideration of this, additional outcomes that need to be monitored include drug tourism, cross-border leakage and access and availability to youth in neighbouring jurisdictions.
Health
While research has not conclusively established the impact of more lenient laws on cannabis consumption, an increase in prevalence of cannabis use from recreational use sales is expected, although it is also possible that the primary effect -- particularly in the first decade or so -- may differ from longer-term impacts. Expert analyses predict that the legalization of cannabis will most likely reduce production costs substantially, |178| which would in turn be expected to put downward pressure on prices over time, although whether lower prices materialize in the first few years or only in the longer term is unknown. Since cannabis consumption responds to prices, the lower price will probably lead to higher consumption. |179| It is estimated that for each 10 per cent drop in price, there will be an approximately 3 per cent increase in the total number of users |180| and a 3-5 per cent increase in youth initiation. |181|
Initiation and use among youth and young adults is of particular concern due to the established increased risk of harm, such as other drug use and dependent drug use, |182| a risk of heavy dependence, lung problems, memory impairment, psychosocial development problems and mental health problems, and poorer cognitive performance associated with early initiation and persistent use between the early teenage years and adulthood. |183| |184| For youth and young adults, more permissive cannabis regulations correlate with decreases in the perceived risk of use, |185| and lowered risk perception has been found to predict increases in use. |186|
Although it is an important metric to monitor, increases in prevalence of cannabis use may not provide a reliable estimate of the greatest impact on health, since many users use cannabis only occasionally. One aspect to consider is that there is a general, demonstrated increased potency of cannabis in Europe and North America, |187| which may translate into more potent cannabis being available under the new laws and may lead to greater health consequences than in past years (although a clear link between potency and harm has not been conclusively established). Critical areas of harmful use -- such as heavy |188| or dependent use, as well as the age of initiation and sustained use -- should also be carefully monitored.
Looking at the health impact, it is also important to try to determine if there is a substitution effect whereby cannabis replaces other substances (such as alcohol or more harmful drugs such as heroin) or, conversely, a complementary effect whereby greater use of cannabis leads to greater use of other substances. After drug law reforms in Portugal that decriminalized drug possession for personal use in 2001, referrals |189| for cannabis increased from 47 per cent of referrals in 2001 to 65 per cent in 2005, but referrals for heroin decreased from 33 per cent to 15 per cent, and cocaine remained stable at 4-6 per cent. |190| One study in the United States found that while cannabis-related hospital admissions went up after the decriminalization of cannabis in the period 1975-1978, admissions for other drugs went down. |191|
Criminal justice
Criminal justice procedures related to possession for personal consumption are likely to decrease significantly in the context of the new laws, whereas control of other can-nabis-related activities, such as cultivation, sale and distribution, will continue to require routine monitoring owing to explicit limitations set forth in the legislation.
The different ways countries have implemented the international drug control conventions determines the extent to which an individual will encounter the criminal justice system for drug possession for personal use, and penalties can range from a warning to more severe consequences, such as incarceration. In countries with depenalization |192| of possession for personal use, penalties are reduced or eliminated, but there remains a criminal justice encounter whereby the individual would still face some consequences or rehabilitation. The new legal status of the possession of cannabis in Uruguay and the states of Colorado and Washington means that no such mechanism is provided for.
Over the past decade, across 45 countries, the number of people who have been in contact with the authorities (suspected or arrested ) for personal drug use and possession offences has increased by one third (see the section on drug-related crime (drug law offences)). |193| Among these encounters with authorities, cannabis is involved in the majority of cases in every region of the world. There are no data that can show how many of those apprehended were ultimately prosecuted, convicted and incarcerated.
To estimate the overall criminal justice impact of increasingly permissive laws on cannabis is not an easy task. Laws regarding cannabis possession affect both the broader institutional criminal justice system and the individual. For example, a research study in Australia compared, in one area, a group of individuals that received criminal convictions for cannabis offences with a second group of individuals who had been given only infringement notices; those convicted were far more likely to experience adverse employment consequences, recidivism, relationship problems and accommodation difficulties attributed to their offence. |194| |195|
Although it has been mentioned as a rationale for policy change in several cases, the expected impact on the broader criminal networks of drug cartels is unknown. Because so much of cannabis cultivation is local, |196| drug cartels operating in other illicit activities and other drug markets (e.g., cocaine, heroin and methamphetamine) would likely be only modestly affected after cannabis legalization. (Given their population sizes, Uruguay and the states of Colorado and Washington constitute a very small cannabis market).
Although little research is available on the topic, experts estimate cartel losses of nearly $3 billion from the initiatives that passed in Colorado and Washington -- with 20-30 per cent cuts in profits. |197| However, in another analysis of the potential impact of cannabis legalization in the state of California on Mexican drug trafficking organizations, researchers concluded that legal changes in one state (in this case, California) would not be enough to greatly diminish the market for Mexican cannabis, but if prices dropped significantly nationwide as a result of the spillover to other states, cartel revenue could be affected substantially in the long term. The authors could not unequivocally predict a decline in drug-related violence in Mexico as a result of cannabis legalization, as there was no basis for comparison. |198|
Economic costs and benefits
Tax revenues from retail cannabis sales may provide significant revenue, although there is uncertainty concerning how much can be raised. In the ballot initiative of Colorado, it was stipulated that tax revenues from the sale of cannabis were to be used to provide $40 million for school construction. Based on assumptions about the size of the market, it was estimated that the ballot measure would bring in as much as $130.1 million in revenue over the period 2014-2015. |199| Legalization may also increase income and social security tax revenues by shifting labour from criminal to legal and taxed activities.
However, in Uruguay and the states of Washington and Colorado, significant costs will also be incurred through the establishment of programmes to deter cannabis abuse and regulate the new industry. Based on assumptions regarding the size of the consumer market, it is unclear how legalization will affect public budgets in the short or long term, but expected revenue will need to be cautiously balanced against the costs of prevention and health care.
In addition to the impact on health, criminal justice and the economy, a series of other effects such as consequences related to security, health care, family problems, low performance, absenteeism, car and workplace accidents and insurance could create significant costs for the state. It is also important to note that legalization does not eliminate trafficking in that drug. Although decriminalized, its use and personal possession will be restricted by age. Therefore, the gaps that traffickers can exploit, although reduced, will remain.
The collection of reliable data both before and after these policy changes will support the evaluation of the health, criminal justice and economic consequences of the new regulatory frameworks. Further, careful study of the effects on local and transnational organized crime networks will allow evidence-based decisions to inform policy in this area at the national and regional levels. The impact of this legislation can be evaluated only if it is appropriately measured through reliable data-gathering and regular monitoring efforts.
G. AMPHETAMINE-TYPE STIMULANTS: OVERVIEW
Production, trafficking and consumption
While it is difficult to quantify the global production of ATS, the number of ATS-manufacturing laboratories that were dismantled increased from 12,571 (12,567 ATS labs in addition to four labs producing ATS in conjunction with non-ATS substances) in 2011 to 14,322 in 2012 -- nearly all of these (96 per cent) were manufacturing meth-amphetamine. In North America, methamphetamine manufacturing has expanded again. In 2012, a large increase in methamphetamine laboratories seized was reported by the United States (12,857 in 2012 from 11,116) and Mexico (259 from 159). A significant increase in the number of amphetamine laboratories dismantled in 2012 was reported by the United States (from 57 to 84) and the Russian Federation (from 27 to 38).
For the second year, ATS seizures reached an all-time high of 144 tons, up 15 per cent from 2011, due in large part to increases in methamphetamine seizures. Over the past five years, methamphetamine seizures have almost quadrupled, from 24 tons in 2008 to 114 tons in 2012. Of the total of 144 tons of ATS seized globally in 2012, approximately half were seized in North America alone and approximately a quarter in East and South-East Asia. Large quantities of amphetamine seizures continue to be reported in the Middle East, in particular by Jordan, Saudi Arabia and the Syrian Arab Republic.
Seizures of "ecstasy" have resurged after the drop in 2011. Major quantities of "ecstasy" were seized in East and South-East Asia, followed by Europe (South-Eastern Europe and Western and Central Europe). All three regions account for nearly three quarters of global "ecstasy" seizures.
Amphetamine-type-stimulants: market analysis
Diversification and expansion of the global methamphetamine trade
In 2012, methamphetamine accounted for the majority of ATS seizures (80 per cent), approximately 114 tons of the total 144 tons of ATS seized worldwide. Nearly two thirds (64 per cent) of global methamphetamine seizures occurred in North America, and one third in East and South-East Asia. Although Mexico, the United States, China, Thailand and Iran (Islamic Republic of), in that order, continue to report the highest amounts of methamphetamine seized worldwide, there is evidence that methamphetamine trafficking is becoming more global in nature, with noteable increases from 2011 to 2012 observed in West and Central Africa (from 45 kg to 598 kg) and Oceania (from 457 kg to 2,283 kg). Growing methamphetamine markets have also been observed in Central Asia and Transcaucasia, as seizures reported increased from less than a kilogram in 2008 to 76 kg in 2012.
Fig. 49. Global seizures of amphetamine-type stimulants, 2003-2012
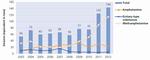
Click to enlargeSource: UNODC annual report questionnaire and other official sources.
Note: Total ATS includes amphetamine, "ecstasy"-type substances, methamphetamine, non-specified ATS, other stimulants and prescription stimulants.Fig. 50. Countries reporting the highest methamphetamine seizures, 2010-2012
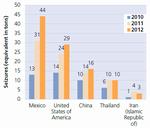
Click to enlargeSource: UNODC annual report questionnaire and other official sources.
Fig. 51. Seizures of amphetamine-type stimulants in South-East Asia and Oceania
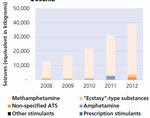
Click to enlargeSource: UNODC annual report questionnaire.
In addition, methamphetamine markets grew in South-West Asia, with recent detection of methamphetamine use in Pakistan. |200|
In North America, methamphetamine manufacturing has expanded again in recent years as evidenced by significant increases in drug and precursor seizures, |201| with large-scale production in Mexico. Over the past five years, the amount of methamphetamine seized in Mexico increased from 341 kg in 2008 to the equivalent of 44 tons in 2012 (aggregating seizures reported by weight and by volume). The United States continues to seize large quantities, 29 tons in 2012, up from 9.5 tons in 2008. According to the United States Drug Enforcement Agency, approximately half of the seizures in the United States occur at the United States-Mexico border. |202| After several disruptions to the availability of precursors and the manufacturing processes in Mexico in 2005 and 2007, methamphetamine purity in the United States continued to increase, reaching 93 per cent in the second quarter of 2012. Although the purity of methamphetamine is high, the potency likely decreased following restrictions on precursor access in Mexico (see the box "Does supply control work? Methamphetamine purity and potency following precursor regulations in North America").
Does supply control work? Methamphetamine purity and potency following precursor regulations in North America
Methamphetamine production is dynamic, with multiple processes capable of producing the same end product. The two most common methods are (a) phenylacetic acid > 1-phenyl-2-propanone (P-2-P) > methamphetamine or (b) pseudoephedrine/ephedrine > methamphetamine. P-2-P production methods result in a less potent form of methamphetamine because of the contamination of the potent d-isomer with the less potent l-isomer, known as a racemic mixture.
In the United States, in the early 1990s, methamphetamine was produced using ephedrine, which was restricted by the United States ephedrine single ingredient product regulation in 1995, resulting in a drop from nearly 80 per cent purity to approximately 20 per cent. In the following years, the purity increased during the subsequent two years and dropped in 1998, after the adoption of further pseudoephedrine/ephedrine product regulations. After early 1999, despite several precursor regulations in the United States and Canada, the purity continued to increase until 2005, when Mexico initiated precursor control programmes. Subsequently, purity again dropped, climbing briefly and then dropping again after the arrest of a large supplier to Mexico. |1| Since 2007, the purity has increased, now reaching 93 per cent. However, according to researchers, this high-purity methamphetamine is less potent because it is a racemic mixture. Because the lower potency is associated with less dependence, authors conclude the supply of harmful methamphetamine has in fact, decreased. |2|
Price and purity of methamphetamine in the United States, 2005-2012

Click to enlargeSource: Data from the System to Retrieve Information from Drug Evidence (STRIDE) database of the United States Drug Enforcement Agency.
1 J. K. Cunningham, L. M. Liu and R. Callaghan, "Impact of US and Canadian precursor regulation on methamphetamine purity in the United States", Addiction, vol. 104, No. 3 (March 2009), pp. 441-453.
2 J. K. Cunningham and others, "Mexico's precursor chemical controls: emergence of a less potent types of methamphetamine in the United States". Drug and Alcohol Dependence, vol. 129, Nos. 1 and 2, (April 2013), pp. 125-136.Seizures of methamphetamine have been surging in East and South-East Asia and Oceania. Between 2011 and 2012, approximately 70 per cent (12 of 17 countries) of the reporting countries in the region noted an increase in seizures of methamphetamine. Although China and Thailand regularly seize the largest amounts, those numbers increased only marginally in relative terms from 2011 to 2012, while the quantity of methamphetamine seized in Australia increased over 400 per cent, from 426 kg to 2,268 kg. Major increases were observed in countries that regularly report smaller numbers of seizures, such as Brunei Darussalam, Cambodia, Singapore and Viet Nam. After a drop in seizures in 2010, Myanmar reported seizures of 2 tons compared with 33 kg in 2011. |203|
Emergence of methamphetamine in South-West and Central Asia
Fig. 52. Ephedrine seizures in India and Iran (Islamic Republic of), 2010-2011

Click to enlargeSource: International Narcotics Control Board annual report 2013
Central Asia is emerging as an ATS market, reporting 253 kg of ATS seizures, 183 kg of which were reported by Kazakhstan. For the first time, in 2012, Tajikistan reported seizures of 63 kg of methamphetamine and 21,740 tablets of "ecstasy". The methamphetamine seized in Tajikistan was from one incident in which customs officials intercepted a large amount shipped from the Islamic Republic of Iran destined for South-East Asia (Malaysia). |204|
In Pakistan, methamphetamine use was detected for the first time in a national survey, which estimated that approximately 19,000 people (0.02 percent of the population aged 15-64) had used the drug in the past year. |205| That marks an emergence of the substance in the area, which had been undetected in prior drug use surveys. According to reports made to INCB |206|, in the region there have also been increases in seizures of ephedrine, a precursor of methamphetamine. In 2011, India reported over 6 tons of ephedrine seizures, and Iran (Islamic Republic of) reported 3.8 tons.
Amphetamine
Amphetamine continues to dominate the market in the Near and Middle East/South-West Asia, with over 12 tons seized in 2012, representing more than half of global seizures (56 per cent). In the region, the largest seizure totals are those of Saudi Arabia, Jordan and the Syrian Arab Republic, in that order.
In neighbouring Turkey, a shift towards "ecstasy" and methamphetamine trafficking has taken place in recent years, with amphetamine trafficking moving to other markets.
Fig. 53. Amphetamine seizures in Jordan, Saudi Arabia and the Syrian Arab Republic, 2008-2012
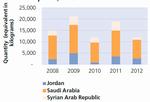
Click to enlargeSource: UNODC annual report questionnaire.
Fig. 54. Seizures of amphetamine-type stimulants in Turkey, 2008-2012
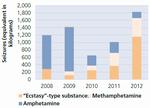
Click to enlargeSource: UNODC annual report questionnaire.
Extent of amphetamine-type stimulant and "ecstasy" use
ATS, excluding "ecstasy", constitute the second most commonly used group of illicit substances worldwide, with 13.9 million to 54.8 million estimated users. ATS use remained stable in 2010 and 2011, but increased in 2012. Within the different regions, while there is a reported decrease in ATS use in Western and Central Europe, the estimates for North America indicate an increase in ATS use. In the United States, treatment admissions for methamphetamine use were down, and the past-year prevalence has remained stable for the past three years. However, the prevalence of other types of stimulants (amphetamines) has increased (see figure 56), leading to an increase in overall ATS prevalence from 1.8 per cent in 2011 to 2.1 per cent in 2012. The positive rates of urinanalysis for amphetamine and methamphetamine among the United States workforce, however, nearly tripled in 2012, reaching the highest levels since 1997. |207| An increase in prevalence was reported in Mexico, from 0.02 per cent in 2008 to 0.12 per cent in 2011.While new estimates of ATS use in Asia and Africa are not available, experts from most of the countries in these regions consider ATS use on the rise. Oceania (2.1 per cent) Central America and North America (1.3 per cent and 1.4 per cent respectively) are the regions with prevalence rates higher than the global average, while the rates in West and Central Africa and Asia remain comparable to the global rates of ATS use.
Fig. 55. Seizures of amphetamine-type stimulants in Central America, South America and the Caribbean (2008-2012)
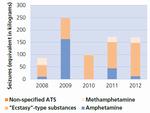
Click to enlargeSource: UNODC annual report questionnaire.
Fig. 56. Prevalence of past-year methamphetamine and stimulant use and treatment admissions for methamphetamine, among persons 12 years or older, United States, 2008-2012
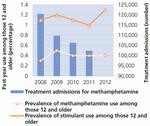
Click to enlargeSource: Survey results of the United States Substance Abuse and Mental Health Services Administration Treatment Episode Data Set, 2000-2011, national admissions to substance abuse treatment services.
"Ecstasy"
With between 9.4 million and 28.2 million estimated past-year users in 2012, its use declined globally in the period 2010-2012, mainly in Western and Central Europe. Nevertheless, Oceania (2.9 per cent), North America (0.9 per cent) and Europe (0.5 per cent) remain regions with prevalence rates higher than the global average of 0.4 per cent.
Misuse of prescription stimulants
The misuse of prescription stimulants or medications for attention deficit hyperactivity disorder is not uncommon, although only a few countries report prevalence of misuse among the general and youth population. With the exception of Indonesia, all countries reporting misuse of prescription stimulants are from South and North America. This, however, does not preclude that misuse of prescription stimulants is not common in the other countries or regions. Rather, the detection of such misuse in some countries may be related to better monitoring. The prevalence of misuse of prescription stimulants varies considerably among the few countries reporting, ranging from 3.28 per cent among the general population in El Salvador to 0.1 per cent in Argentina. With the exception of El Salvador, Indonesia and Costa Rica, the misuse of prescription stimulants is higher among men. In El Salvador, the prevalence is 3.7 per cent among women compared with 2.78 per cent among men.
Compared with rates for the general population, countries report a higher level of misuse of prescription stimulants among the youth population (mostly those 15-16 years old). In Costa Rica, compared with the annual prevalence of misuse of prescription stimulants of 1.3 per cent, the rate is nearly 4 times higher among the youth population. A similar pattern of higher rates of misuse of prescription stimulants is seen in the other countries, with the exception of El Salvador, where the prevalence is quite low among youth, 0.2 per cent, compared with 3.28 per cent among the adult population.
Fig. 57. Annual prevalence of misuse
of prescription stimulants
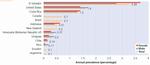
Click to enlargeSource: UNODC annual report questionnaire;
data of countries varies from 2005 to 2012.Fig. 58. Misuse of prescription stimulants among youth
aged 15-16 years, 2008-2011*
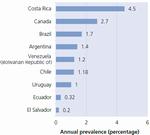
Click to enlargeSource: UNODC annual report questionnaire.
Note: survey period varies by country.Increase in ketamine and mephedrone treatment admissions in the United Kingdom
Fig. 59. Number of treatment entries for club drugs in the United Kingdom, 2005/2006 and 2010/2011

Click to enlargeSource: Club Drugs: Emerging trends and risks (2012), National Treatment Agency for Substance Misuse, National Health Service, United Kingdom.
In the United Kingdom, there has been a decrease in prevalence of ketamine and mephedrone use in England and Wales among both the adult population (aged 16-59) and young adults (aged 16-24). |208| |209| However, there has been an increase in the number of people seeking treatment for ketamine and mephedrone over the past six years. Although users of ketamine and mephedrone account for only 10 per cent of young people in specialist services and 2 per cent of adults in treatment, there are clear signs of an increase in treatment demand for drug use disorders related to club drugs such as ketamine and mephedrone in the United Kingdom. While "ecstasy" remains the most common club drug reported in treatment demand, the number of ketamine and mephedrone users seeking treatment has risen between 2005/06 and 2010/11. |210|
H. NEW PSYCHOACTIVE SUBSTANCES
Update |211|
Of 103 countries for which information on new psycho-active substances was available as of December 2013, 94 countries reported the emergence of such substances on their markets, up from 70 out of a total of 80 countries as of July 2012. This increase was due to reports of the emergence of new psychoactive substances in countries in Europe (9 additional countries), Asia (7 additional countries) and Africa (8 additional countries).
New psychoactive substances are now found in most of Europe and North America, as well as Oceania, Asia and South America and in a number of African countries. The use of new psychoactive substances is thus emerging as a truly global phenomenon. The largest increases in the spread of those substances between July 2012 and December 2013 were reported in Europe (9 additional countries), Asia (7 additional countries) and Africa (6 additional countries).
The number of new psychoactive substances on the global market more than doubled over the period 2009-2013. By December 2013, the number of such substances reported to UNODC reached 348, |212| up from 251 such substances as of July 2012, |213| and 166 substances in 2009 (see figure 60). Thus, by now, the number of new psychoactive substances clearly exceeds the number of psychoactive substances controlled at the international level (234 substances: 119 controlled under the 1961 Single Convention on Narcotic Drugs and 115 under the 1971 Convention on Psychotropic Substances).
Are amphetamine-type stimulants substituting cocaine in the United States?
Positive urinanalysis tests for amphetamine-type stimulants among the United States workforce, 2000-2012
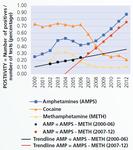
Click to enlargeSource: Quest Diagnostics and United States Office on National Drug Control Policy
In the United States, cocaine use has declined but use of amphetamines group substances is on the rise. According to Quest Diagnostics, on the basis of urinanalysis, the number of positives for amphetamine as a metabolite (including, therefore, cases of methamphetamine use, in addition to prescription use and illicit use of amphetamine) among the general workforce in 2012 were the highest since 1997, and positive drug tests for prescription medications such as Adderall more than doubled between 1992 and 2012. |1| Survey data reported over this period for the general population aged 12 or older also indicate a doubling in the past-month use of Adderall, stable use of methamphetamine, and declining use of cocaine since 2007. Taken together, these data indicate that the increase in positive amphetamine tests in the general workforce is likely attributable to prescription amphetamine as opposed to methamphetamine. Indeed, subtracting methamphetamine positives from the total for all positive tests classified as "amphetamines" shows a distinct transition in 2007, when the decline in cocaine began, with the growth rate over the period 2007-2012 being four times that rate over the period 2002-2006. It would appear that the positivity rate for amphetamine now exceeds the historic level reached by the rate for cocaine in the United States in the period 2000-2006. This evidence, although not conclusive, points to the possibility that amphetamines are being used as a substitute for cocaine.
1 United States, Quest Diagnostics, "Drug Testing Index", (Madison, New Jersey, November 2013). Available at www.questdiagnostics.com/home/physicians/health-trends/drug-testing.
The overall increase over the period August 2012-December 2013 was mostly due to new synthetic cannabinoids (50 per cent of newly identified new psychoactive substances) followed by new phenethylamines (17 per cent), other substances (14 per cent) and new synthetic cathinones (8 per cent) (see figure 61).
Progress has been made in some areas. In the United States, where national controls on some new psychoactive substances were introduced, |214| prevalence of the use of synthetic cannabinoids and of "bath salts" (synthetic cathinones) declined by some 30 percent among high school students. Annual prevalence of synthetic cannabinoid use fell from 11.4 per cent in 2011 to 7.9 per cent in 2013 and prevalence of use of "bath salts" declined from 1.3 per cent in 2012 to 0.9 per cent in 2013 among twelfth grade students. |215| In England and Wales, annual prevalence of mephedrone, a synthetic cathinone, fell by more than 60 per cent, from 4.4 per cent among those aged 16-24 years in 2010/11 to 1.6 per cent in 2012/13. |216| While no clear link has yet been established, Government activities aimed at raising awareness among drug users about the health risks associated with new psychoactive substances |217| and the introduction of national controls |218| took place in the same period. Prevalence of use of ketamine, which is also controlled, fell from 2.1 to 0.8 per cent over the same period. |219|
Fig. 60. Number of newly identified new psychoactive substances at the global level, 2009-December 2013 (cumulative)
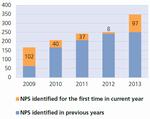
Click to enlargeSource: UNODC, World Drug Report 2013 and UNODC early warning advisory on new psychoactive substances.
Note: The 2012 figures refer to information received by July 2012. For some substances reported in 2013, the reference period may have been August-December 2012.Fig. 61. New psychoactive substances reported to UNODC by December 2013
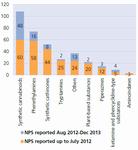
Click to enlargeSource: UNODC early warning advisory on new psychoactive substances, based on information submitted by Member States and submissions to UNODC from laboratories participating in the international collaborative exercises for national drug test laboratories.
A number of strategies have been developed by Member States and the international community over the years to address the world drug problem in a comprehensive way, including demand reduction programmes (prevention, treatment), supply reduction interventions (drug interdiction, dismantlement of drug trafficking organizations, alternative development programmes, eradication) and efforts to control illicit financial flows. A further key intervention in supply reduction has gained importance since the adoption of the United Nations Convention against Illicit Traffic in Narcotic Drugs and Psychotropic Substances of 1988: the control of precursor chemicals, that is, the control of chemicals used to manufacture plant-based and synthetic drugs. As early as the 1990s, the Chemical Action Task Force pointed out that "the procurement of chemicals necessary to manufacture drugs is one of the few points where ... drug trafficking intersects with legitimate commerce. Regulation of legitimate commerce to deny traffickers the chemicals they need is one of our most valuable tools in the battle against drug criminals." |220| This has become even more relevant over time, as a growing proportion of the illicit drugs found on the market nowadays are synthetic drugs for which traditional supply-control measures applied to plant-based substances, such as alternative development or eradication, cannot be used.
Progress has been made with regard to precursor control. |221| Such progress has been strengthened through resolutions of the Economic and Social Council and the Commission on Narcotic Drugs, as well as the Political Declaration adopted by the General Assembly at its twentieth special session, in 1998, and the Political Declaration on International Cooperation towards an Integrated and Balanced Strategy to Counter the World Drug Problem, adopted by the Assembly in 2009, and their related action plans and the work done by the International Narcotics Control Board in assisting Member States in monitoring licit trade and preventing diversion. |222|
Nonetheless, chemicals are still available for the illicit manufacture of drugs. Precursor control is a complex area involving a large number of substances which have widespread legitimate uses and which can be easily substituted. It involves many players and multiple links between the licit and illicit sectors.
The present chapter will start with a review of the evolution of licit production and trade in chemicals, the degree of international interdependence and the development of the regulatory framework. It will then analyse the effect of precursor control on the supply of illicit drugs and new challenges, such as the growing role of the Internet, the emergence of substitute precursors, pre-precursors and new psychoactive substances, to which the current controls at the international level do not apply. The pages ahead will present an analysis of the various aspects of precursor control, covering both the licit and the illicit side of this sector while keeping an underlying focus on drug control.
B. WHAT ARE PRECURSOR CHEMICALS?
The term "precursor chemicals" broadly refers to chemicals that are employed in the manufacture of drugs. From a scientific point of view "precursor chemicals" are defined as the chemical substances that become incorporated, at the molecular level, into a narcotic drug or psychotropic substance during the manufacturing process. |223| They can be distinguished from other chemicals used in the manufacturing process, such as "reagents" and "solvents". |224|
This scientific distinction does not entail legal consequences, however. Article 12 of the 1988 Convention, the legal basis for precursor control at the international level, does not make any such distinction and speaks only of "substances frequently used in the illicit manufacture of narcotic drugs or psychotropic substances".
In the Political Declaration adopted by the General Assembly at its twentieth special session, in June 1998, and the related measures to enhance international cooperation to counter the world drug problem, |225| the term "precursors" was broadened to encompass all chemicals that are controlled under the 1988 Convention.
C. THE POTENTIAL VULNERABILITY OF THE CHEMICAL INDUSTRY TO THE DIVERSION OF PRECURSOR CHEMICALS
1. Trends and patterns in the production of chemicals
Over the past century, the chemical industry has been one of the main economic growth sectors, and it continues to grow strongly, both in volume and in geographical terms, involving an ever larger number of players. Asia has become the new centre for manufacture, and the increasing number of intermediaries provides greater opportunities for diversion.
The total number of "establishments" in the chemical sector rose worldwide from approximately 61,000 in 1981 to 67,000 in 1990, 83,000 in 2000 and close to 97,000 in 2010. |226| This reflects an expansion of the production base of chemicals and thus potentially expands the possibilities for the diversion of chemicals. This is exacerbated by a growing number of "chemical operators" who are also involved in the trade of such substances. |227|
Data from the United Nations Industrial Development Organization (UNIDO) suggest that chemicals are now being manufactured in most countries. |228| Of the 148 Governments that reported manufacturing output data to UNIDO over the 1990-2010 period, 142 also declared production of chemicals.
The rapid expansion of the chemical sector can also be observed in terms of output. The production output of the chemical industry, expressed in constant United States dollars, almost doubled between 1990 and 2010, and rose more than fourfold between 1960 and 2010 to approximately $3,800 billion (see figure 1).
Fig. 1. Output of the global chemical industry, 1963-2010
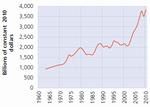
Click to enlargeSource: UNODC estimates based on UNIDO INDSTAT 2 database.
The "value added" |229| of the global chemical industry, which can be directly compared with the notion of gross domestic product (GDP), shows an increase in constant 2010 dollars from $620 billion in 1990 to about $1,110 billion in 2010. |230| This growth was larger than the growth of the entire manufacturing sector and global GDP (see figure 2). As a result, the proportion represented by the chemical sector in the overall value added of manufacturing increased from less than 11 per cent in 1990 to close to 13 per cent by 2010. Expressed as a percentage of global GDP, the value added of the chemical industry accounts for about 2 per cent, which is comparable to the value added of agriculture, which accounts for 3 per cent of global GDP .
The observed stronger growth of output (5.8 per cent annually during the 2000-2010 period) as compared with value added |231| (3.5 per cent) in the chemical industry (see figure 3) suggests a trend of companies redefining their core products and spinning off non-core production and services to new companies. This can be explained by a reduced vertical integration of the chemical industry, mainly as a consequence of the emergence of new production sites in developing countries. One side effect of this has been increased intra-industry trade in chemicals between continents, which increases the risk of diversion of chemicals used in the clandestine manufacture of drugs.
While the chemical sector has been growing over the past few decades, it is still characterized by some geographical concentration and by significant shifts in production, which has implications for precursor control. Traditionally, most chemicals have been produced in Europe and in North America (United States of America, Germany, France and the United Kingdom of Great Britain and Northern Ireland) and -- after World War II -- the former Union of Soviet Socialist Republics. Initially, only one Asian country -- Japan -- was included among major chemical producers.
Fig. 2. Average annual growth of the value added of the global economy, manufacturing and the chemical industry
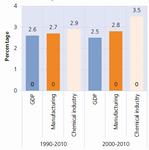
Click to enlargeSource: UNODC estimates based on World Bank indicators on "Manufacturing, value added (in constant 2005 dollars)" and "Chemicals (percentage of value added in manufacturing)" (accessed in August 2013 at http://data.worldbank.org/indicator).
Fig. 3. Average annual growth of the output and the value added for the chemical industry

Click to enlargeSource: UNODC estimates based on the UNIDO INDSTAT 2 database and World Bank indicators (http://data.worldbank.org/indicator).
Over the past few decades, however, a number of countries in Asia (notably in East, South and South-East Asia) have gained market share at the expense of North America and Europe (see figure 4). By 2010, Asia accounted for 35 per cent of the global value added of manufacture of chemicals, up from 21 per cent in 1990. China advanced from generating the eighth-largest value added of chemicals in 1990 to second place (following the United States and ahead of Japan) in 2010. India progressed from fourteenth place in 1990 to fifth place by 2010, following Germany and ahead of Brazil and Mexico.
An analysis of long-term output trends for the chemical sector reveals similar patterns (see figure 5). Above-average growth rates were reported in particular in Asia, notably in East, South and South-East Asia, and output growth accelerated further during the 2000-2010 period. By 2010, China reported the world's largest chemical industry output, ahead of the United States, Japan, Germany, France, Brazil, the Republic of Korea, Italy, India, the Netherlands, the United Kingdom, the Russian Federation and Switzerland (in that order). |232| The production output of these 13 countries accounted for more than three quarters (78 per cent) of the global output of the chemical industry.
The importance of Asia's chemical industry as measured in terms of output (44 per cent, see figure 6) exceeds its importance in terms of value added (35 per cent, see figure 4). The opposite is true for the Americas and Europe. This suggests that chemical mass products are increasingly being produced in Asia, while there is still a concentration of some value-added intensive production of chemicals in North America and in Western and Central Europe.
Data on the sales of the chemical industry for 2011 (�2,744 billion, or $3,822 billion) suggest that by that year 52 per cent of global turnover was credited to companies in Asia (see figure 7). Taken together, Asia, Europe and North America accounted for 92.5 per cent of world chemical sales in 2011. |233| The largest sales were reported by companies in China (27 per cent), followed by the European Union (20 per cent), the United States (15 per cent) and Japan (6 per cent). The single largest European producer was Germany (5.7 per cent of global sales). The largest producer in Latin America was Brazil (3.2 per cent), although its sales still lagged behind Asia's third largest producer, the Republic of Korea (4.3 per cent). Other important producers included France (3.0 per cent of global sales), Taiwan Province of China (2.2 per cent), |234| the Russian Federation (2.1 per cent) and the Netherlands (1.9 per cent). |235|
All of these production shifts have potential implications for the control of precursor chemicals. A chemical industry concentrated among big companies facilitates the control of chemicals that can be diverted for the illicit manufacture of drugs, while a more scattered production system increases the number of trade lines and, ultimately, the risk of diversion. Control systems were initially developed mostly in North America and in Europe, where the chemical industry was dominated by large, vertically integrated companies. This facilitated national controls, including through voluntary cooperation with the authorities. The emerging chemical industry in Asia, in contrast, is characterized by a much greater number of smaller enterprises, |236| thus posing a bigger challenge to the authorities.
Fig. 4. Regional distribution of the value added of the chemical industry, 1990-2010
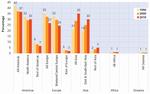
Click to enlargeSource: UNODC estimates based on World Bank indicators on "Manufacturing, value added (in constant 2005 dollars) and "Chemicals (percentage of value added in manufacturing) (accessed in August 2013 at http://data.worldbank.org/indicator).
Fig. 5. Average annual growth in the output of the chemical industry, globally and by region
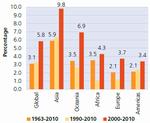
Click to enlargeSource: UNODC estimates based on the UNIDO INDSTAT 2 database.
Fig. 6. Regional distribution of output of the chemical industry, 2010
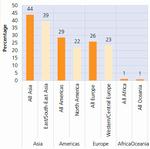
Click to enlargeSource: UNODC estimates based on the UNIDO INDSTAT 2 database.
Fig. 7. Regional distribution of sales of the chemical industry, 2011
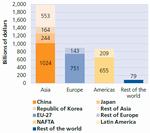
Click to enlargeNote: NAFTA means North American Free Trade Agreements countries. EU-27 means the State Members of the European Union as of 2011.
Sources: European Chemical Industry Council Chemdata International, "World chemicals sales: geographic breakdown" and OANDA (for conversion of euros into United States dollars).2. Trends and patterns in international trade in chemicals
Growth in international trade in chemicals outstripped growth in the global production of chemicals. While output doubled between 1990 and 2010, chemical exports, expressed in constant 2012 United States dollars, grew to more than three-and-a-half times the size (see figure 8).
This pattern became even more pronounced during the 2000-2010 period (see figure 9).
Fig. 8. Global exports of the chemical industry, 1990-2012
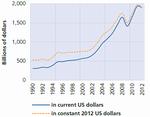
Click to enlargeSource: UNODC estimates based on the United Nations Commodity Trade Statistics database (UN COMTRADE), Standard International Trade Classification Revision 3.
Fig. 9. Average annual growth in chemical exports, output and value added of the chemical industry (in constant dollars)
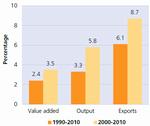
Click to enlargeSource: UNODC estimates based on World Bank indicators, INDSTAT 2 and UN COMTRADE.
As a consequence, global chemical exports rose from representing 25 per cent of the global output of the chemical industry in 1990 to 33 per cent in 2000 and 43 per cent in 2010. With ever more chemicals being traded among an increasing number of countries, the possibility of diversion of chemicals has increased.
The chemical industry is widely seen as one of the most globalized of all manufacturing industries, and this globalization is still in progress, |237| facilitated by reduced import duties as a consequence of several rounds of the General Agreement on Tariffs and Trade and the subsequent work of the World Trade Organization. Although the value added generated by the chemical industry accounted for "just" 1.9 per cent of global GDP in 2010, the proportion that chemicals comprise of global exports is almost six times as high -- and rising (see figure 10).
The relationship between the production and trade of chemicals is not linear. Countries with high levels of production are not always the biggest exporters of chemicals, and almost a quarter of countries have larger chemical exports than domestic production. |238| A more linear correlation is observed between the levels of exports and imports of chemicals (see figure 11), which underlines the importance of re-exports |239| and the fact that trade flows are not always directly from producing to consuming countries, but instead involve an increasing number of brokers and other intermediaries in the supply chain. Not only does this provide more opportunities for diversion, it makes the effective application of the "know your customer" principle |240| more difficult to achieve.
Fig. 10. Proportion of the chemical industry in global GDP and of chemical exports in global merchandise exports

Click to enlargeSource: UNODC estimates based on World Bank indicators and UN COMTRADE.
Fig. 11. International trade in chemicals, 2012 or latest year available (30 largest exporting countries and territories)
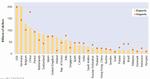
Click to enlargeSource: UN COMTRADE.
D. RESPONSE OF THE INTERNATIONAL COMMUNITY
The idea of controlling precursors as one of the strategies for controlling the overall manufacture of drugs and thus their consumption (for non-medical purposes) dates back to the early 1930s. It was only in the late 1980s, however, that an effective international precursor control system was devised. That system was further strengthened over the following decades.
1. Conventions concluded under the auspices of the League of Nations
The basic idea of precursor control was already present in the Convention for Limiting the Manufacture and Regulating the Distribution of Narcotic Drugs of 1931, which had provisions for the international control of a limited number of "convertible substances", |241| i.e. substances that could be converted into a product capable of producing addiction. |242|
Another reference to the need for precursor control can be found in the Convention for the Suppression of the Illicit Traffic in Dangerous Drugs of 1936. That Convention introduced an obligation to seize such precursors and contained penal provisions for the manufacture, conversion, extraction and preparation of drugs, |243| which also had an impact on the handling of precursor chemicals. Both Conventions were superseded by the Single Convention on Narcotic Drugs of 1961.
2. Single Convention on Narcotic Drugs of 1961
A general reference to precursor control, asking for the "supervision" |244| of such substances, is also found in the Single Convention on Narcotic Drugs of 1961 as amended by the 1972 Protocol, which is still in force today. In addition, it allowed substances "convertible into a drug" to be scheduled. |245| The 1961 Convention also obliged parties to seize precursor chemicals and to introduce penal provisions for the illegal manufacture, extraction and preparation of such drugs. |246|
3. Convention on Psychotropic Substances of 1971
The requirements relating to the introduction of precursor control were broadened in the Convention on Psychotropic Substances of 1971 to include chemicals used in the manufacture of psychotropic substances. |247| Precursors were thus in principle under international control, with provisions for such substances to be seized and confiscated. There was a general obligation for taking "measures of supervision" regarding such substances, though much was left to the discretion of Member States. Thus, only a few countries introduced a comprehensive control regime. Moreover, the 1971 Convention did not include a provision for the scheduling of specific substances that were convertible into a psychotropic substance. |248| This changed only with the 1988 Convention.
4. United Nations Convention against Illicit Traffic in Narcotic Drugs and Psychotropic Substances of 1988
(a) The basic control system
The United Nations Convention against Illicit Traffic in Narcotic Drugs and Psychotropic Substances of 1988 enjoys nearly universal adherence |249|.
The basic idea of the Convention is to regulate the trade of a number of chemicals which can be used for the manufacture of drugs by allowing their trade for licit purposes and prevent their diversion for illicit manufacture of drugs. The 1988 Convention establishes a legal basis for the control of precursors and calls for the establishment of an appropriate administrative framework, working mechanism and standard operating procedures to prevent the diversion of such substances. There are hundreds of chemicals that are or could be used in the manufacture of illicit drugs. Of those, a total of 23 chemicals were internationally controlled under the 1988 Convention as of January 2014: 15 substances under the stricter rules foreseen for substances in Table I (for which pre-export notifications are foreseen) and 8 under the less stringent rules for substances in Table II. |250| This list is regularly updated. The total number of controlled chemical substances in Table I and II nearly doubled from 12 in 1988 to 23 by 2013. The increase over the past two decades has been most noticeable for substances in Table I, rising from 6 in 1988 to 16 following the decision of the Commission on Narcotic Drugs in March 2014 to add alpha-phenylacetoacetonitrile (APAAN) to Table I.
Substances controlled under the 1988 Convention (as of January 2014)
Table I Table II Acetic anhydride Acetone N-acetylanthranilic acid Anthranilic acid Ephedrine Ethyl ether Ergometrine Hydrochloric acid Ergotamine Methyl ethyl ketone Isosafrole Piperidine Lysergic acid Sulphuric acid 3,4-Methylenedioxyphenyl-2-propanone Toluene Norephedrine Phenylacetic acid 1-Phenyl-2-propanone Piperonal Potassium permanganate Pseudoephedrine Paragraph 1 of article 3 of the 1988 Convention requires parties to establish as criminal offences the manufacture, transport and distribution of the listed precursor chemicals in the knowledge that they are to be used in or for the illegal cultivation, production or manufacture of drugs.
As in the 1961 and 1971 Conventions, the 1988 Convention requires States parties to take appropriate measures to prevent the diversion of precursor chemicals. |251|
Article 12 lays down more specific control measures for the manufacture and distribution (e.g. licensing, prevention of the accumulation of large stocks) |252| and international trade in precursor chemicals (e.g. notification of suspicious shipments, seizures, proper labelling and documentation, establishment of a comprehensive monitoring system, |253| including pre-export notifications for substances in Table I) |254| while guaranteeing Member States a high degree of confidentiality |255| and limiting controls (e.g. exclusion of pharmaceutical preparations from controls). |256|
(b) Role of the International Narcotics Control Board
The 1988 Convention also clarified the roles of the various actors. The primary role of precursor control lies with the individual Member States; |257| the International Narcotics Control Board was given the prime responsibility for precursor control at the international level.
The Board is responsible, along with States parties, for recommending to the Commission on Narcotic Drugs the scheduling or rescheduling of chemical substances to be controlled at the international level. While the World Health Organization (WHO) plays a key role in the scheduling of narcotic drugs and psychotropic substances under the 1961 and 1971 Conventions, the Board was given this role for precursor chemicals. |258| It also collects statistics relating to precursors, reports on progress made in precursor control |259| and reports annually to the Commission on the implementation of article 12. |260|
Moreover, the Board has been given a special role in monitoring the implementation of precursor control measures by Member States in accordance with the requirements of the 1988 Convention. |261| The potential sanctions of the Board are limited, however, to bringing an issue to the attention of the parties, the Economic and Social Council and the Commission on Narcotic Drugs; it is then up to these bodies to deal with the issue. This is in contrast to the broader powers given to the Board (e.g. recommending an "import ban") in cases of non-compliance with the other drug conventions. |262|
In addition to collecting data and preparing reports to alert policymakers about new trends, the Board also engages in operational activities. It assists Member States in conducting joint law enforcement operations under the banner of Project Cohesion (with regard to chemicals used in the manufacture of plant-based drugs) and Project Prism (with regard to chemicals used in the manufacture of synthetic drugs) to detect unlawful precursor shipments. In response to various action plans and resolutions, the Board established and maintains a limited international special surveillance list of non-scheduled substances for the identification of substitute chemicals used in the illicit manufacture of drugs. |263| It has also issued the Guidelines for a Voluntary Code of Practice for the Chemical Industry, and established the Pre-Export Notification Online (PEN Online) system, as well as the Precursors Incident Communication System (PICS), a secure online tool to enhance real-time communication and information sharing between national authorities. |264|
5. Resolutions passed by the General Assembly, the Economic and Social Council and the Commission on Narcotic Drugs
Following the adoption of the 1988 Convention, a total of 36 resolutions relevant to precursor control were passed by the General Assembly, the Economic and Social Council and the Commission on Narcotic Drugs during the 19912013 period. While some of those resolutions were geared towards simply raising awareness, others were very focused, dealing with specific aspects of precursor control. |265|
6. Political Declaration and Action Plan adopted by the General Assembly at its twentieth special session
Precursor control received a new impetus from the Political Declaration adopted by the General Assembly at its twentieth special session, in 19 9 8, |266| and the related measures to enhance international cooperation to counter the world drug problem, |267| which contained separate resolutions on the Action Plan against Illicit Manufacture, Trafficking and Abuse of Amphetamine-type Stimulants and their Precursors and on the control of precursors.
In its resolution S-20/4 B, on control of precursors, the General Assembly asked Member States to implement many of the proposals made under the 1988 Convention. Member States were requested to adopt and implement the "proposals" of article 12 of the 1988 Convention, including the establishment of a system of control and licensing of the enterprises and persons engaged in the manufacture and distribution of substances listed in Tables I and II of the 1988 Convention. Similarly, exporting States were requested to issue pre-export notifications for substances in Table I to the competent authorities in importing countries (irrespective of whether an importing country had requested such a notification). In addition, information exchange (from data on licit manufacture to imports and exports) was highlighted as being crucial for precursor control, as was strengthened cooperation with associations of the chemical trade and industry which could be achieved by issuing guidelines and/or a code of conduct. |268|
Most importantly, the principle of "know your customer" |269| was introduced at the international level. It obliges the seller of precursor chemicals to investigate the credentials of the purchaser and, if in doubt, to involve the authorities.
In addition, the document highlighted the challenges arising from the use of "substitute chemicals". In that context, it proposed to prepare a limited international special surveillance list of substances currently not in Tables I and II of the 1988 Convention. This was subsequently implemented by the Board. Moreover, States were asked to apply monitoring measures, in cooperation with the chemical industry, so as to prevent the diversion of substances included on the special surveillance list. In addition, States were asked to "consider punishing, as a criminal offence ... the diversion of non-scheduled chemical substances with the knowledge that they are intended for use in the illicit manufacture of narcotic drugs or psychotropic substances". |270|
7. Political Declaration and Plan of Action of 2009
Precursor control also played a role in the 2009 Political Declaration and Plan of Action on International Cooperation towards an Integrated and Balanced Strategy to Counter the World Drug Problem. The Plan of Action underlined the need for "a global approach in order to ... prevent the diversion of synthetic drugs and their precursors into illicit channels in all manufacturing, transit and consumer countries" and, in the Political Declaration, States Members of the United Nations decided to establish 2019 as a target date for States "to eliminate or reduce significantly ... the diversion of and illicit trafficking in precursors". |271|
The 2009 Plan of Action shows how the precursor market had changed over time. It recognized that pharmaceutical preparations and chemicals not under international control were being substituted for controlled precursors. |272| To respond to these new challenges, the Plan of Action invited Member States to expand the use of pre-export notifications to non-scheduled substances and pharmaceutical preparations. Furthermore, Member States were asked to "develop systems (for example, shared online recording systems) to prevent precursor chemicals from being diverted into illicit channels from community pharmacies". |273|
While acknowledging that regulatory controls helped to prevent the diversion of precursor chemicals from international trade, the Plan of Action identified the new problem of precursors being diverted "from domestic distribution channels" in countries where they were manufactured or imported. |274|
Responding to this new challenge, the Plan of Action asked Member States to "increase efforts, beyond international trade controls, to prevent the diversion of precursors, and pharmaceutical preparations containing the precursors ephedrine and pseudoephedrine, from domestic channels to be smuggled across borders." |275|
Another new element is the invitation to Member States to "consider 'marking' certain chemical shipments for possible future use if scientific advances ensure the appropriate use of such tools, taking into account the potential burden this would place on authorities and industry". |276|
E. PATTERNS AND TRENDS IN PRODUCTION OF, AND TRADE AND TRAFFICKING IN PRECURSOR CHEMICALS
1. Licit activities
(a) Production and trade patterns of substances in Table I and Table II
Detailed information on global production of all 23 chemicals under international control is not available. There is, however, some information on the geographical spread of the licit manufacture of precursor chemicals, suggesting that such production is a global phenomenon.
Map 1. Potential manufacture of precursor chemicals (Table I and Table II), 2010-2012
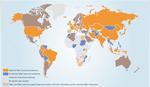
Click to enlargeSources: Annual reports questionnaire of UNODC and UN COMTRADE.
Note: The boundaries shown on this map do not imply official endorsement or acceptance by the United Nations. Dashed lines represent undetermined boundaries. The dotted line represents approximately the Line of Control in Jammu and Kashmir agreed upon by India and Pakistan. The final status of Jammu and Kashmir has not yet been agreed upon by the parties. The final boundary between the Sudan and South Sudan has not yet been determined.Twenty Governments officially reported production of substances in Table I during the 2010-2012 period. Combining this information with trade statistics (Governments reporting more exports than imports of Table I precursor chemicals during the 2010-2012 period) suggests that production of Table I precursors is probably taking place in 47 countries and areas. The manufacture of Table I and Table II precursors may occur in 77 countries and areas, representing about half of the 163 countries and areas for which information is available (see map 1). |277| The combined population of the area concerned accounts for about 77 per cent of the world's population.
Table 1. Regional distribution of trade in internationally controlled precursors (Table I and Table II), 2010-2012
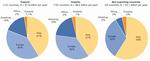
Click to enlargeSource: Data from UN COMTRADE (based on HS07 classification).
The largest proportion of licit exports of the 23 internationally controlled chemical precursors during the 20102012 period were from countries in Asia (41 per cent of the total in value terms), followed by countries in Europe and the Americas (see table 1).
The largest proportion of such exports in Asia during that period were made by the Republic of Korea, followed by Japan, Singapore, Thailand, China and India. The largest exporter in Europe was Belgium, followed by Germany, the Netherlands and Spain. In the Americas, the list was topped by the United States, followed by Canada, Mexico and Brazil. The main exporter in Africa was South Africa, followed by Zambia, Nigeria, Egypt and Kenya. The largest exporter in the Oceania region was Australia, followed by New Zealand. The role of different countries in the licit trade of controlled precursors can be a function of multiple elements: the size of their chemical industry, the domestic demand for chemicals and the trade sector, which may also be influenced by the existence of large seaports. The correlation between exports and imports of precursor chemicals during the 2010-2012 period was weaker than for chemicals in general, suggesting that re-exports, though common, occurred less frequently for precursor chemicals than for chemicals in general.
If only the "net exports" of precursors are considered (i.e. the difference between precursor exports and precursor imports), which may be a better reflection of underlying production, data show an even stronger concentration of such "net exports" of precursors from countries in Asia (59 per cent of the total).
If the analysis is restricted to Table I precursor chemicals, the largest proportion of licit exports during the 20102012 period were reported, in descending order, by Belgium, China, Mexico, the United States, India, Germany, the Netherlands and Switzerland. Aggregated to the regional level, the largest proportion of exports and imports of substances listed in Table I were accounted for by Europe (44 per cent of exports and 65 per cent of imports), Asia (29 per cent and 18 per cent, respectively) and the Americas (27 per cent and 14 per cent, respectively). In terms of net exports, Asia accounts for 50 per cent of the global total (mainly China, followed by India) and the Americas for 38 per cent (mainly Mexico, followed by the United States), while Europe accounts for "just" 12 per cent, reflecting the fact that a significant proportion of European precursor chemical exports are nowadays "re-exports" of imported substances.
(b) Economic importance of substances listed in Table I and Table II
Data from UN COMTRADE indicate that precursor chemicals account for a very small share of the overall market for chemicals. Total international trade |278| in precursor chemicals amounted to approximately $9 billion in 2012, |279| which is equivalent to just 0.5 per cent of total international trade in chemicals.
Although there were 15 substances listed in Table I and only 8 in Table II, the latter substances accounted for 93 per cent of the international trade in precursor chemicals, based on 2012 data (see table 2). The largest (licit) international trade amounts were reported for toluene (40 per cent of total exports in 2012), a chemical used as a solvent (paint thinner) and as an octane booster in gasoline fuels, although it is also used in the processing of cocaine. The second-largest amounts were reported for acetone (22 per cent), a widely used solvent and a chemical used in cocaine and heroin processing, followed by sulphuric acid (14 per cent), a chemical used in the manufacture of cocaine, and amphetamine-sulphate, which in the licit market is required, inter alia, in the production of fertilizers, detergents, pharmaceuticals, insecticides, anti-freezes, explosives, textiles and lubricants.
The economic importance of international trade in substances listed in Table I is far lower. Table I precursors, which are under tighter control, account for only 7 per cent of international trade in precursors. Expressed as a proportion of total exports, substances in Table I comprise
a mere 0.04 per cent of all chemicals traded at the global level. The most important substance in Table I is acetic anhydride, which is employed, inter alia, in the manufacture of heroin. It accounts for global international licit trade of some $0.4 billion, or about 4 per cent of global exports in precursor chemicals. The next most important Table I precursors are potassium permanganate, involved in the manufacture of cocaine (exports of $70 million, or 0.8 per cent of global exports of precursor chemicals) and pseudoephedrine ($63 million, or 0.7 per cent), which is used in the manufacture of methamphetamine, followed by piperonal ($44 million, or 0.5 per cent) part of the manufacture of 3,4-methylenedioxy-N-methylampheta-mine (MDMA), commonly known as "ecstasy".
(c) Trends in the licit trade of Table I and Table II precursors
Expressed in constant United States dollars, global exports of precursor chemicals rose almost fivefold during the 1996-2012 period. |280| Even accounting for inflation, such exports still rose threefold over this period.
There was, however, a marked difference between Table I and Table II precursors. While Table II precursor chemicals rose three-and-a-half times in constant dollars over the 1996-2012 period, the increase in the more strictly controlled substances in Table I amounted to 35 per cent (see figure 12).
Table 2. International trade in precursor chemicals, 2012
Used in manufacture of Chemical substance Schedule Licit exports (in millions of dollars) As a percentage of global precursor exports Licit imports (in millions of dollars) As a percentage of global precursor imports Cocaine Potassium permanganate Table I 70.3 0.8 56.7 0.7 Heroin, conversion of phenylacetic acid to P-2-P and conversion of anthranilic acid to N-acetylanthranilic acid Acetic anhydride Table I 361.8 4.49 415.4 4.8 Amphetamines (methamphetamine/ amphetamine) and methcathinone Ephedrine Table I 10.0 0.1 7.5 0.1 Pseudoephedrine Table I 63.3 0.8 51.2 0.6 P-2-P Table I 2.9 0.04 2.8 0.03 Phenylacetic acid Table I 11.3 0.1 28.4 0.3 Norephedrine Table I 2.2 0.03 1.2 0.01 MDMA ("ecstasy") 3,4-MDP-2-P Table I 0.3 0.00 0.3 0.00 Piperonal Table I 44.1 0.5 42.7 0.5 Safrole Table I 0.06 0.0 0.05 0.0 Isosafrole Table I 3.8 0.05 2.8 0.03 Lysergic acid diethylamide (LSD) Lysergic acid Table I 0.6 0.01 0.8 0.01 Ergotamine Table I 3.6 0.04 5.7 0.07 Ergometrine Table I 0.7 0.01 1.0 0.01 Methaqualone N-acetylanthranilic acid Table I 1.3 0.02 0.8 0.01 Anthranilic acid Table II 12.1 0.1 5.2 0.1 Phencyclidine Piperidine Table II 432.6 5.2 420.0 4.8 Cocaine Toluene Table II 3,273.3 39.5 3,208.4 36.8 Methyl ethyl ketone Table II 711.5 8.6 768.4 8.8 Cocaine and heroin Acetone Table II 1,794.4 21.7 1,881.0 21.6 Ethyl ether Table II 27.1 0.3 28.7 0.3 Cocaine and amphetamine sulphate Sulphuric acid Table II 1,144.9 13.8 1,455.1 16.7 Cocaine, heroin, methamphetamine, "ecstasy" and phencyclidine Hydrochloric acid Table II 30.8 3.7 330.1 3.8 Internationally controlled precursors Table I 574.0 616.0 7.1 Table II 7,703.9 8,096.7 92.9 Table I and Table II 8,280.0 8,713.9 100.0 All chemicals 1,764 429 1,764 429 Precursors as a percentage of international trade in chemicals 0.5 0.5 Source: October 2013 data from UN COMTRADE (based on HS07 classification for precursor chemicals and Standard International Trade Classification Revision 3 for global chemicals imports and exports).
2. Trafficking in Table I and Table II substances
One way to examine trafficking in precursor chemicals is to analyse statistics relating to seizures, although these may reflect variations in law enforcement efforts and changes in trafficking patterns. Information on seizures also provides only a partial picture of trafficking of precursors because law enforcement activities in this area are geared towards the prevention of diversion (e.g. via stopped suspicious shipments) and the detection of clandestine laboratories.
Fig. 12. Global exports of precursor chemicals in constant 2012 dollars, 1996-2012
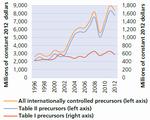
Click to enlargeSource: Data from UN COMTRADE (based on HS96 classification).
Fig. 13. Global seizures of substances in Table I, in tons, 1989-2012
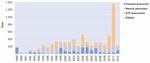
Click to enlargeNote: Preliminary data for 2012; figures may increase once additional information becomes available.
Cocaine precursor: potassium permanganate
Heroin precursor: acetic anhydride
Amphetamine-type stimulants precursors: P-2-P, phenylacetic acid, ephedrine, pseudoephedrine, norephedrine, 3,4-MDP-2-P, safrole, isosafrole and piperonal
Others: lysergic acid; ergometrine, ergotamine and N-acetylanthranilic acid.
Source: International Narcotics Control Board, Precursors Report, 2013 (and previous years).Compared with seizures of all drugs, seizures of precursors are concentrated in a smaller number of countries and are the result of fewer operations. They are often the result of joint international operations and are characterized by the interception of large volumes per seizure case. A relatively low, though rising, number of Governments report such seizures. The number increased from 37 in 2002 to 61 in 2012, |281| reflecting improvements in precursor control as well as a greater geographical spread in the smuggling of precursors. The number of Governments reporting seizures of precursors is still, however, only half of the number reporting drug seizures (124 in 2012). Over the 2002-2012 period, 96 Governments reported seizures of precursors, compared with 146 reporting seizures of drugs. |282|
Owing to the smaller number of seizures involved, seizures of precursors are characterized by large annual fluctuations, which makes trend analyses difficult to interpret and often rather speculative.
The annual fluctuations have been very large for seizures of Table I precursors, which peaked in 2011, primarily reflecting a massive rise of seizures of the amphetamine-type stimulants precursor phenylacetic acid and its derivatives |283| and some increases in acetic anhydride, potassium permanganate, ephedrine and safrole.
Preliminary figures for 2012, in contrast, show some of the lowest seizure figures for substances in Table I in the past two decades (see figure 13). Declines were reported primarily for phenylacetic acid and acetic anhydride. Some of the decline also reflects the fact that seizure information is not yet available from all countries, i.e. totals may still rise. Seizures of potassium permanganate, several of the precursors of amphetamine-type stimulants and the precursors of lysergic acid diethylamide (ergotamine, lysergic acids) rose in 2012.
Fig. 14. Global seizures of Table II substances in volume terms, 1989-2012
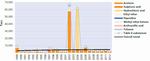
Click to enlargeNote: Preliminary data for 2012; figures may increase once additional information becomes available.
Source: International Narcotics Control Board, Precursors Report, 2013 (and previous years).Seizures of substances in Table II show a different pattern. Overall seizures of such substances peaked in 2002 and in 2004 (see figure 14). The 2002 peak was mainly the result of acetone seizures, while the 2004 peak was linked to seizures of hydrochloric acid. Since then, overall seizures have been at far lower levels. The underlying trend, except for the two peaks, appears to have been stable. This is in contrast to international licit trade in these substances, which has greatly increased over the past two decades. In recent years, seizures of substances in Table II have been dominated mainly by seizures of sulphuric acid and/or acetone. During the 1990-2012 period, seizures of substances in Table II accounted in volume terms for almost 98 per cent of all seizures of chemicals controlled under the 1988 Convention.
The regional distribution of seizures of substances in Table I and Table II shows a concentration in the Americas, followed, depending on the time frame used, by either Europe or Asia. The largest overall precursor seizures in volume terms during the 2002-2012 period were reported by countries in North America (59 per cent of the total), followed by South America (12 per cent), Europe (4 per cent) and Asia (3 per cent). Africa accounted for 0.05 per cent and the Oceania region for 0.02 per cent.
If the analysis is restricted to more recent years (20072012), the largest seizures were made in South America (60 per cent of the total), followed by North America (17 per cent), Asia (15 per cent, of which the bulk (13 per cent of the world total) were made in East and South-East Asia) and Europe (8 per cent). Seizures in the Oceania region accounted for 0.1 per cent and Africa for 0.04 per cent of the total.
F. KEY PRECURSORS USED IN THE ILLICIT MANUFACTURE OF DRUGS
1. Key chemical used in the manufacture of cocaine: potassium permanganate
(a) Use
Potassium permanganate has a broad range of licit applications, mostly derived from its characteristic as an oxidizing agent in chemical reactions. Those applications include use as a disinfectant for hands; for the treatment of dermatitis, fungal infections and mouth ulcers; for fruit preservation and disinfection of vegetables; treatment of drinking water and wastewater; and as an oxidant and reagent for the synthesis of various organic compounds. Significant amounts are required for the synthesis of ascorbic acid (used for vitamin C tablets) and saccharin (an artificial sweetener). Solutions of potassium permanganate with hydrogen peroxide were used to propel rockets |284| and are still used to propel torpedoes.
Potassium permanganate is also used in the illicit manufacture of cocaine. It is employed in the processing of coca paste into cocaine base, and is critical for achieving a proper crystallization of cocaine HCl later in the process, and ultimately for obtaining high-quality cocaine. |285|
(b) International trade
Global exports of potassium permanganate (based on data from UN COMTRADE) amounted to 25,400 tons in 2012, exceeding globally reported imports (17,500 tons). |286| This indicates discrepancies in the reporting of trade statistics, along with possible underreporting of imports.
The value of global exports of potassium permanganate amounted to slightly more than $70 million in 2012 (equivalent to 0.004 per cent of global chemical exports in 2012), up from $23 million in 1996 (see figure 15).
During the 2007-2012 period, a total of 66 Governments reported exports of potassium permanganate, while 141 Governments reported imports. Total exports amounted to $55.3 million per year during the period. The largest exporters were China (54 per cent of the total), followed by the United States (14 per cent), Belgium (11 per cent) and India (7 per cent).
The largest importer of the substance in South America during that period was Brazil, with imports of about 1,000 tons per year, more than 90 per cent of which originated in China. Annual licit imports into the three main cocaine-producing countries were far lower: 45 tons for Peru, 29 tons for Colombia and 6 tons for the Plurinational State of Bolivia. The potassium permanganate required (385 tons per year) for the manufacture of illegal cocaine |287| is rather large compared with an annual total of 1,500 tons of legal imports into South America, Central America and the Caribbean during the 2007-2012 period, suggesting that diversion from the licit market happens before it reaches the region and/or that it is being produced domestically in clandestine laboratories in the Andean region. |288|
Fig. 15. Global exports of potassium permanganate, 1996-2012
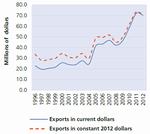
Click to enlargeSource: Data from UN COMTRADE.
Fig. 16. Global seizures of potassium permanganate, 1989-2012
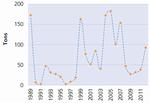
Click to enlargeSource: International Narcotics Control Board, Precursors Report, 2013 (and previous years).
(c) Trafficking
Following initially high seizures of potassium permanganate in 1989, when the substance was placed under international control, seizures remained rather modest during the following decade before rising sharply in 1999 in the wake of Operation Purple (launched under the auspices of the International Narcotics Control Board in April 1999), which focused on the tracking of potassium permanganate and led to a temporary shortage of the chemical in the Andean region. As a consequence, alternative substances were used and operators of cocaine laboratories (notably in Colombia) experimented with the illegal production of potassium permanganate in clandestine laboratories. Further noteworthy seizures were made during the 2004-2007 period as part of Operation Cohesion. Seizures subsequently declined, in parallel with declines in global cocaine production and falling purity levels in North America, until 2009 and remained at lower levels before climbing again in 2012 (see figure 16).
Thirty-nine Governments reported seizures of potassium permanganate during the 2002-2012 period, including 31 Governments during the 2007-2012 period. Global average annual seizures of the substance totalled 65 tons during the 2007-2012 period, equivalent to 0.3 per cent of global licit exports.
South America accounted for 88 per cent of seizures, reflecting the use of the substance in the illegal manufacture of cocaine in the Andean region, followed by Asia (9 per cent), mostly China (8 per cent of total global seizures). The bulk of the seizures made by China took place in 2012, reflecting improved control measures in that country. The International Narcotics Control Board reported that more than three quarters of all pre-export notifications for potassium permanganate in 2011 were issued by China, followed by the United States and India. |289|
The largest seizures worldwide were reported by Colombia (80 per cent during the 2007-2012 period), followed, in the Americas, by the Plurinational State of Bolivia (4 per cent) and Peru (2 per cent). Average annual seizures fell by half in Colombia during the 2007-2012 period as compared with the 2002-2006 period, but more than tripled in Peru and rose 27-fold in the Plurinational State of Boliv-ia. |290| Those patterns reflect a decline in cocaine production in Colombia, as well as the growing importance of both the Plurinational State of Bolivia and Peru as not only coca-producing countries |291| but also cocaine-manufacturing countries. |292|
There are indications that significant amounts of potassium permanganate are produced illegally in the Andean region. In 2011, Colombian authorities dismantled seven laboratories producing the substance; in 2012, eight such laboratories were dismantled. |293| The International Narcotics Control Board cites estimates that between 60 and 80 per cent of the potassium permanganate used in Colombia is obtained nowadays through illicit manufacture of the substance using manganese dioxide as a starting material. |294| Backtracking investigations also suggest that potassium permanganate has been diverted from domestic distribution channels abroad and then smuggled into the Andean region and/or that alternative chemicals have been used. |295|
Smaller amounts were also seized in Argentina, Brazil, Chile, Ecuador and Venezuela (Bolivarian Republic of), i.e. in countries neighbouring the three main cocaine-producing countries, during the 2007-2012 period. In 2013, small amounts were also found in dismantled cocaine-processing laboratories in the Dominican Republic and Panama. |296|
2. Key chemical used in the manufacture of heroin: acetic anhydride
(a) Use
Acetic anhydride is used mainly as an acetylating and dehydrating agent in the chemical and pharmaceutical industries. It is a versatile reagent and is used, inter alia, in the production of aspirin and the conversion of cellulose to cellulose acetate, a substance used for photographic films, adhesives, synthetic fibres and as a frame material for eyeglasses. It is also used as a wood preservative, for polishing metals and in the production of brake fluid, dyes and explosives.
In addition, acetic anhydride is used in the manufacture of heroin and, to a lesser extent, in the manufacture of other drugs, such as methaqualone, or in the conversion of phenylacetic acid to P-2-P. The synthesis of heroin, also known as "diacetylmorphine", is a simple one-step acetyla-tion reaction of morphine using acetic anhydride. |297|
(b) International trade
Estimates of annual licit production of acetic anhydride range from 1.1 million tons (2011) |298| to 2.13 billion litres, or 2.3 million tons, |299| per year. The latest estimate of the International Narcotics Control Board is close to 1.5 million tons per year. |300|
Fig. 17. Global exports of acetic anhydride, 1996-2012
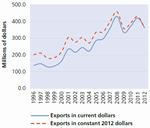
Click to enlargeSource: Data from UN COMTRADE (based on HS96).
Global exports of acetic anhydride in 2012 reached 397,000 tons, while global imports reached 414,000 tons, suggesting that international trade amounts to some 28 per cent of global production of the substance. Global licit exports of acetic anhydride rose, in real terms, by 80 per cent during the 1996-2012 period (see figure 17). This was less than the rise in chemical exports in general.
During the 2007-2012 period, 118 Governments reported importing acetic anhydride, while 45 reported exports of the substance. The largest exporters in Asia were China and Japan; in North America, the United States and Mexico; and in Europe, Belgium and the Netherlands. In terms of "net exports", North America predominates (Mexico followed by the United States).
Officially reported licit imports into South-West Asia, however, were very small. There were no licit imports into Afghanistan. Licit imports into Pakistan fell from 149 kg in 2008 to 14 kg in 2012, according to data from UN COMTRADE. That is far below the requirements of Afghanistan's opiate industry. No licit acetic anhydride imports were reported by the Islamic Republic of Iran or any of the other countries bordering Afghanistan (except China). Yet, clandestine heroin production and seizures of acetic anhydride in West Asia, notably in Afghanistan, were substantial. This suggests that most of the acetic anhydride destined for the subregion originates as diversions made outside the subregion. |301|
In Asia, relatively large imports of acetic anhydride during the 2007-2012 period were reported by China (24,400 tons per year), the Republic of Korea (10,600 tons), Singapore (6,700 tons), Thailand (4,000 tons) and India (1,200 tons). Historically, the largest importer in SouthEastern Europe has been Turkey (1,400 tons per year), an important trans-shipment location for acetic anhydride diverted in Europe and smuggled into Afghanistan. During the same period in Asia, relatively large exports were reported by Saudi Arabia (17,100 tons per year), the United Arab Emirates (15,800 tons), |302| China (11,400 tons), Japan (8,200 tons), Singapore (5,700 tons) and India (2,300 tons).
(c) Trafficking
Following increases in seizures of acetic anhydride in the 1990s, and a peak reached in 2001 in the wake of the implementation of Operation Topaz (which started in late 2000), seizures fell in the first few years of the new millennium, possibly as a delayed reaction to the 2001 Afghan opium poppy ban, before recovering as precursor control gained a new impetus in the wake of the introduction of Operation Cohesion in 2006. Even though seizures declined in 2012, the underlying trend seems to be upwards (see figure 18).
Seizures of acetic anhydride were reported by 43 Governments during the 2002-2012 period. Global annual seizures during the 2007-2012 period amounted to approximately 131,000 litres, equivalent to just 0.03 per cent of global imports.
The largest seizures were made in "West Asia" |303| (34 per cent of the world total), mostly reflecting seizures made in Afghanistan (22 per cent of the world total).
Afghanistan has no legitimate trade in or manufacture of acetic anhydride. Despite that fact, sizeable quantities of the substance are diverted each year from domestic trade in other countries before being smuggled into Afghanistan. |304|
Fig. 18. Global seizures of acetic anhydride, 1989-2012
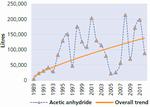
Click to enlargeSource: International Narcotics Control Board, Precursors Report, 2013 (and previous years).
Countries close to Afghanistan are at a particular risk of being targeted to obtain and traffic acetic anhydride into Afghanistan. "That applies particularly to China, India, Islamic Republic of Iran and Uzbekistan -- countries that manufacture acetic anhydride or countries in which a significant amount of the substance is available because of domestic or international trade" |305| as well as to Iraq |306|. Two recent large seizures made in Pakistan |307| and the Islamic Republic of Iran |308| show how these countries continue to be used as transit countries for such shipments.
The next largest seizures were reported by countries in Europe |309| (27 per cent of the total during the 2007-2012 period). The largest, in order of size, were made in Slovenia, Hungary, the Russian Federation, Bulgaria and Slovakia.
During the 2002-2012 period, Turkey reported regular seizures of acetic anhydride, typically originating in Western and Central Europe. |310| Overall seizures of acetic anhydride in Turkey have shown a downward trend, possibly reflecting the declining importance of Europe as a source region.
Seizures in North America, which accounted for 26 per cent of the world total during the 2007-2012 period, were made mainly by Mexico (15 per cent of the world total) and the United States (11 per cent). Such seizures were increasingly linked to the illicit manufacture of metham-phetamine, and increased after 2009.
Seizures in East and South-East Asia accounted for 11 per cent of the world total during the 2007-2012 period, primarily reflecting seizures made in China (8 per cent of the world total), followed by the Republic of Korea and Japan. The only other country in South-East Asia reporting annual seizures during the 2002-2010 period was Myan-mar, the world's second-largest producer of opium.
As reported by the Interational Narcotics Control Board, "while seizures are an important indicator of the level of activity of drug trafficking organizations, it is important to note that they are also indicators of known diversions that have been successful. The international precursor control system is primarily aimed at the prevention of diversion. Comparative figures on stopped, suspended or suspicious shipments show that although seizures of acetic anhydride during the period 2008-2011 amounted to 551,000 litres, nearly double that amount -- 943,000 litres -- was either stopped or suspended (a total of 761,000 litres) or identified as suspicious (182,000 litres) through the PEN Online system." |311|
3. Key methamphetamine precursors: ephedrine and pseudoephedrine
(a) Use
Fig. 19. Licit requirements for ephedrine and pseudoephedrine, 2012 (or latest year available)

Click to enlargeNote: Based on information from 153 Governments.
Source: International Narcotics Control Board, Precursors Report, 2013, annex II.Ephedrine and/or pseudoephedrine have been the key precursors used in the manufacture of methamphetamine for many years. In addition, they are used in the illegal manufacture of methcathinone, another amphetamine-type stimulant.
Ephedra, known as má huáng in traditional Chinese medicine, contains both ephedrine and pseudoephedrine. Its use has been documented since the Han Dynasty (206 B.C.-220 A.D.), |312| in the treatment of asthma and bronchitis and as a stimulant. Licit uses of ephedrine as a pharmaceutical product include cough medicine (bronchodilators), while pseudoephedrine is often used in nasal decongestants. In combination with promethazine, ephedrine is used to combat seasickness. Ephedrine is also found on the WHO list of essential medicines "for use in spinal anaesthesia during delivery, to prevent hypotension". |313| In addition, ephedrine preparations are sold as food supplements or pills to lose weight and reduce body fat.
A total of 113 Governments reported licit requirements |314| for ephedrine to the Board, and 108 reported requirements for pseudoephedrine (out of a total of 153 Governments reporting). |315| The bulk of the requirements for these substances concerned pseudoephedrine (see figure 19). The largest licit demand for those substances was in Asia (60 per cent of the total), followed by the Americas (18 per cent), Europe (13 per cent), Africa (8 per cent) and the Oceania region (0.4 per cent). The single largest markets for ephedrine and pseudoephedrine in volume terms were India (18 per cent of the world total) and China (17 per cent), followed by the United States (13 per cent), the United Kingdom (4.2 per cent), the Republic of Korea (3.9 per cent), Switzerland (3.3 per cent), Pakistan (3.2 per cent), Egypt (3.1 per cent), Singapore (2.9 per cent), Indonesia (2.7 per cent), the Islamic Republic of Iran (2.5 per cent), the Syrian Arab Republic (2.3 per cent) and Nigeria (1.5 per cent). |316|
(b) International trade
Fig. 20. Global exports of ephedrine and pseudoephedrine, 1986-2012
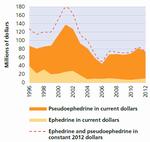
Click to enlargeSource: Data from UN COMTRADE.
Global international trade in ephedrine and pseudoephedrine declined during the 1996-2012 period (see figure 20).
Global exports of ephedrine amounted to, on average, 133 tons per year during the 2007-2012 period, or roughly half of reported imports (264 tons per year). That discrepancy once again indicates problems with regard to reporting of trade statistics.
Thirty Governments reported exports of ephedrine, while 92 reported imports, during the 2007-2012 period. The largest ephedrine exports were reported by India (59 per cent). The largest imports were reported by the United States (20 per cent) and Egypt (19 per cent), followed by the Republic of Korea (8 per cent) and Nigeria (6 per cent).
Global pseudoephedrine exports amounted to, on average, 1,136 tons per year during the 2007-2012 period, exceeding imports (863 tons per year). Thirty-five Governments reported exports of pseudoephedrine, while 96 Governments reported imports during that period. The largest exports were reported by India (52 per cent of the total), followed by Germany and China. According to the United States Department of State, Taiwan Province of China was actually the third-largest exporter worldwide of pseudoephedrine during the 2009-2011 period. |317| The largest pseudoephedrine imports during the 2007-2012 period were recorded by the United States (25 per cent), followed by Egypt (8 per cent).
(c) Trafficking
While there has been a marked upward trend in overall seizures of precursors used in the manufacture of metham-phetamine and amphetamine (see figure 21), that has not been the case with regard to the "traditional" methamphetamine precursors, ephedrine and pseudoephedrine.
Global seizures of ephedrine and pseudoephedrine peaked in the second half of the 1990s and again in 2004 before falling in subsequent years (see figure 22).
The initial increases were in line with reports of strong growth in the clandestine manufacture of methampheta-mine since the mid-1990s. The declines in recent years seem to reflect improved controls for these substances, along with the emergence of alternative precursor chemicals such as phenylacetic acid and a number of chemicals not under international control. In addition, data show that the use of pharmaceutical preparations containing ephedrine or pseudoephedrine has increased in recent years. |318|
Seizures of ephedrine were reported by 54 Governments and seizures of pseudoephedrine by 50 Governments during the 2002-2012 period. Total seizures of both substances amounted to, on average, 56 tons per year during the 2007-2012 period, equivalent to 21 per cent |319| of global licit imports (based on UN COMTRADE data), a very high proportion as compared to potassium permanganate or acetic anhydride, which both had ratios of clearly less than 1 per cent.
The bulk of the seizures were made by countries in North America (43 per cent) and East and South-East Asia (22 per cent), reflecting the concentration of global metham-phetamine production in those two regions, followed by Central America (14 per cent), an emerging transit region. The largest seizures by individual countries during the 2007-2012 period were reported by the United States (32 per cent of the total), followed by China (18 per cent) and Mexico (11 per cent).
East and South Asia continue to be the origins of pseu-doephedrine and ephedrine used in illicit manufacture of methamphetamine in the region and in Oceania. |320| Seizures of ephedrine and pseudoephedrine in Mexico have been declining strongly following improved controls in the country in 2009, which prompted clandestine operators of methamphetamine to shift to alternative precursors.
While Mexico is a major supplier of methamphetamine, the country does not seem to have clandestine facilities or chemical plants that synthesize or manufacture pseu-doephedrine or ephedrine powder. Mexico dismantled 259 methamphetamine laboratories in 2012, up from a few dozen a few years earlier, and it reported the world's largest aggregrated amount of seizures of methamphetamine for the period 2010-2012.
Fig. 21. Global seizures of key amphetamines precursors, 1989-2012
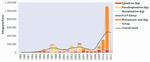
Click to enlargeNote: Preliminary data for 2012; data for ephedrine and pseudoephedrine include pharmaceutical preparations.
Source: International Narcotics Control Board, Precursors Report, 2013 (and previous years).Fig. 22. Global seizures of ephedrine and pseudoephedrine, 1989-2012
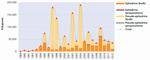
Click to enlargeSource: International Narcotics Control Board, Precursors Report, 2013 (and previous years).
Most of the seizures of these precursors in East and South-East Asia involved ephedrine (80 per cent). There was also a significant domestic demand for both ephedrine and pseudoephedrine. China alone dismantled 228 clandestine laboratories producing methamphetamine in 2012. |321| Significant seizures of ephedrine were also reported by Myanmar, another key producer of methamphetamine in the region, followed by the Lao People's Democratic Republic; Malaysia; the Philippines; Thailand; Indonesia; Japan; Macao, China; Hong Kong, China; Cambodia; and the Republic of Korea. Traditionally, most of the shipments of ephedrine and pseudoephedrine to countries and areas in the region originate within the subregion or in South Asia.
4. Key amphetamine precursors: P-2-P and phenylacetic acid
(a) Use
One of the key precursors for the manufacture of amphetamine (and in recent years also of methamphetamine) is phenyl-2-propanone (P-2-P), or phenylacetone, also known as benzyl methyl ketone (BMK). This substance is mainly used for the manufacture of amfetamine and some of its derivatives, as well as for the synthesis of another stimulant drug, propylhexedrine. The latter substance is frequently sold over-the-counter as an inhalant (e.g. Ben-zedrex) to provide temporary relief of nasal congestion, and as an appetite suppressant (e.g. Obesin).
Global licit requirements for P-2-P reported to the Board amount to some 65 tons per year, a modest amount compared with the reported requirements for ephedrine (close to 400 tons) or pseudoephedrine (more than 1,700 tons). The bulk of the reported licit requirements for P-2-P was from countries in North America (96 per cent of the total), followed by Europe (4 per cent). Small requirements were also reported by Governments in Oceania, Asia, South America and the Caribbean. |322|
One of the potential precursors for P-2-P is phenylacetic acid, which itself is employed to treat type II hyperam-monemia, a metabolic disturbance characterized by an excess of ammonia in the blood that can lead to encepha-lopathy (a brain disorder). Moreover, phenylacetic acid is used in the production of penicillin G (benzylpenicillin), as well as in the treatment of syphilis, diphtheria, meningitis, gonorrhoea, aspiration pneumonia and septic arthritis. Phenylacetic acid is also used in some perfumes.
(b) International trade
Average global exports of P-2-P during the 2007-2012 period amounted to 77 tons, while average annual imports amounted to 143 tons, once again indicating significant reporting discrepancies. Fifteen Governments reported exports of P-2-P during the 2007-2012 period. The largest exporters were France (51 per cent), followed by India (14 per cent) and Egypt (14 per cent).
Fig. 23. Global exports of P-2-P and phenylacetic acid, 1986-2012
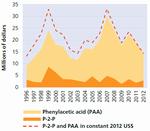
Click to enlargeSource: Data from UN COMTRADE.
The number of Governments reporting imports of P-2-P during the 2007-2012 period amounted to 52. The largest importers were the United States (53 per cent), followed by China (17 per cent), Jordan (6 per cent), Poland (5 per cent) and Egypt (4 per cent). In 2012, the largest importers was the United States, followed by Pakistan.
International trade in phenylacetic acid is substantially larger. Total exports amounted to 4,800 tons per year and total imports to 5,900 tons per year during the 2007-2012 period. The largest exporter during the 2007-2012 period was China (75 per cent), followed by the United States (16 per cent) and India (7 per cent). The largest importer was Mexico (32 per cent). A total of 32 Governments reported exports of phenylacetic acid, while 79 reported imports of phenylacetic acid during the 2007-2012 period.
Combined global exports of P-2-P and phenylacetic acid in 2012 remained at similar levels as in 1996 (see figure 23). A decline of 59 per cent in exports of phenylacetic acid during the 2007-2012 period was linked mostly to lower exports by the United States, China and India, while lower imports were reported mainly from Mexico, the United Kingdom and Spain. Declines in 2012 can be ascribed to falling exports from China; declines in imports were mainly the result of improved controls in Mexico.
(c) Trafficking
Fig. 24. Global seizures of P-2-P and phenylacetic acid, 1989-2012
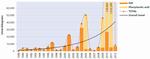
Click to enlargeSource: International Narcotics Control Board, Precursors Report, 2013 (and previous years).
The overall trend with regard to total combined seizures of P-2-P and phenylacetic acid appears to have been upwards (see figure 24). The rise in seizures until 2011 was primarily a result of seizures of phenylacetic acid, which is increasingly being used in North American methamphetamine production. The peak in 2011 may in part have been a result of the transfer of phenylacetic acid from Table II to Table I of the 1988 Convention in that year and thus of stricter monitoring and controls. Moreover, the international Operation Phenylacetic Acid and its Derivatives, conducted under Project Prism in 2011 by the Board, appears to have played an important role.
Average annual seizures of P-2-P during the 2007-2012 period amounted to 8.3 tons, while average annual seizures of phenylacetic acid reached 216.7 tons. Seizures of the latter were higher than those of ephedrine and pseu-doephedrine. Global seizures of P-2-P were equivalent to 6 per cent of global P-2-P imports, and phenylacetic acid seizures were equivalent to 4 per cent of global phenylacetic acid imports during the 2007-2012 period. |323| These were smaller proportions than for ephedrine and pseudoephedrine (based on UN COMTRADE data).
Seizures of P-2-P were reported by 22 Governments and seizures of phenylacetic acid by 20 Governments during the 2002-2012 period, fewer than the number reporting seizures of ephedrine or pseudoephedrine
During the 2002-2012 period, 38 per cent of global P-2-P seizures were made in Europe, which is the main amphetamine production centre, followed by East and South-East Asia (32 per cent) and North America (30 per cent). During the 2007-2012 period, most seizures were made in North America (50 per cent), where P-2-P has been used in the manufacture of methamphetamine. The largest seizures were reported by Mexico (38 per cent of the total), followed by the Netherlands and Canada (12 per cent each) and Belgium and China (10 per cent each).
In the case of phenylacetic acid, North America accounted for 98 per cent of total global seizures during the 20072012 period. Forensic profiling of seized methampheta-mine in the United States confirmed that nearly all methamphetamine is now being manufactured using phe-nylacetic acid or other P-2-P-based methods (94 per cent of all samples tested in the second quarter of 2012, up from 69 per cent in 2010 and close to 0 per cent in 2007). |324|
5. Key "ecstasy" precursors: 3,4-MDP-2-P, safrole, isosafrole and piperonal
(a) Use
The "traditional" precursor for the manufacture of MDMA ("ecstasy") is 3,4-methylenedioxyphenyl-2-propanone (3,4-MDP-2-P), also known as PMK (piperonyl methyl ketone) or in international trade statistics as 1-(1,3-ben-zodioxol-5-yl)propan-2-one. |325| Its licit use is limited.
Safrole, a precursor of 3,4-MDP-2-P and MDMA ("ecstasy"), is produced mainly from the sassafras plants. According to a study in South-East Asia, the plant is found largely in China, Myanmar and Cambodia |326|. Other studies reveal that it can also be produced from a number of plants grown in other parts of the world, notably in the Americas. |327| In East and South-East Asia, more than 360 plants containing essential oils rich in safrole were identified. The most widely used plants are those of the Cinnamomum genus |328|. Sassafras oil is used mainly in the manufacture of safrole, which is used in the manufacture of pesticides, insecticides and some fragrances. Safrole is also used for its antiseptic properties and as a pediculicide to treat lice. In addition, it serves as an additive in products such as root beer, sassafras tea or pinga com sassafras (Brazil). Given indications of its carcinogenic properties, however, safrole has been banned as a food additive in a number of countries, including the United States and several European Union countries. |329| Similarly, for health reasons, the International Fragrance Association issued a recommendation in 1987 to prohibit or limit its use in fragrance ingredients.
Isosafrole, another precursor of 3,4-MDP-2-P, is an isomer of safrole. Although it can be produced synthetically out of safrole, it is also derived from sassafras oil. It is used in the fragrance industry. Isosafrole is used for making soaps and perfumes, as well as in the manufacture of preservatives as an antiseptic agent. It is also a key precursor for the manufacture of piperonal.
Piperonal, a further precursor for 3,4-MDP-2-P and 3,4-methylenedioxyamphetamine (MDA), is another organic compound commonly found in fragrances and flavours. Piperonal occurs in a range of plants, including dill, violets, black pepper and vanilla, but it is also produced by oxidation of isosafrole. Piperonal itself is sometimes used in aromatherapy. |330|
(b) International trade
Fig. 25. Global exports of 3,4-MDP-2-P, safrole, isosafrole and piperonal, 1996-2012
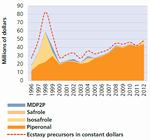
Click to enlargeSource: Data from UN COMTRADE.
In terms of legal trade, piperonal is nowadays by far the most important substance among the "ecstasy" precursor chemicals. Global piperonal exports increased during the 1996-2012 period, while exports of the other chemicals declined after reaching a peak in 1998. The strong decline in exports of "ecstasy" precursors between 1998 and 2000 was the result mainly of a fall in isosafrole exports, reflecting improvements in precursor control owing to a significant upward trend in "ecstasy" use in key markets in the 1990s (see figure 25).
A total of 38 Governments reported exports of "ecstasy" precursor chemicals during the 2007-2012 period, amounting to, on average, $42 million per year. Imports were reported by 102 Governments ($45 million per year). The largest exporters of'ecstasy" precursor chemicals were China (56 per cent) and Hong Kong, China (21 per cent). The largest importers were Hong Kong, China (18 per cent) and the United States (17 per cent), followed by Germany (9 per cent), Spain (7 per cent), Switzerland (7 per cent) and the United Kingdom (5 per cent). China was the largest net exporter during the 2007-2012 period.
The totals primarily reflect international trade in piperonal of about $41 million per year. Exports of the substance were reported by 26 Governments; imports were reported by 84 Governments.
The second most widely traded substance was isosafrole: 18 Governments reported exports and 53 reported imports. They recorded annual exports of about $1 million and imports of $2.8 million per year during the 2007-2012 period, again indicating some significant reporting gaps.
Exports of 3,4-MDP-2-P amounted to about $0.3 million annually, while imports totalled $1.5 million per year during the 2007-2012 period, again indicating inconsistencies in reporting. There were a total of15 Governments that reported exports and 46 that reported imports.
Fig. 26. International trade in potential "ecstasy" precursors in 3,4-MDP-2-P equivalents, 2007-2011
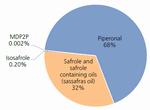
Click to enlargeSource: UNODC calculations based on International Narcotics Control Board, Precursors Report, 2012.
For safrole, 15 Governments reported exports and 45 reported imports. They recorded total exports of $0.09 million and imports of $0.17 million per year.
In both value and volume terms, piperonal is the most widely traded substance among MDMA precursors, according to UN COMTRADE data. Average annual exports during the 2007-2012 period amounted to 1,759 tons of piperonal, 62 tons of 3,4-MDP-2-P, 25 tons of isosafrole and 9 tons of safrole. If all of these exports are transformed into 3,4-MDP-2-P equivalents (based on the conversion ratios of the International Narcotics Control Board), the aggregated figure amounts to some 1,000 tons per year. The bulk of these exports in volume terms is accounted for by piperonal (91 per cent), followed by 3,4-MDP-2-P (6 per cent), isosafrole (2 per cent) and saf-role (1 per cent). Calculations on the import side reveal a similar pattern. |331|
Expressed in common 3,4-MDP-2-P equivalents, Board statistics suggest that about two thirds of international trade in "ecstasy" precursors relates to piperonal, and almost a third to safrole and oils rich in safrole. The other substances, isosafrole and 3,4-MDP-2-P, account for less than 1 per cent of the total (see figure 26).
Based on such figures, the overall international trade in (potential) "ecstasy" precursors would have amounted to, on average, 6,580 tons in 3,4-MDP-2-P equivalents during the 2007-2011 period. This is a significant discrepancy as it is more than six times the figure found in UN COMTRADE |332|. The differences, of course, raise questions as to the underlying reasons for this apparent over-reporting or underreporting by Member States in the case of "ecstasy" precursors.
(c) Trafficking
In line with global seizures of "ecstasy", the overall trend with regard to the seizure of "ecstasy" precursors was upwards in the 1990s, peaking in 2000 and again in 2007 before falling sharply during the 2007-2010 period and remaining, despite some recovery, at lower levels until 2012 (see figure 27). Overall seizures of "ecstasy" precursors amounted to some 16 tons per year during the 2002-2012 period and were thus far lower than seizures of amphetamine precursors (209 tons per year during the same period).
If total seizures during the 2002-2012 period are considered, most seizures of "ecstasy" precursors were for safrole (44 per cent), followed by 3,4-MDP-2-P (33 per cent), piperonal (23 per cent) and isosafrole (0.2 per cent). There have been frequent changes in the type of "ecstasy" precursors used, however. In most years during the 1996-2006 period, the "traditional" "ecstasy" precursor, 3,4-MDP-2-P, was the most widely seized substance. During the 20072012 period, improved controls of 3,4-MDP-2-P prompted organized criminal groups to look for alternatives, which led to the use of safrole and various safrole-containing oils. For the same period, about 85 per cent of all seizures of "ecstasy" precursors turned out to be related to safrole, 8 per cent to piperonal and only 7 per cent to 3,4-MDP-2-P. Less than 1 per cent were related to isosaf-role. All of this is in sharp contrast to licit international trade, which is dominated by piperonal.
Fig. 27. Global seizures of 3,4-MDP-2-P, safrole, isosafrole and piperonal, 1989-2012

Click to enlargeSource: International Narcotics Control Board, Precursors Report, 2013 (and previous years).
Seizures of all of the "ecstasy" precursors during the 2007-2012 period amounted to, on average, 13.5 tons or, expressed in 3,4-MDP-2-P equivalents (based on Board conversion ratios), 8.5 tons, equivalent to close to 1 per cent of global exports or imports of these substances. |333| This is a higher rate than for potassium permanganate or acetic anhydride, although a lower rate than for amphetamine precursors.
A breakdown by subregion of seizures of "ecstasy" precursors during the 2007-2012 period shows that more than two thirds (69 per cent) of seizures were in East and SouthEast Asia and a fifth of them in North America, followed by Oceania (6 per cent) and Europe (4 per cent).
Safrole was seized primarily in East and South-East Asia (82 per cent of the total during the 2007-2012 period), followed by North America, Europe and the Oceania region. The largest seizures were reported by Thailand and Malaysia, followed by Australia, the United States, Canada and Cambodia. Average global seizures of safrole rose almost fourfold between the 1989-2006 period (3,042 litres per year) and the 2007-2012 period (11,381 litres).
Piperonal was seized mainly in North America (accounting for 95 per cent of the total during the 2007-2012 period), followed by Europe. Global piperonal seizures amounted to, on average, 1.1 tons per year during the 2007-2012 period, down from 2.9 tons per year during the 1989-2006 period.
The "traditional" precursor of "ecstasy", 3,4-MDP-2-P, was seized mainly in North America (60 per cent during the 2007-2012 period) and in Oceania (35 per cent) and, to a lesser extent, in East and South-East Asia and Europe. The largest seizures were reported by Canada (60 per cent) and Australia (35 per cent). Global 3,4-MDP-2-P seizures amounted to, on average, 919 litres per year during the 2007-2012 period, down from 5,278 litres per year during the 1989-2006 period. China was often identified to be the most common source of this substance, although improved controls by that country have helped to reduce its availability. Given the shortage of illegal 3,4-MDP-2-P, there are indications, according to the Board, that India may be emerging as a new source. |334|
G. EFFECT OF PRECURSOR CONTROL ON THE SUPPLY OF ILLICIT DRUGS
The most obvious measure of the success of the precursor control system is the number of shipments that are stopped and the number of seizures made. There are, however, additional ways of measuring the effectiveness of precursor control, some of which are set out below.
1. Interception rates of diverted chemicals
Two figures are needed to estimate the interception rates of diverted chemicals: the amount seized and the amount required for the clandestine manufacture of the respective end product. The estimated amount of the chemicals required plus the amount seized gives an estimate of the total amount diverted. Expressing the seizures as a proportion of such diversions gives the interception rate.
Given the strong yearly fluctuations in seizures, the following calculations cover a longer period (2007-2012) and have been made for two substances: potassium permanganate and acetic anhydride. They reveal average interception rates of about 15 per cent of the chemicals diverted.
(a) Key chemical used in the manufacture of cocaine: potassium permanganate
Average annual global cocaine manufacture was an estimated 966 tons (range: 835-1,097 tons) over the period 2007-2012 |335|. On average, some 385 tons of potassium permanganate (range: 167-603 tons) per year were required for such cocaine manufacture over this period.When seizures are included, this suggests that, on average, some 450 tons (range: 232-668 tons) of potassium permanganate were diverted from licit channels during the period 2007-2012, which gives a global interception rate of diverted potassium permanganate of about 15 per cent (range: 10-28 per cent) for the period 2007-2012 |336| (see table 3).
This is a rather high interception rate, given the small proportion of diverted potassium permanganate as compared with the global international trade in the substance (2 per cent of global exports of potassium permanganate were diverted during the period 2007-2012) (range: 1-3 per cent; see table 4).
Global cocaine manufacture declined by about a quarter over the period 2007-2012 (range: 23-30 per cent), |337| which suggests that diversions of potassium permanganate may have declined by similar proportions. Falling seizures of potassium permanganate over that period may also indicate a reduction in diversion attempts.
Table 3. Global interception rate of potassium permanganate for the period 2007-2012
Minimum Maximum Midpoint Average annual global cocaine manufacture, 2007-2012 (tons) 835 1,097 966 Amount of potassium permanganate needed for the manufacture of 100 kg of cocaine 20 55 - Average annual amount of potassium permanganate required for illicit cocaine production (tons) 167 603 385 Average annual seizures of potassium permanganate (tons) 65 65 65 Average annual amounts diverted (tons) 232 668 450 Average annual interception rate (per cent)a 10 28 15 Source: UNODC estimates based on World Drug Report data.
a Minimum: 65 tons/668 tons = 10 per cent; maximum: 65 tons/232 tons = 28 per cent.Table 4. Diversion as a proportion of international trade in potassium permanganate, 2007-2012
Minimum Maximum Mid-point Average annual amounts of potassium permanganate diverted (tons) 232 668 450 Global average annual exports of potassium permanganate (tons) 22,186 22,186 22,186 Global average annual imports of potassium permanganate (tons) 17,233 17,233 17,233 Global average annual international trade (maximum export/import) (tons) 22,186 22,186 22,186 Diversion as a proportion of international trade (per cent) 1.0 3.0 2.0 Source: UNODC estimates based on data from the International Narcotics Control Board, World Drug Report and UN COMTRADE.
Table 5. Global acetic anhydride interception rate, 2007-2012
Minimum Maximum Midpoint Average annual global heroin manufacture, 2007-2012 (tons) 479 479 479 Amount of acetic anhydride needed for the manufacture of 100 kg of heroin (litres) 100 250 134 Average annual amounts of acetic anhydride required for the manufacture of heroin (litres) 479,000 1,197,500 641,860 Average acetic anhydride seizures, 2007-2012 (litres) 97,000 131,000 114,000 Average annual amounts diverted for the manufacture of heroin (litres) 576,000 1,328,500 755,860 Average annual interception rate (per cent)a 7 22 15 Source: UNODC estimates based on International Narcotics Control Board and World Drug Report data.
a Minimum: 97,000/(1,197,500+97,000) = 7 per cent; maximum: 131,000/(479,000+131,000) = 22 per cent.(b) Key chemical used in the manufacture of heroin: acetic anhydride
Global heroin manufacture was estimated at about 479 tons per year |338| during the period 2007-2012, resulting in requirements for some 642,000 litres (range: 479,0001,197,500 litres) of acetic anhydride per year for the manufacture of heroin. |339| Including seizures, |340| some 756,000 litres were diverted annually (range: 576,000-1,328,500) for use in the clandestine manufacture of heroin. That results in a global interception rate of about 15 per cent for acetic anhydride diverted for the manufacture of heroin |341| (range: 7-22 per cent) (see table 5).
This can be considered a rather high interception rate, given the extremely small proportion of acetic anhydride that is actually diverted as compared with the global international trade in the substance (0.2 per cent of global imports of acetic anhydride during the period 2007-2012 (range: 0.14 per cent-0.33 per cent) (see table 6)).
2. Reduction in drug availability
The present section focuses on the extent to which precursor control results in a reduction in the availability of drugs. A reduction in the availability of drugs may be brought about by seizing drugs or reducing the availability of the raw materials used in their manufacture. It must be pointed out, however, that the seizure of precursor chemicals is only one of the strategies used to reduce the illicit supply of precursors. The prime objectives of precursor control are preventing precursor chemicals from being diverted to illicit channels and identifying and dismantling clandestine laboratories. Thus, in quantitative terms, stopped shipments of suspicious chemicals are often more important than seizures of precursor chemicals. Nonetheless, seizures of precursor chemicals are quite significant when compared with seizures of end products.
Table 6. Estimated diversion as a proportion of international trade in acetic anhydride, 2007-2012
Minimum Maximum Midpoint Average annual amounts of acetic anhydride diverted for the manufacture of heroin (litres) 576,000 1,328,500 755,860 Global average annual international trade (imports) (litres) 405,218,382 405,218,382 405,218,382 Diversion as a proportion of international trade (per cent) 0.1 0.3 0.2 Source: Based on UN COMTRADE data.
Table 7. Precursor seizures in end product equivalents versus end product seizures, based on averages for the period 2007-2012
Chemical substance/precursor(s) Amount of drugs that could have been manufactured, in end product equivalents (in tons) Drugs Amount of drugs seized (street purity)
(in tons)Ratio of precursor seizures to end product seizures (per cent) Minimum Maximum Midpoint Potassium permanganate 118.6 326.1 222.4 Cocaine 674.4 33 Acetic anhydride 52.28 130.6 97.4 Heroin and morphine 103.1 95 3,4-MDP-2-P, safrole, isosafrole, piperonal 6.8 9.0 7.9 MDMA ("ecstasy") 6.7 118 Ephedrine, pseudo-ephedrine, norephe-drine, P-2-P, phenylacetic acid 163.1 226.1 194.6 Amphetamine and methamphetamine 81.9 238 Source: UNODC data from the annual reports questionnaire; and International Narcotics Control Board, Precursors Report, 2013.
(a) Seizures of precursor chemicals as compared with seizures of drugs
Another approach to assessing reductions in the availability of drugs is to compare seizures of precursor chemicals with seizures of drugs. This provides a comparison between the efforts, which target the end products, with precursor control efforts. Such an analysis for the period 2007-2012 reveals that seizures of potassium permanganate, expressed in terms of the amounts of cocaine that could have been produced with that chemical, were equivalent to about a third of actual cocaine seizures. The acetic anhydride seizures, expressed in terms of the amounts needed for heroin production, were almost equivalent to the total amounts of heroin and morphine seized. When converted into "ecstasy" equivalents, the total amount of "ecstasy" precursors seized over the period 2007-2012 exceeded actual "ecstasy" seizures by a fifth. When converted into amphetamine equivalents, total seizures of amphetamine and meth-amphetamine precursors were more than twice as high as actual seizures of amphetamine and methamphetamine (see table 7).
One of the explanations for the large amounts of amphetamine-type stimulant precursors seized could be that such precursors are often seized at the sites of clandestine laboratories. The amount of precursors often exceeds the end products found in those laboratories. An additional explanation is that the regions in which parts of the illegal production of amphetamine-type stimulants have traditionally taken place have invested heavily in precursor control in recent years. Moreover, much of the manufacture and consumption of amphetamines tends to be local or regional, while trade in or smuggling of precursor chemicals is often international and entails the crossing of borders. These aspects tend to facilitate the interception of precursors.
(b) Reductions in supply of drugs possibly linked to precursor control
Significant amounts of precursor chemicals have been intercepted in recent years. Taking precursors out of the market, however, may not be sufficient to yield a reduction in the supply of a drug. Nonetheless, in some cases, precursor control appears to have played a role in reducing the supply of drugs.
(i) Lysergic acid diethylamide
Lysergic acid diethylamide (LSD) was highly popular in several countries in the 1960s and the 1970s. However, consumption has declined in most parts of the world, including the main consumer markets, over the past two decades.
Data from England and Wales |342| showed a decline in LSD use among 16-24 year olds from 4.5 per cent in 1996 to 0.4 per cent during the 2012-2013 period, a decline of 90 per cent. A number of surveys in other countries also showed strong declines in LSD use. |343|
Table 8. Annual prevalence and perceived availability and risk of using LSD among twelfth-grade students in the United States, 1996-2013
Year Annual prevalence Perceived availability Perceived risk of harm "Fairly easy" or "very easy"
to get LSDTrying LSD once or twice
constitutes a great dangerUsing LSD regularly
constitutes a great danger1996 8.8 51.3 36.2 77.8 2013 2.2 24.5 34.9 66.8 Change (per cent) -75 -52 -4 -14 Source: Lloyd D. Johnston and others, Monitoring the Future National Survey Results on Drug Use: 1975-2013.
Data on secondary school students in the United States |344| showed a decline of 75 per cent in the use of LSD during the period 1996-2013. That decline occurred alongside a strong decline in the reported availability of LSD in the country (reduction of 52 per cent during the period 19962013), which seems to have been the prevailing factor in explaining the decline in its use (see table 8). |345| Improved controls over LSD precursors seem to have contributed to the reduction in the availability of LSD. Expressed in constant dollars, global exports of the main LSD precursors (ergotamine, ergometrine and lysergic acid) declined by 78 per cent between 1996 and 2012, which reduced the potential for diversion of those chemicals. |346|
(ii) Methaqualone
There are indications that the misuse of methaqualone, a sedative-hypnotic drug that has similar effects to barbiturates, is less widespread than it used to be. Precursor control appears to have played a role in that reduction. Initially widely used in North America, often under the brand name Quaalude, and in Europe (notably in the United Kingdom) in the late 1960s and early 1970s, it was listed as a controlled substance in the 1971 Convention and was eventually withdrawn from many developed markets in the early 1980s. Though some clandestine laboratories in Mexico and other countries continued underground production in the 1980s, improved controls of A-acetylanthranilic acid and anthranilic acid appear to have halted those activities since the 1990s.
However, methaqualone use became increasingly concentrated in South Africa. In the 1980s and the early 1990s, methaqualone, known locally as Mandrax, was the second-most-used drug in the country (after cannabis). While it is still used in South Africa, there are indications that its usage has declined. In 2000, 33 per cent of all treatment related to psychoactive substances (excluding alcohol) in four South African towns was reported to have been related to Mandrax; |347| this proportion fell to 19 per cent by 2011. |348| The decline in methaqualone use around the world is also reflected in seizures: global seizures declined from a peak of 54 tons in 1994 to 11 tons in 2002 and 0.2 tons in 2012. India (47 per cent of total) and South Africa (45 per cent), followed by China (7 per cent), reported the largest seizures of methaqualone during the 2000-2012 period. |349| At the same time, global legal exports of the two main methaqualone precursors, N-acetylanthranilic acid and anthranilic acid, fell by some 70 per cent between 2002 and 2012. |350|
(iii) "Ecstasy"
The availability of MDMA ("ecstasy") has declined in recent years, which appears to have been largely a result of improved precursor control at the global level, notably in China. |351|
Reduced availability had an impact on "ecstasy" use. Declines in the use of "ecstasy" were reported from a number of countries in Europe, North America and Oceania in recent years. In England and Wales, a key "ecstasy" market in Europe, use of the drug declined from a peak of 6.8 per cent among 16-24 year olds during the 2001-2002 period to 2.9 per cent during the 2012-2013 period. |352|
Table 9. Annual prevalence and perceived availability of and risk of using "ecstasy" among twelfth-grade students in the United States, 2000-2013
Year Annual prevalence Perceived availability (per cent) Perceived risk (per cent) "Fairly easy" or "very easy"
to get "ecstasy"Trying "ecstasy" once or twice
constitutes a great danger2000 3.6 51.4 37.9 2013 1.5 35.1 47.5 Change (per cent) -58 -32 25 Source: Lloyd D. Johnston and others, Monitoring the Future National Survey Results on Drug Use: 1975-2013.
This was not an exception: most European countries reported declines over the past few years and overall "ecstasy" consumption in countries of the European Union and the European Free Trade Association appears to have fallen by almost half among those aged 15-34 in recent years, based on a comparison of the pooled results of recent surveys for the 2007-2012 period with surveys for the 1998-2006 period. |353| General population surveys also indicate declines in the use of "ecstasy" in Oceania, as well as a sharp decline (of more than 50 per cent) in North America in recent years (see figure 28).
Fig. 28. Trends in the annual prevalence of "ecstasy" use
among the adult population in selected countries in Oceania, Europe and North America
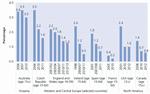
Click to enlargeSource: Australian Institute of Health and Welfare, 2010 National Drug Strategy Household Survey Report, Drug Statistics Series No. 25 (Canberra, July 2011); United States, Department of Health and Human Services, Substance Abuse and Mental Health Services Administration, Results from the 2012 National Survey on Drug Use and Health: Summary of National Findings, NSDUH Series H-46, HHS Publication No. SMA 13-4795 (Rockville, Maryland, 2012); Drug Misuse: Findings from the 2012 to 2013 Crime Survey for England and Wales; and European Monitoring Centre for Drugs and Drug Addiction, Statistical Bulletin 2013.
Data from the ongoing United States study Monitoring the Future, undertaken by the Institute for Social Research at the University of Michigan, show that the annual prevalence rate of "ecstasy" use among students in the twelfth grade fell by 58 per cent between 2000 and 2013. That went hand in hand with a decline of about 32 per cent in the perceived availability of "ecstasy". While the number of those who considered that there was a great risk in taking "ecstasy" increased between 2000 and 2005, they declined thereafter, and the perceived availability of "ecstasy" on the market declined during the 2000-2013 period (see table 9).
There are also indications in other countries that the decline in the availability of MDMA has played a key role in the decline of "ecstasy" use. Overall exports of "ecstasy" precursors fell by 41 per cent between 1998 and 2012. |354| Average annual seizures of "ecstasy" precursors declined by 57 per cent during the 2007-2012 period compared with the 2000-2006 period. At the same time, average annual seizures of the end product, "ecstasy", fell by 39 per cent over the same period and by 70 per cent between 2007 and 2012. The proportion of MDMA found in substances sold as "ecstasy" also declined. |355| All those data suggest that improvements in the control of "ecstasy" precursors at the global level have played a key role in reducing the availability of MDMA, which, in turn, has been an important factor in the decline in "ecstasy" use.
(c) Price: the case of acetic anhydride
Another expected impact of precursor control should be a measurable increase in the prices paid by operators of clandestine laboratories, and hence in illicit production costs, as compared with the normal licit market prices. This is demonstrated in the case of acetic anhydride.
(i) Import and export prices
The average global export and import prices of acetic anhydride, |356| if traded in large quantities, amount to about $1 per litre, according to UN COMTRADE data. They did not change much during the period 2007-2012. Export prices in all major exporting countries fluctuate around that figure. Similarly, according to a market analysis by the International Narcotics Control Board, wholesale prices for acetic anhydride fluctuate around $1.50 per litre. |357|
Of 46 countries for which export prices could be established, 34 indicated an export price of less than $5 per litre over the 2007-2012 period. Higher export prices were reported by, inter alia, some countries along the Balkan route and countries along the "silk route". Similarly, import prices exceeding $5 per litre were reported in, inter alia, several countries along the Balkan route and along the "silk route", as well as countries in East and South-East Asia. It is not clear if the higher prices reflect different market dynamics or attempts by some intermediaries to purchase acetic anhydride for non-legal purposes.
(ii) Prices paid by operators of clandestine heroin laboratories
The prices paid by operators of clandestine laboratories, in general, tend to be far higher than those paid for acetic anhydride on the licit market. In Afghanistan, the world's largest opium-producing and heroin-manufacturing country, average prices for acetic anhydride during the 20082011 period were reported to have ranged from $300 to $430 per litre (see figure 29), clearly exceeding the price of about $1 charged by the main licit suppliers of the substance.
(iii) Differences in prices depending on the source
Fig. 29. Prices of acetic anhydride per litre in Afghanistan, in dollars, 1998-2013
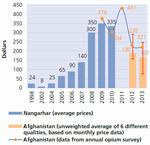
Click to enlargeSource: UNODC, The Global Afghan Opium Trade: A Threat Assessment; UNODC and Afghanistan, Ministry of Counter Narcotics, opium surveys; and Afghanistan drug price monitoring monthly reports.
Trafficking in acetic anhydride into Afghanistan emerged as a lucrative business as it had limited risks compared with drug trafficking even though traffickers are forced to take the more expensive option of smuggling acetic anhydride from countries where it has already been diverted. During the 2007-2010 period, the prices in Asia of acetic anhydride from illicit sources ranged from $4-$6 in the Republic of Korea, $12 in China and $60 in India to $200-$300 in Pakistan. In Europe, they were reported to have ranged from $25 in Slovakia and $100 in Bulgaria to $200-$225 in Turkey, all in 2010. |358|
Nonetheless, some traders have been making extraordinarily high profits. In a seizure case in 2008, an Afghan trafficker admitted procuring 12 tons of acetic anhydride from the Republic of Korea, for which $50,000 had been paid. |359| That equated to a purchase price of about $4 per litre, at a time when the average wholesale price of acetic anhydride in Nangarhar, Afghanistan, stood at about $300 per litre (see figure 29).
(iv) Differences in price linked to perceived quality
Prices also differ significantly according to perceived quality. In total, six different quality levels of acetic anhydride are regularly monitored in Afghanistan. The monthly price monitoring data for Afghanistan in 2013 showed a range from $76 per litre for quality "C" acetic anhydride in December 2013 to $247 per litre in July 2013 for quality "A" acetic anhydride. |360| Differences in the price of acetic anhydride in Afghanistan often go hand in hand with differences in the perceptions of the origin of the substance. |361|
(v) Changes of price over time
In addition, prices change significantly over time. Average annual prices of a litre of acetic anhydride amounted to an average of $24 (range: $13-$34) in Afghanistan in 1998. Following the ban on opium production in 2001, heroin manufacture also declined, as did the demand for acetic anhydride. As a consequence, acetic anhydride prices fell to a low of $8 per litre in Nangarhar in 2002. Average annual prices in Afghanistan as a whole increased thereafter to more than $430 per litre by 2011, before decreasing in 2012 and 2013.
Price increases over the 2002-2011 period, notably between 2007 and 2011, may be linked to improvements in precursor control. One element at the international level may have been the rescheduling of acetic anhydride from Table II to Table I of the 1988 Convention in 2001, which resulted in tightened international control, owing to the increasing use of pre-export notifications. In addition, various international cooperation efforts, such as Project Cohesion, reduced the readiness of companies to provide significant quantities of acetic anhydride to unknown or suspicious customers. In 2008, the Afghan authorities officially prohibited all imports of acetic anhydride. |362| Precursor control efforts were also strengthened in Pakistan (which started seizing acetic anhydride 2008 onwards), the Islamic Republic of Iran and some other countries in the vicinity of Afghanistan. |363| In parallel, average annual seizures of acetic anhydride at the global level rose from 46,000 litres per year during the 2004-2007 period to 147,000 litres per year during the 2008-2010 period, and then to 198,000 litres in 2011, thus contributing to a shortage on the Afghan market.
In 2012, however, global seizures of acetic anhydride fell by more than half to about 89,000 litres. At the same time, acetic anhydride prices in Afghanistan fell from $431 per litre to $230 per litre, which suggests that the availability may have increased.
Some of the increases in the price of acetic anhydride between 2002 and 2011 may also have been linked to the expansion of opium production in Afghanistan, and thus the higher demand for acetic anhydride to convert morphine into heroin. This relationship, however, is complex. Acetic anhydride prices in Afghanistan only partially followed the trends of opium production. In fact, the statistical correlation between Afghan opium production and acetic anhydride prices in Afghanistan during the 2002-2013 period is weak (r = 0.17), and not statistically significant.
In 2011, opium production, as well as seizures of heroin and morphine, increased sharply. The increase may have reflected an underlying growth in Afghan opiate manufacture, resulting in greater demand for acetic anhydride, which may explain the further price rise of that substance in 2011.
The situation changed again in 2012, when both opium production and heroin seizures fell in Afghanistan. The apparent decline in Afghan heroin manufacture seems to have prompted a decline in the demand for acetic anhydride. At the same time, the sharp decline in global seizures of acetic anhydride in 2012 may have eased the previous shortage of the chemical. In parallel, a worsening security situation facilitated the smuggling of acetic anhydride into the country. All of this contributed to a reduction of the risk premium and, thus, to lower acetic anhydride prices in 2012. The trend also continued in 2013, leading the International Narcotics Control Board to express fear that the supply of acetic anhydride may be rising again in Afghanistan. |364|
(vi) Importance of the illicit acetic anhydride market in Afghanistan
Based on data contained in the UNODC study The Opium Economy in Afghanistan: An International Problem, |365| the overall size of the acetic anhydride market may have been about $5 million in 2002. The market increased drastically over the next few years. By 2009, the total amount of acetic anhydride smuggled into Afghanistan was estimated at between 380 and 570 tons (midpoint estimate: 475 tons). Prices typically ranged between $250 and $450 per litre at the time, which resulted in a market value of between $130 and $200 million in 2009 (midpoint estimate: $165 million). |366|
Based on data reported in UNODC, Afghanistan: Opium Survey 2013, |367| demand for acetic anhydride may have amounted to between 525 and 735 tons in 2013 (midpoint estimate: 630 tons). As a result of falling prices, the overall acetic anhydride market in Afghanistan appears to have fallen to between $116 and $162 million (midpoint estimate: $140 million). |368| That is equivalent to about 0.7 per cent of Afghan GDP and compares with a total (farm-gate) value of Afghan opium production of about $950 million in 2013.
(vii) Acetic anhydride as a cost factor in heroin manufacture
The high prices of acetic anhydride in Afghanistan during the 2008-2011 period, which ranged from $300-$430 per litre, became an important cost factor for Afghan heroin manufacturers.
An estimate of heroin manufacture costs in Afghanistan revealed that acetic anhydride accounted for a mere 2 per cent of the total in 2002. |369| In contrast, an estimate in May 2010 |370| found overall production costs of about $1,600 per kilogram of brown heroin (up from less than $600 in 1998 |371|). The bulk of the cost came from opium (73 per cent) and acetic anhydride (26 per cent). Other chemicals such as activated carbon (charcoal), ammonium chloride, calcium oxide, hydrochloride acid, acetone and concentrated ammonia solutions accounted for just 1 per cent of the total cost.
Fig. 30. Estimated proportions of acetic anhydride in total heroin manufacture costs in Afghanistan, 2002-2013

Click to enlargeSource: Estimates based on The Opium Economy in Afghanistan: An International Problem; The Global Afghan Opium Trade: A Threat Assessment; and Afghanistan: Opium Survey 2013.
The increase could have been even larger, but clandestine laboratory operators seem to have reacted to the rising prices of acetic anhydride by minimizing its use to about 1 litre per kilogram of heroin, often compromising on the quality of the heroin manufactured. While typical purity for Afghan heroin destined for overseas export had remained at about 70 per cent (range: 50-80 per cent) |372| for years, data sent to UNODC by the Special Testing and Research Laboratory of the Drug Enforcement Administration of the United States showed that the average purity of heroin samples seized across Afghanistan had fallen to 37 per cent in 2007 and 32 per cent in 2008. |373| The forensic laboratory of the Counter Narcotics Police of Afghanistan confirmed that many heroin samples continued to have a low level of purity in the first six months of 2011. |374|
In 2011, the cost of acetic anhydride as a proportion of total heroin manufacture costs appeared to have remained at the same level as in 2010 (about 26 per cent), before declining in 2012 and 2013 as a result of falling acetic anhydride prices. Based on data reported in UNODC, Afghanistan: Opium Survey 2013, and based on the use of 1.5 litres of acetic anhydride per kilogram of heroin, the proportion of acetic anhydride in the overall production costs for heroin ($1,500-$1,600 per kilogram) declined to some 20 per cent of total manufacture costs by 2013. That is, however, still 10 times higher than in 2002 (see figure 30).
H. REACTIONS OF CLANDESTINE OPERATORS FACING STRONGER PRECURSOR CONTROLS
Improved precursor controls at the global level have prompted clandestine operators of illegal laboratories to develop a number of counterstrategies, including the use of more sophisticated ways to obtain precursor chemicals, and substitute them with non-controlled "pre-precursors" to manufacture the needed precursors, as well as the development of new psychoactive substances to which the current controls do not apply. While all of these counterstrategies constitute a challenge for the ongoing development of precursor control at the national, regional and international levels, they are at the same time an indication that precursor control is having an impact.
1. More sophisticated ways to obtain precursor chemicals
(a) Creation of specialized groups to obtain precursor chemicals
One of the strategies of operators of clandestine laboratories has been to hire specialists to organize the purchase of precursor chemicals. Such specialists are well aware of the actual status of the implementation of the 1988 Convention by various Governments. Moreover, they tend to be well connected and often can guarantee the supply of the chemicals. In general, chemical trafficking organizations have become increasingly resourceful, organized and adaptable in order to circumvent the growing number of control measures. |375|
(b) Creation of front companies
Investigations made in El Salvador and Guatemala revealed the set-up of front companies or the use of existing companies operating in industries in which there is a well-established licit demand for the required chemicals. While the competent national authorities are, in general, well aware of the kind of business in which the controlled chemicals are used, it is far more difficult for them to identify actual requirements, as it is often possible to substitute one chemical for another. Unless regularly monitored, or if no inside information from competitors or employees is provided, such diversions of chemicals from licit front companies can remain undetected for many years. Nonetheless, the authorities in a number of countries have been successful in dismantling at least some such companies. |376|
(c) Identification of weak links in the international control system
Another strategy has been to identify weak links in the international control system and to use them as sources for the purchase of precursor chemicals. While practically all countries have signed and ratified the 1988 Convention (187 out of 193 United Nations Member States), there are still a number of countries that have not invoked article 12, paragraph 10 (a), of that Convention and do not require pre-export notifications.
This applies to a number of countries in Africa, as well as some countries in Central America, Western and Central Asia, South-East Asia and Oceania. Those countries are particularly vulnerable to being targeted as transit countries by precursor trafficking organizations.
The same applies to countries that have yet to register with the PEN Online system -- mostly countries in Africa -- and to countries that do not participate in PICS -- again mostly African countries, as well as some countries in South America, the Near and Middle East, Central Asia, South-East Asia and Europe. In fact, the International Narcotics Control Board has in recent years identified a number of shipments of controlled chemicals that transited such countries in Africa, Central America, South America, the Near and Middle East, Central Asia, South-East Asia and the Balkan region.
A special case is Taiwan Province of China, which has a highly sophisticated chemical industry, including for the manufacture of several precursor chemicals; however, owing to its status, it does not participate in international precursor control efforts such as issuing pre-export notifications, participating in PICS and providing relevant information on seizures and suspicious shipments to the International Narcotics Control Board. According to the United States Department of State, in 2011 Taiwan Province of China was the third largest importer of ephedrine and the third largest exporter of pseudoephedrine worldwide. |377| It also trades in a number of other substances under international control, including acetic anhydride. Methamphetamine laboratories have been detected by the authorities. Significant seizures of precursors in recent years have been made by the local authorities. |378| Even though they may act in good faith, the mere fact that significant quantities of such substances are traded outside the international precursor control system constitutes an inherent risk that such trade flows may be diverted. The Board thus stressed in its latest report that "the current situation represents a significant weakness in the international control system." |379|
(d) Identification of weaknesses at the national level (diversion from domestic sources)
Given the ongoing improvements in the control of the international trade in precursor chemicals, another strategy has been to identify weaknesses at the national level in individual countries. Organized criminal groups targeting precursor chemicals often do not wait until the chemicals enter the international market and thus become subject to tight monitoring. Instead, they divert the chemicals in the original manufacturing country, or in some subsequent transit country that has a legitimate demand for such chemicals. The chemicals are then smuggled out of that country to the final country of destination, thus bypassing the international control system developed for monitoring the international trade in such substances.
In this regard, the organizations trafficking precursor chemicals use methods similar to drug trafficking organizations. Their advantage, however, is that the customs and port authorities of most countries are not as well equipped to detect smuggled precursor chemicals as they are to detect smuggled drugs. Moreover, the penalties in most countries are less severe for trafficking of precursors than for drug trafficking, while profit margins can be very high.
(e) Use of the Internet
Another strategy has been to expand the supplier base by looking for new suppliers on the Internet. The specific problems related to the Internet addressed in chapter 1, in the box titled "the 'dark net' bitcoins and the increasing sophistication of online drug sales", apply to precursors as well.
2. Use of alternative precursors
(a) Pharmaceutical preparations
One way to circumvent the rules governing the international trade in bulk chemicals has been to focus on pharmaceutical preparations containing precursor chemicals. |380| Pharmaceutical preparations are largely excluded by the 1988 Convention, which states, in article 12, paragraph 14, "The provisions of this article shall not apply to pharmaceutical preparations, nor to other preparations containing substances in Table I or Table II that are compounded in such a way that such substances cannot be easily used or recovered by readily applicable means". The lack of controls has, in particular, affected pharmaceutical preparations containing ephedrine and pseudoephedrine. While such substances contained in nasal decongestants, bron-chodilators and various cold medicines have positive properties for persons in need, they can be misused.
In this context, in the 2009 Political Declaration and Plan of Action, Member States were explicitly asked to prevent the diversion of such pharmaceutical preparations from domestic and international trade (Plan of Action, para. 41 (s)). In the light of continuing challenges, the Commission on Narcotic Drugs adopted resolution 54/8 in March 2011, in which Governments were encouraged to adopt regulatory frameworks to control the production, distribution and commercialization of pharmaceutical preparations containing ephedrine and pseudoephedrine, to utilize the PEN Online system and to apply similar control measures for such pharmaceutical preparations as for bulk precursor chemicals.
Global seizures of pharmaceutical preparations containing ephedrine or pseudoephedrine increased from negligible levels in the 1990s to 5.6 tons in 2006 and 36.1 tons in 2011 before falling again to 4.1 tons in 2012. The largest diversions of ephedrine and pseudoephedrine preparations over the period 2007-2012 were reported from North America (60 per cent) and East and South-East Asia (20 per cent), the two largest methamphetamine-producing regions, followed by the Oceania region (10 per cent), Europe (4 per cent), South Asia (4 per cent), and Central America and the Caribbean (2 per cent); smaller amounts were seized in South America and West Asia. |381| The number of Governments reporting seizures of pharmaceutical preparations containing such substances amounted to 37 over the period 2007-2012, including 18 reporting seizures of ephedrine preparations and 28 reporting seizures of pseudoephedrine preparations. |382| About 17 per cent of all ephedrine and pseudoephedrine seizures over that period were in the form of pharmaceutical preparations.
Awareness of such problems rose following a number of operations conducted under the auspices of Project Prism in recent years. While in Operation Crystal Flow, conducted in 2007, more than 90 per cent of the ephedrine and pseudoephedrine seizures were still related to bulk ephedrine and pseudoephedrine, that proportion fell to less than 75 per cent in Operation Ice Block in 2008 and to just a third in Operation Pila, conducted in 2009 and early 2010. |383|
Post-operational communications issued between April 2010 and August 2012 led to the seizure of 8.8 tons of ephedrine in bulk and more than 24 tons in the form of preparations, i.e. 73 per cent of the ephedrine and pseu-doephedrine seized was in the form of pharmaceutical preparations, |384| clearly indicating the rapidly growing role of pharmaceutical preparations as inputs for the manufacture of methamphetamine. Before 2010, several of the stopped shipments of pseudoephedrine preparations went from South Asia and South-East Asia with the destination of Central America and Mexico, but the shipments to Mexico have declined following stricter controls in that country. |385|
(b) Use of substitute chemicals and "pre-precursors"
Fig. 31. Use of non-controlled substitute chemicals in the manufacture of amphetamine-type stimulants
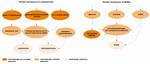
Click to enlargeSource: UNODC, Global Smart Update, vol. 7, March 2012, pp. 5-6.
Note: alpha-phenylacetoacetonitrile (APAAN) will be internationally controlled in 2015.Another strategy of the operators of clandestine laboratories has been to shift from substances controlled under the 1988 Convention to non-controlled substitute chemicals and/or to non-controlled "pre-precursors". Instructions on the use of such chemicals are also available on the internet.
Examples of such substitute chemicals for the manufacture of amphetamine or methamphetamine are: APAAN, various esters of phenylacetate and P-2-P bisulfite adduct (see figure 31). An example for the manufacture of "ecstasy" is 3,4-MDP-2-P methyl glycidate, sometimes abbreviated as MMDMG or PMK-glycidate. Substances such as the bisulfite adduct of P-2-P and MMDMG are often also referred to as "masked" precursors, as their use helps criminals to conceal the normal form of precursors of amphetamine-type stimulants by packaging and smuggling them in a way that has heretofore been rather uncommon and thus difficult for law enforcement agencies to detect.
(i) alpha-Phenylacetoacetonitrile: a precursor for P-2-P
An example of the use of substitute chemicals has been the ever wider use of APAAN, until recently a non-controlled precursor that can be easily converted into P-2-P at a ratio of 1.4 to 1. |386| It emerged as a substitute chemical for P-2-P-based manufacture of methamphetamine in Asia and for P-2-P-based amphetamine laboratories in Europe, thus circumventing the improved controls over P-2-P.
APAAN was originally discovered in a large-scale methamphetamine manufacturing laboratory in Malaysia in 2006, and since 2009 has been seized in various European countries. |387| The International Narcotics Control Board reported that in 2011 three European countries seized APAAN totalling more than 3.5 tons, of which the bulk was seized in the Netherlands. |388| For 2012, six European countries reported seizures totalling 17.5 tons, with the largest seizures reported from Belgium, the Netherlands and Hungary. Seizures of P-2-P, in contrast, declined in Europe from some 5,500 litres in 2010 to 2,700 litres in 2011 and 800 litres in 2012, |389| possibly indicating a shift away from P-2-P towards APAAN.
Between April and October 2012, authorities in Belgium, Bulgaria, the Netherlands and Romania communicated 17 incidents involving 13.6 tons of APAAN, all of which originated in China. Over the period November 2012-November 2013, 29 incidents were communicated, affecting Austria, Belgium, Estonia, France, Germany, Latvia, Luxembourg and the Netherlands, with the latter country accounting for almost half of all incidents. |390| It appears that the final destination of the shipments was the Netherlands, while the shipments of APAAN typically originated in China. |391|
The misuse of APAAN, however, is not just a European problem. In 2012, Canada informed other countries of the seizure of two shipments of APAAN totalling 6.7 tons. The two shipments originated in China. |392|
The increased trafficking in APAAN has been attributed to its availability and low cost. As a consequence, the International Narcotics Control Board recommended to the Commission on Narcotic Drugs that APAAN be included in Table I of the 1988 Convention. |393|
(ii) Esters of phenylacetic acid and other non-scheduled precursors for the manufacture of amphetamines
Ethyl phenylacetate and methyl phenylacetate
Another example of the spread of non-controlled substances as precursor chemicals has been the use of various esters of phenylacetic acid. |394| While phenylacetic acid is a controlled substance under the 1988 Convention, this is not the case for its esters. |395| Examples of such trafficked esters are ethyl phenylacetate and methyl phenylacetate. Both can be easily converted into phenylacetic acid.
Significant amounts of such esters were seized as part of the International Narcotics Control Board's Operation Phenylacetic Acid and its Derivatives, launched in March 2011. It led to seizures of some 610 tons of derivatives of phenylacetic acid in ports, warehouses and laboratories in Latin America. Mexico alone seized 421 tons. The operation also led to important seizures in Belize, El Salvador, Guatemala and Nicaragua. Ethyl phenylacetate was the most commonly identified ester. |396| Mexico seized 369 tons and 177,000 litres of ethyl phenylacetate in 2011 and El Salvador seized 157 tons. In addition, Mexico seized 313,000 litres of methyl phenylacetate in 2011. Those were substantial amounts, exceeding seizures of other methamphetamine precursors. |397|
Though there have been declines in seizures since 2011, they remain significant. Authorities in Mexico, where ethyl phenylacetate has been under control since 2009, reported the seizure of 72 tons and 46,000 litres in 2012 |398| and Guatemala reported the seizure of 16 tons in a warehouse in 2012. As in previous incidents, the chemical had originated in China. |399|
Despite extensive misuse of the esters of phenylacetic acid for the clandestine manufacture of methamphetamine, no attempts have been made to schedule them at the international level.
(iii) Phenylacetamide, benzylchloride, hypophos-phorous acid, styrene, benzaldehyde and benzyl cyanide
Even if all of the esters of phenylacetic acid were controlled, there would still be a large number of substitute chemicals available. For instance, the Mexican authorities reported the seizure in 2011 of a variety of other non-scheduled chemicals used in the manufacture of methamphetamine, including phenylacetamide (300 tons), benzylchloride (77,000 litres) and small amounts of 2-phenylethanol. Earlier, the Mexican authorities had reported seizures of hypophosphorous acid (1,941 litres in 2009). Large amounts of that substance were also seized in Canada (9.8 tons). In 2012, the Australian authorities reported the seizure of 11 tons of hypophosphorous acid in New South Wales. |400|
In June 2012, the Mexican authorities dismantled a methamphetamine laboratory where styrene, an industrial starting material for the production of plastics (polystyrene), was used as a key precursor. In 2007, there was a report of some smaller seizures of styrene in Australia. |401|
In Europe and in Asia, Governments have reported seizures of a number of other non-scheduled pre-precursors for P-2-P in recent years, including benzaldehyde and benzyl cyanide. Larger amounts were seized in the Philippines (2,400 litres), while smaller amounts of benzaldehyde (less than 100 kg) were seized in 2012 in Estonia, Germany, Hungary, Poland and the Russian Federation. In 2012, attempts were also made to smuggle benzyl cyanide to Lebanon (520 litres), together with equipment for illicit amphetamine manufacture. |402|
(iv) Substitute chemicals for the manufacture of "ecstasy": 3,4-MDP-2-P methyl glycidate
Substitute chemicals have also emerged for the manufacture of MDMA ("ecstasy"), notably following the introduction of improved controls over 3,4-MDP-2-P by China. This led to a shortage of "ecstasy" precursors over the period 2007-2010. In the Netherlands, which is identified by many European countries as the source of "ecstasy", the content of MDMA in products sold as "ecstasy" fell from some 90 per cent over the 2000-2004 period to around 70 per cent in 2009 before recovering to 82 per cent in 2010 and 91 per cent in 2011. |403| Recent trends indicate a further recovery of the "ecstasy" market. This has been made possible by the increasing use of saf-role-rich oils and the "discovery" of a number of non-controlled substitute chemicals. One such chemical is 3,4-MDP-2-P methyl glycidate, which can be easily converted into 3,4-MDP-2-P. It is frequently made out of piperonal (a controlled "ecstasy" precursor). |404|
3,4-MDP-2-P methyl glycidate was initially detected in Australia in 2004, following the seizure of a 44-gallon drum mislabelled as glycidyl methacrylate, which the authorities expected to be linked to MDMA production. |405| In 2010 the substance was found in the Netherlands, |406| together with instructions on how to convert it into "ecstasy". In total, the Netherlands authorities seized 1.2 tons of the substance in 2010, including 1 ton seized in an air-freight shipment from China that had been mislabelled. Subsequently, the substance also appeared in Slovakia, Belgium, Poland and Estonia |407| as well as in Denmark in a shipment that had originated in China and was destined for the Netherlands. |408| Over the period November 2012-November 2013, the Netherlands authorities reported the seizure of only 690 grams of 3,4-MDP-2-P methyl glycidate, intercepted at the Amsterdam airport in a package sent from China via a courier service to the Netherlands. The substance was mislabelled as methyl cellulose. |409|
(v) Methylamine: a universal precursor in the manufacture of amphetamine-type stimulants
Fig. 32. Global seizures of methylamine, 2007-2011
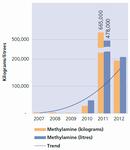
Click to enlargeSource: International Narcotics Control Board, Precursors Report, 2012, figure III.
Methylamine is another non-scheduled chemical that has emerged in recent years in the clandestine manufacture of amphetamine-type stimulants. When combined with P-2-P, it can be used for the manufacture of methamphetamine or, if combined with 3,4-MDP-2-P, it can produce "ecstasy".
On the basis of seizure patterns, the largest amounts of this chemical appear to be currently used for the manufacture of methamphetamine. Seizures of methylamine have been reported in increasing numbers since 2004, primarily by countries in North America, though seizures have also been made in Oceania, Europe and East and South-East Asia.
Following years of seizures totalling a few hundred kilograms, the amounts seized rose to 665 tons and 478,000 litres in 2011 (see figure 32). Large-scale seizures also continued in 2012 (197 tons and 208,000 litres). |410| Though smaller than a year earlier, they still exceeded seizures of "traditional" precursors of amphetamine-type stimulants (less than 50 tons in 2012). |411|
The largest seizures of methylamine in recent years have been reported by Mexico, where this chemical has been controlled since November 2009. In 2010, Mexico reported seizures of 44.3 tons and 47,300 litres of methylamine and it accounted for more than 90 per cent of global seizures of this substance. The next largest seizures were reported by the Netherlands, followed by Canada and the United States. By mid-2011, Mexico had reported three seizures of methylamine at seaports, totalling more than 154,000 litres, originating in China. |412| Large seizures were also reported in some countries in Central America. El Salvador seized almost 69 tons in two shipments in June 2011, destined for Guatemala. |413| In 2011, Mexico accounted for 56 per cent of global seizures of methylamine, followed by the United States (38 per cent). |414| In 2012, seizures of methylamine took place again primarily in Mexico (197 tons and 150,000 litres), followed by Honduras (51,000 litres), the United States (6,929 litres) and Poland (403 litres). |415|
3. Production of new psychoactive substances
Another strategy to circumvent controls of precursor chemicals has been to opt for the manufacture of new psychoactive substances. As of end-2013, 348 such substances had been identified, exceeding the number of substances already under international control (234 in 2013). The categories of such substances most frequently identified have been, in order of frequency, synthetic cannabinoids, phenethylamines, synthetic cathinones, tryptamines, various plant-based substances, piperazines, phencyclidines and ketamine, as well as aminoindanes. |416|
Given the lack of a global control mechanism for new psychoactive substances, the chemicals needed to produce them are, in general, easy to obtain. This offers plenty of opportunities for operators of clandestine laboratories to acquire such chemicals and use them in the manufacture of new psychoactive substances. Nonetheless, for the time being, trafficking in these chemicals at the global level seems to be rather limited.
The analysis of the precursor control sector highlights the substantial progress made over the past two decades, since the international community, in the 1988 Convention, adopted precursor control as one of its strategies to fight illegal drug production. While drug production has not been eliminated by the introduction of precursor control measures, there is sufficient evidence to show that precursor control has had an impact on the illicit manufacture of some drugs. Over the period 2007-2012, about 15 per cent of the diverted precursor chemicals acetic anhydride and potassium permanganate was seized. Reductions in LSD use and "ecstasy" use in recent years appear to have been linked, inter alia, to improved precursor controls.
The new strategies of operators of clandestine laboratories clearly highlight, at the same time, the challenges that precursor control will face in the future, as ever more new chemical substances emerge and are able to replace "traditional" precursor chemicals.
Some of the instruments for dealing with this problem are already in place. In line with the request contained in the Political Declaration adopted by the General Assembly at its twentieth special session, in 1998, and its related action plan on precursor chemicals, a limited international special surveillance list of substances not in Tables I and II of the 1988 Convention is regularly prepared and updated by the International Narcotics Control Board to help authorities to identify potential precursor shipments. The 1998 action plan on precursors also provided that Member States should apply monitoring measures, in cooperation with the chemical industry, to prevent the diversion of substances included on the special surveillance list, and Member States were asked to consider making the diversion of non-scheduled chemical substances a criminal offence. Moreover, in the 2009 Political Declaration and Plan of Action, Member States were invited to expand the use of pre-export notifications to include non-scheduled substances and pharmaceutical preparations. In the 2009 Plan of Action, Member States were also asked to increase efforts to prevent precursors from domestic channels from being smuggled across borders.
While all of these actions have been agreed on by Member States, they await implementation in a number of countries. The challenge is the effective and universal implementation of the international instruments.
At the same time, it is important to note that most precursor chemicals have a wide spectrum of legitimate uses. Any control system, whether local or international, must thus be aimed at effectively limiting the availability of such chemicals for operators of clandestine laboratories, while guaranteeing that licit manufacture of, trade in and use of such chemicals are not jeopardized.
[Source: United Nations Office on Drugs and Crime, Vienna, Jun14]
TABLES
Cannabis
Cannabis cultivation, production and eradication, 2012
Country Cultivated
(ha)Eradicated
(ha)Harvestable
(ha)Production
(tons)Plants
eradicatedSites
eradicatedIndoor Outdoors Indoors Outdoors Indoors Outdoors Afghanistan 10,000 1,400 Albania 50 33,00 154 Australia 17,668 35,146 322 240 Azerbaijan 6 6 0 308 7,538 121 Bosnia and Herzegovina 2,807 3 Brazil 22 185 616,133 5 Bulgaria 6,913 42 Chile 18,526 216,902 1,377 291 Costa Rica 8 8 0 965,320 129 Italy 7,706 4,114,911 458 1,318 Latvia 3,796 101 4 3 Lebanon 3,500 800 2,700 Mexico 9,058 12,166 Morocco 52,000 5,000 47,000 760 38,000 New Zealand 21,202 119,059 783 Philippines 21 1,224,738 188 Poland 4 58,156 687 627 Tajikistan 2,180,121 Ukraine 529 2,200,000 United States of America 302,377 3,631,582 2,596 6,470 Cannabis herb supply indicators
Region Seizures in 2011-2012 (percentage of global total) Annual seizures per capita in 2011-2012 (milligrams) Change in seizures from biennium 2009-2010 to biennium 2011-2012 (percentage) Nominal (unadjusted) price (weighted average in US dollars per gram) Purchasing power parity-adjusted retail price, 2011-2012, weighted average (international dollarsa per gram) Average change in price (percentage) Average change in inflation adjusted price (percentage) Assessment of availability for consumers Africa 8 0.9 -38 0.5 0.4 14 -7 High, stable North America 67 16.5 -21 14.1 13.8 -8 -12 High, stable Central and South America and the Caribbean 17 4.0 32 3.9 3.7 89 73 High Eastern Europe 1 0.3 -32 9.4 16.7 25 1 Low South-Eastern Europe 2 1.7 111 18 22.1 206 164 Moderate, increasing Western and Central Europe 2 0.6 112 11 11.5 22 16 Moderate, increasing Central Asia and Transcaucasia countries 17 4.0 32 17.3 18 268 205 Low East and South-East Asia 1 0.05 -40 28.3 9.1 35 29 Low, moderate decline South Asia 2 0.2 -36 0.1 0.2 -24 -37 Moderate Near and Middle-East/South-West Asia .. .. .. .. .. .. .. .. Oceania 0.1 0.2 50 24.4 17.7 9 4 Moderate, stable Notes: Two dots (..) indicate insufficient data. All averages are weighted by population.
a An international dollar would buy in the region concerned a comparable amount of goods and services a United States Dollar would buy in the United States.Cocaine
Global illicit cultivation of coca bush, 2002-2012 (Hectares)
2002 2003 2004 2005 2006 2007 2008 2009 2010 2011 2012 Bolivia
(Plurinational State of)21,600 23,600 27,700 25,400 27,500 28,900 30,500 30,900 31,000 27,200 25,300 Colombia a 102,000 86,000 80,000 86,000 78,000 99,000 81,000 73,000 62,000 64,000 48,000 Peru b 62,500 60,400 Peru c 46,700 44,200 50,300 48,200 51,400 53,700 56,100 59,900 61,200 64,400 Total 170,300 153,800 158,000 159,600 156,900 181,600 167,600 163,800 154,200 155,600 (d) 133,700 Sources: For Bolivia (Plurinational State of), 2002: CICAD and United States Department of State, International Narcotics Control Strategy Report; since 2003: national illicit crop monitoring system supported by UNODC. For Colombia and Peru: national illicit crop monitoring system supported by UNODC.
Note: An account of the different concepts for different areas and their effect on comparability was presented in the World Drug Report 2012 (pp. 41-42). In the continuing efforts to improve comparability of estimates between countries, the estimated net area under coca bush cultivation at the reference date of 31 December is presented for Peru in addition to the area under coca bush cultivation in Peru as seen on satellite imagery. The reference date of 31 December is also used for the estimated area under coca bush cultivation in Colombia. The estimates presented for the Plurinational State of Bolivia represent the area under coca bush cultivation as seen on satellite imagery.
a Net area on 31 December Estimates from 2009 were adjusted for small fields, while estimates for previous years did not require that adjustment.
b Net area on 31 December.
c Area as interpreted from satellite imagery.
d The global coca cultivation figure was calculated using the area as interpreted on satellite imagery for Peru.Potential production of sun-dried coca leaf, 2005-2012 (Tons)
2005 2006 2007 2008 2009 2010 2011 2012 Bolivia
(Plurinational state of)28,200 33.200 36,400 39,400 40,100 40,900 33,500 30,400 Range
34,200-38,300 37,300-41,800 37,900-42,300 38,600-43,100 31,900-35,400 28,900-31,900 Peru 97,000 105,100 107,800 113,300 119,000 120,500 126,100 119,700 Range
85,400-108,600 91,000-119,200 93,200-122,000 97,600-127,800 102,400-134,200 103,000-136,300 110,300-142,100 103,300 - 136,100 Sources: For Bolivia (Plurinational State of): potential sun-dried coca leaf production available for cocaine manufacture is estimated by the national illicit crop monitoring system supported by UNODC. Source of estimates for leaf yield is UNODC for Yungas de la Paz, and United States Drug Enforcement Administration (DEA) for Chapare (DEA scientific studies). The estimated amount of coca leaf produced on 12,000 ha in the Yungas of La Paz, where coca cultivation is authorized under national law, was deducted (ranges: upper and lower bounds of the 95 per cent confidence interval of the estimated coca leaf yield). For Peru: potential sun-dried coca leaf production available for cocaine manufacture is estimated by the national illicit crop monitoring system supported by UNODC. A total of 9,000 tons of sun-dried coca leaf production was deducted, which, according to Government sources, is the amount used for traditional purposes (range: upper and lower bounds of the 95 per cent confidence interval of the estimated coca leaf yield.
Note: The estimates for 2011 and 2012 are not directly comparable; for a discussion of the different concepts, see the World Drug Report 2012, pp 41-42.Potential production of fresh coca leaf, 2005-2012 (Tons)
2005 2006 2007 2008 2009 2010 2011 2012 Colombia 555,400 528,300 525,300 389,600 343,600 305,300 263,800 231,700 Range
305,300-349,600 179,200-284,200 Potential production of fresh coca leaf in oven-dried equivalent, 2005-2012 (Tons)
2005 2006 2007 2008 2009 2010 2011 2012 Colombia 164,280 154,130 154,000 116,900 103,100 91,600 79,100 69,500 Range 91,600-104,880 Sources: National Illicit Crop Monitoring System supported by UNODC.
Notes: Owing to the introduction of an adjustment factor for small fields, estimates since 2010 are not directly comparable with those of previous years. The ranges reflect the uncertainty associated with the estimates. For Bolivia (Plurinational State of) and Peru, the ranges are based on confidence intervals, and the best estimate is the midpoint between the upper and lower bounds of the range. In the case of Colombia, the range is estimated on the basis of the area under coca cultivation in the two previous years. The methodology used to calculate uncertainty ranges for production estimates is still under development, and figures may be revised when more information becomes available.Potential manufacture of 100% pure cocaine, 2005-2012 (Tons)
2005 2006 2007 2008 2009 2010 2011 2012 Bolivia
(Plurinational state of)80 94 104 113 n.a. n.a. n.a. n.a. Colombia 680 660 630 450 410 350 345 309 Range
350-400 240-377 Peru 260 280 290 302 n.a. n.a. n.a. n.a. Total 1,020 1,034 1,024 865 * * * * Sources: For Bolivia (Plurinational State of): Government calculations based on coca leaf yield surveys by UNODC (Yungas of La Paz) and United States DEA scientific studies (Chapare). For Colombia: national illicit crop monitoring system supported by UNODC and DEA scientific studies. Due to the introduction of an adjustment factor for small fields, estimates since 2010 are not directly comparable with those of previous years. For Peru: Government calculations, based on a coca leaf to cocaine conversion ratio from DEA scientific studies.
Notes: Owing to the ongoing review of conversion factors, no point estimate of the level of cocaine production could be provided since 2009. Because of uncertainty about the level of total potential cocaine manufacture and about the comparability of the estimates of the various countries, the figures were estimated as ranges (842-1,111 tons in 2009, 788-1,060 tons in 2010, 776-1,051 tons in 2011 and 714-973 tons in 2012). Detailed information on the ongoing revision of conversion ratios and cocaine laboratory efficiency is available in the World Drug Report 2010 (p. 249). Figures in italics are being reviewed. Information on estimation methodologies and definitions can be found in the section on methodology in the online version of this report.Reported cumulative eradication of coca bush (ha), 2005-2012)
2005 2006 2007 2008 2009 2010 2011 2012 Bolivia (Plurinational
State of)manual 6,073 5,070 6,269 5,484 6,341 8,200 10,460 11,044 Colombia manual 31,980 43,051 66,805 95,634 60,544 43,690 33,727 30,486 spraying 138,775 172,026 153,134 133,496 104,771 101,939 103,302 100,549 Peru manual 7,605 9,153 10,188 11,102 10,091 12,239 10,290 14,235 Ecuador manual 18 9 12 12 6 3 14 .. Venezuela (Bolivarian Republic of) manual 40 0 0 0 0 .. .. .. Source: UNODC annual report questionnaire and database on estimates and long-term trend analysis (DELTA); Government of Bolivia (Plurinational State of), Colombia and Peru.
Notes: Totals for Bolivia (Plurinational State of) since 2006 include voluntary and forced eradication. Totals for Peru include voluntary and forced eradication. Two dots (..) indicate that data are not availableCocaine supply indicators
Region Seizures in 2011-2012 (percentage of global total) Annual seizures per capita in 2011-2012 (milligrams) Change in seizures from biennium 2009-2010 to biennium 2011-2012 (percentage) Nominal (unadjusted) price, weighted average (United States dollars per gram) Purchasing power parity-adjusted retail price, 2011-2012, weighted average (international dollarsa per gram) Average change in price (percentage) Average change in inflation adjusted price (percentage) Assessment of availability for consumers Africa 0.47 2.9 22 83 145 .. .. .. Central and South America and the Caribbean 71.10 959.6 -7 10 15 19 9 High, moderate decline North America 17.55 244.4 -8 92 90 1 -4 High, stable Asia 0.21 0.3 4 167 237 20 10 Low Eastern Europe 0.03 1 6 188 375 8 -11 Low, moderate increase South-Eastern Europe 0.11 5.6 -30 112 164 48 29 Low, moderate decline Western and Central Europe 10.26 137.4 17 83 77 1 -4 High, slight increase Oceania 0.26 46.4 57 391 255 25 19 Medium Notes: Seizure data are based on aggregates of seized cocaine salts, "crack" cocaine, cocaine base, coca paste and unspecified cocaine. Due to the paucity of data, price data and seizure data are not adjusted for purity.
In order to preserve comparability between countries and over time, price data are based on records of cocaine salts only. All averages are weighted by population.
Two dots (..) indicate insufficient data.
a An international dollar would buy in the region concerned a comparable amount of goods and services a United States Dollar would buy in the United States.Opium/Heroin
Net cultivation of opium poppy in selected countries, 1999-2013 (Hectares)
1999 2000 2001 2002 2003 2004 2005 2006 2007 2008 2009 2010 2011 2012 2013 SOUTH-WEST ASIA Afghanistan 90,583 82,171 7,606 74,100 80,000 131,000 104,000 165,000 193,000 157,000 123,000 123,000 131,000 154,000 209,000 Pakistan 284 260 213 622 2,500 1,500 2,438 1,545 1,701 1,909 1,779 1,721 362 382 382 Subtotal 90,867 82,431 7,819 74,722 82,500 132,500 106,438 166,545 194,701 158,909 124,779 124,721 131,362 154,382 209,382 SOUTH-EAST ASIA Lao People's Democratic Republic a 22,543 19,052 17,255 14,000 12,000 6,600 1,800 2,500 1,500 1,600 1,900 3,000 4,100 6,800 3,900 Myanmar a 89,500 108,700 105,000 81,400 62,200 44,200 32,800 21,500 27,700 28,500 31,700 38,100 43,600 51,000 57,800 Thailand b 702 890 820 750 Viet Nam b 442 Subtotal 113,187 128,642 123,075 96,150 74,200 50,800 34,600 24,000 29,200 30,100 33,600 41,100 47,700 57,800 61,700 LATIN AMERICA Colombia 6,500 6,500 4,300 4,153 4,026 3,950 1,950 1,023 715 394 356 341 338 313 Mexico c 3,600 1,900 4,400 2,700 4,800 3,500 3,300 5,000 6,900 15,000 19,500 14,000 12,000 Subtotal 10,100 8,400 8,700 6,853 8,826 7,450 5,250 6,023 7,615 15,394 19,856 14,341 12,338 12,338 12,338 OTHER Other countries d 2,050 2,479 2500 2500 3,074 5,190 5,212 4,432 4,184 8,600 7,700 10,500 16,100 11,900 13,300 TOTAL 216,204 221,952 142,094 180,225 168,600 195,940 151,500 201,000 235,700 213,003 185,935 190,662 207,500 236,420 296,720 Source: For Afghanistan: 1998-2002: UNODC; 2003-2012: National Illicit Crop Monitoring System supported by UNODC. For Pakistan: annual report questionnaire, Government of Pakistan, United States Department of State. For the Lao People's Democratic Republic: 1998-1999: UNODC; 2000-2012: National Illicit Crop Monitoring System supported by UNODC. For Myanmar: 1998-2000: United States Department of State; 2001-2012: National Illicit Crop Monitoring System supported by UNODC. For Colombia: 1998-1999: various sources; From 2000: National Illicit Crop Monitoring System supported by UNODC. For 2008-2012, production was calculated based on regional yield figures and conversion ratios from the United States Department of State/DEA. For Mexico: estimates derived from United States Government surveys.
Note: Figures in italics are preliminary and may be revised when updated information becomes available. Information on estimation methodologies and definitions can be found in the methodology section of the online version of the present report.
a May include areas that were eradicated after the date of the area survey.
b Owing to continuing low cultivation, figures for Viet Nam (as of 2000) and Thailand (as of 2003) were included in the category "Other countries".
c The Government of Mexico does not validate the estimates provided by the United States, as they are not part of its official figures and it does not have information on the methodology used to calculate them. The Government of Mexico is in the process of implementing a monitoring system in collaboration with UNODC to estimate illicit cultivation and production.
d Eradication and plant seizure reports from different sources indicate that illicit opium poppy cultivation also exists in the following subregions: North Africa, Central Asia and Transcaucasia, Near and Middle East/South-West Asia, South Asia, East and South-East Asia, Eastern Europe, South-Eastern Europe, Central America and South America. Starting in 2008, a new methodology was introduced to estimate opium poppy cultivation and opium/ heroin production in those countries. The estimates are higher than the previous figures but have a similar order of magnitude. A detailed description of the estimation methodology is available in the online version of the present report.Global potential production of oven-dry opium in selected countries, 1999-2013 (Tons)
1999 2000 2001 2002 2003 2004 2005 2006 2007 2008 2009 2010 2011 2012 2013 SOUTH-WEST ASIA Afghanistan 4,565 3,276 185 3,400 3,600 4,200 4,100 5,300 7,400 5,900 4,000 3,600 5,800 3,700 5,500 Pakistan 9 8 5 5 52 40 36 39 43 48 44 43 9 9 Subtotal 4,574 3,284 190 3,405 3,652 4,240 4,136 5,339 7,443 5,948 4,044 3,643 5,809 3,709 5,500 SOUTH-EAST ASIA Lao People's
Democratic
Republic124 167 134 112 120 43 14 20 9 10 11 18 25 41 23 Myanmar 895 1,087 1,097 828 810 370 312 315 460 410 330 580 610 690 870 Thailand a 8 6 6 9 Viet Nam a 2 Subtotal 1,029 1,260 1,237 949 930 413 326 335 469 420 341 598 635 731 893 LATIN AMERICA Colombia 88 88 80 52 50 49 24 13 14 10 9 8 8 8 Mexico b 43 21 91 58 101 73 71 108 150 325 425 300 250 Subtotal 131 109 171 110 151 122 95 121 164 335 434 308 258 258 258 OTHER Other countries c 30 38 32 56 50 75 63 16 15 139 134 181 281 208 232 TOTAL 5,764 4,691 1,630 4,520 4,783 4,850 4,620 5,810 8,091 6,841 4,953 4,730 6,983 4,906 6,883 Source: For Afghanistan: 1998-2002: UNODC; 2003-2012: National Illicit Crop Monitoring System supported by UNODC. For Pakistan: annual report questionnaire, Government of Pakistan, United States Department of State. For the Lao People's Democratic Republic: 1998-1999: UNODC; 2000-2012: National Illicit Crop Monitoring System supported by UNODC. For Myanmar: 1998-2000: United States Department of State; 2001-2012: National Illicit Crop Monitoring System supported by UNODC. For Colombia: 1998-1999: various sources; From 2000: National Illicit Crop Monitoring System supported by UNODC. For 2008-2012, production was calculated based on regional yield figures and conversion ratios from the United States Department of State/DEA. For Mexico: estimates derived from United States Government surveys.
Note: Figures in italics are preliminary and may be revised when updated information becomes available. Information on estimation methodologies and definitions can be found in the methodology section of the online version of the present report. The opium production estimates for Afghanistan for 2006-2009 were revised after data quality checks revealed an overestimation of opium yield estimates in those years.
a Owing to continuing low cultivation, figures for Viet Nam (as of 2000) and Thailand (as of 2003) were included in the category "Other countries".
b The Government of Mexico does not validate the estimates provided by the United States, as they are not part of its official figures and it does not have information on the methodology used to calculate them. The Government of Mexico is in the process of implementing a monitoring system in collaboration with UNODC to estimate illicit cultivation and production.
c Eradication and plant seizure reports from different sources indicate that illicit opium poppy cultivation also exists in the following subregions: North Africa, Central Asia and Transcaucasia, Near and Middle East/South-West Asia, South Asia, East and South-East Asia, Eastern Europe, South-Eastern Europe, Central America and South America. Starting in 2008, a new methodology was introduced to estimate opium poppy cultivation and opium/ heroin production in those countries. The estimates are higher than the previous figures but have a similar order of magnitude. A detailed description of the estimation methodology is available in the online version of the present report.Global potential production of opium and manufacture of heroin of unknown purity, 2004-2013 (Tons)
2004 2005 2006 2007 2008 2009 2010 2011 2012 2013 Total potential opium production 4,850 4,620 5,810 8,091 6,841 4,953 4,730 6,983 4,906 6,883 Potential opium not processed into heroin 1,197 1,169 1,786 3,078 2,360 1,680 1,728 3,400 1,850 2,600 Potential opium processed into heroin 3,653 3,451 4,024 5,012 4,481 3,273 3,002 3,583 3,056 4,283 Total potential heroin manufacture 529 472 553 686 600 427 383 476 385 560 Notes: Only for Afghanistan, the proportion of potential opium production which is not converted into heroin within the country could be estimated. For all other countries, for the purpose of this table, it is assumed that all opium potentially produced is converted into heroin. If the total potential opium production in Afghanistan in 2012 were converted into heroin, the total potential heroin production in Afghanistan would be 786 tons and global production would be total 923 tons. The estimates for 2006 - 2009 were revised due to the revision of opium production figures for Afghanistan.
Figures in italics are preliminary and may be revised when updated information becomes available.Reported opium poppy eradication in selected countries, 2003 to 2013 (Hectares)
2003 2004 2005 2006 2007 2008 2009 2010 2011 2012 2013 Afghanistan 21,430 a 5,103 15,300 19,047 5,480 5,351 2,316 3,810 9,672 7,348 Bangladesh 8 22 Colombia 3,266 3,866 2,121 1,929 375 381 546 711 299 319 Egypt 34 65 45 50 98 121 89 222 1 Guatemala 489 720 449 536 1,345 918 1,490 590 India 494 167 12 247 8,000 624 2,420 3,052 5,746 Lao People's Democratic Republic 4,134 3,556 2,575 1,518 779 575 651 579 662 707 397 Lebanon 4 67 27 8 21 4 Mexico 20,034 15,926 21,609 16,890 11,046 13,095 14,753 15,491 16,389 15,726 Myanmar 638 2,820 3,907 3,970 3,598 4,820 4,087 8,268 7,058 23,718 12,288 Nepal 19 4 1 21 35 Pakistan 4,185 5,200 391 354 614 0 105 68 1,053 592 Peru 57 98 92 88 28 23 32 21 Thailand 767 122 110 153 220 285 201 278 208 205 264 Ukraine 28 436 Venezuela (Bolivarian Republic of) 0 87 154 0 0 0 Viet Nam 100 32 38 99 31 38 35 Sources: UNODC annual reports questionnaire, Government reports, reports of regional bodies, and the United States International Narcotics Control Strategy Report
Notes: In this table, only eradication reported in terms of area is considered. Eradication reported in terms of number of plant seizures can be found in the annex on seizures of the electronic version of the World Drug Report located at https://www.unodc.org/wdr/
a Although eradication took place in 2004, it was not officially reported to UNODC.Heroin supply indicators
Region Seizures in 2011-2012 (percentage of global total) Annual seizures per capita in 2011-2012 (milligrams) Change in seizuresfrom biennium 2009-2010 to biennium 2011-2012 (percentage) Nominal (unadjusted) price
(weighted average in US dollars per gram)Purchasing power parity-adjusted retail price, 2011-2012, weighted average(international dollarsa per gram) Average
change in price (percentage)Average change in inflation adjusted price (percentage) Assessment of availability for consumers Africa 1 0.01 15 .. .. .. .. .. North America 8 0.2 38 272 265.2 -3 -7 Low, increasing Central and South America and the Caribbean 1 0.04 -52 .. .. .. .. .. Central Asia and Transcaucasian countries 2 0.4 -43 90 184 23 2 Moderate East and South-East Asia 12 0.1 27 125.3 158.8 39 27 High, stable Near and Middle East/South-West Asia 49 1.7 8 25.6 51.8 243 169 High, stable South Asia 1 0.01 -20 11.6 23.2 94 73 Moderate, decreasing Eastern Europe 3 0.2 -28 97.8 198.5 -15 -29 Moderate South-Eastern Europe 14 1.7 -31 45.8 70 60 39 High, decreasing Western and Central Europe 7 0.2 -18 68.9 63.7 -1 -6 Moderate, decreasing Oceania 1 0.5 140 423.4 284.7 -20 -24 Moderate, slight increase Notes: All averages are weighted by population. Due to the paucity of data, price data and seizure data are not adjusted for purity. Two dots (..) indicate insufficient data.
a An international dollar would buy in the region concerned a comparable amount of goods and services a United States Dollar would buy in the United States.Annual prevalence of the use of cannabis, opioids and opiates, by region
Region or subregion Cannabis Opioids Opiates Number
(thousands)Prevalence
(percentage)Number
(thousands)Prevalence
(percentage)Number
(thousands)Prevalence
(percentage)Best estimate Lower Upper Best estimate Lower Upper Best estimate Lower Upper Best estimate Lower Upper Best estimate Lower Upper Best estimate Lower Upper Africa 44,560 19,860 57,530 7.5 3.3 9.7 1,930 900 3,140 0.3 0.2 0.5 1,840 920 2,290 0.3 0.2 0.4 East Africa 6,210 2,070 10,580 4.1 1.4 7.1 250 90 1,100 0.2 0.1 0.7 220 160 310 0.1 0.1 0.2 North Africa 5,610 2,850 8,670 4.3 2.2 6.6 320 130 520 0.2 0.1 0.4 320 130 520 0.2 0.1 0.4 Southern Africa 4,230 2,950 7,700 5.0 3.5 9.1 340 230 360 0.4 0.3 0.4 290 200 310 0.3 0.2 0.4 West and Central Africa 28,510 11,990 30,570 12.4 5.2 13.3 1,020 440 1,150 0.4 0.2 0.5 1,000 430 1,140 0.4 0.2 0.5 Americas 51,820 51,090 53,300 8.1 8.0 8.4 14,440 14,210 14,710 2.3 2.2 2.3 1,620 1,430 1,800 0.3 0.2 0.3 Caribbean 690 320 1,810 2.5 1.2 6.6 100 60 190 0.4 0.2 0.7 80 50 160 0.3 0.2 0.6 Central America 680 660 720 2.6 2.5 2.7 40 40 50 0.2 0.1 0.2 20 20 20 0.1 0.1 0.1 North America 35,230 35,040 35,430 11.2 11.2 11.3 13,460 13,320 13,600 4.3 4.2 4.3 1,420 1,280 1,490 0.5 0.4 0.5 South America 15,200 15,080 15,340 5.7 5.6 5.7 830 800 870 0.3 0.3 0.3 110 90 120 0.04 0.03 0.05 Asia 54,610 28,900 88,100 1.9 1.0 3.1 11,920 9,040 15,380 0.4 0.3 0.5 9,860 7,480 12,990 0.3 0.3 0.5 Central Asia and Transcaucasia 1,870 1,310 2,220 3.5 2.4 4.1 470 460 490 0.9 0.9 0.9 440 420 450 0.8 0.8 0.8 East and South-East Asia 10,140 5,910 23,440 0.6 0.4 1.5 3,370 2,530 4,740 0.2 0.2 0.3 3,340 2,500 4,700 0.2 0.2 0.3 Near and Middle East/South West Asia 9,390 5,450 13,200 3.4 2.0 4.8 5,190 3,880 6,540 1.9 1.4 2.4 3,320 2,410 4,440 1.2 0.9 1.6 South Asia 33,210 16,230 49,240 3.5 1.7 5.2 2,890 2,170 3,610 0.3 0.2 0.4 2,770 2,150 3,400 0.3 0.4 0.4 Europ 24,000 23,220 24,800 4.3 4.2 4.5 4,010 3,930 4,100 0.7 0.7 0.7 3,000 2,920 3,090 0.5 0.5 0.6 Eastern and South-Eastern Europe 5,470 4,750 6,210 2.4 2.1 2.7 2,800 2,790 2,810 1.2 1.2 1.2 1,890 1,880 1,890 0.8 0.8 0.8 Western and Central Europe 18,530 18,460 18,590 5.7 5.7 5.7 1,210 1,140 1,290 0.4 0.4 0.4 1,120 1,050 1,200 0.3 0.3 0.4 Oceania 2,650 2,220 3,540 10.8 9.1 14.5 740 560 830 3.0 2.3 3.4 40 40 60 0.2 0.2 0.5 Global estimate 177,600 125,300 227,300 3.8 2.7 4.9 33,000 28,600 38,200 0.7 0.6 0.8 16,400 12,800 20,200 0.4 0.3 0.4 Source: UNODC estimates based on annual report questionnaire data and other official sources.
Annual prevalence of the use of cocaine, amphetamines and "ecstasy", by region
Region or subregion Cocaine ATS (excluding "ecstasy") "Ecstasy" Number
(thousands)Prevalence
(percentage)Number
(thousands)Prevalence
(percentage)Number
(thousands)Prevalence
(percentage)Best estimate Lower Upper Best estimate Lower Upper Best estimate Lower Upper Best estimate Lower Upper Best estimate Lower Upper Best estimate Lower Upper Africa 2,590 800 4,680 0.4 0.1 0.8 5,200 1,360 8,950 0.9 0.2 1.5 1,080 350 1,880 0.2 0.1 0.3 East Africa - - - - - - - - - - - - - - - - - - North Africa 30 30 40 0.02 0.02 0.03 740 260 1,220 0.6 0.2 0.9 - - - - - - Southern Africa 640 160 730 0.8 0.2 0.9 610 300 830 0.7 0.4 1.0 250 140 310 0.3 0.2 0.4 West and Central Africa 1,600 540 2,430 0.7 0.2 1.1 - - - - - - - - - - - - Americas 9,260 8,970 9,580 1.5 1.4 1.5 6,370 5,250 7,600 1.0 0.8 1.2 3,210 2,960 3,530 0.5 0.5 0.6 Caribbean 180 60 330 0.6 0.2 1.2 210 20 520 0.8 0.1 1.9 50 10 160 0.2 0.04 0.6 Central America 160 160 170 0.6 0.6 0.6 340 340 340 1.3 1.3 1.3 30 20 40 0.1 0.1 0.1 North America 5,580 5,460 5,690 1.8 1.7 1.8 4,410 3,710 5,100 1.4 1.2 1.6 2,770 2,740 2,800 0.9 0.9 0.9 South America 3,340 3,300 3,390 1.2 1.2 1.3 1,410 1,170 1,640 0.5 0.4 0.6 370 190 550 0.1 0.1 0.2 Asia 1,330 430 2,230 0.05 0.02 0.08 19,520 4,530 34,520 0.7 0.2 1.2 10,750 2,650 18,850 0.4 0.1 0.7 Central Asia and Transcaucasia - - - - - - - - - - - - - - - - - - East and South-East Asia 480 370 1,100 0.03 0.02 0.07 8,980 3,440 20,400 0.6 0.2 1.3 3,180 1,630 6,630 0.2 0.1 0.4 Near and Middle East/South West Asia 90 50 140 0.03 0.02 0.05 440 370 820 0.2 0.1 0.3 - - - - - - South Asia - - - - - - - - - - - - - - - - - - Europe 3,670 3,400 3,970 0.7 0.6 0.7 2,800 2,400 3,220 0.5 0.4 0.6 3,000 2,740 3,260 0.5 0.5 0.6 South and South-Eastern Europe 540 290 810 0.2 0.1 0.4 850 470 1,230 0.4 0.2 0.5 1,340 1,100 1,580 0.6 0.5 0.7 Western and Central Europe 3,140 3,110 3,160 1.0 1.0 1.0 1,950 1,920 1,980 0.6 0.6 0.6 1,650 1,630 1,680 0.5 0.5 0.5 Oceania 380 380 460 1.5 1.5 1.9 510 410 530 2.1 1.7 2.2 720 700 720 2.9 2.9 2.9 Global estimate 17,200 14,000 20,900 0.4 0.3 0.4 34,400 13,900 54,800 0.7 0.3 1.2 18,800 9,400 28,200 0.4 0.2 0.6 Source: UNODC estimates based on annual report questionnaire data and other official sources.
Prevalence of drug use among persons held in prisons
Region Subregion Country Year of estimate Annual prevalence of any illicit drug use Number of persons held in prisons Three main drugs America North America Canada 2011 56.72 14,141 Cannabis
Cocaine salts
OpiodsSouth America Argentina 2009 64.4 55,000 Ecuador 2007 33.9 15,736 Cannabis
Cocaine
TranquilizersAsia Central Asia and Transcaucasia Armenia 2012 .. ... Cannabis
Opioids
Pharmaceutical opioidsKyrgyzstan 2010 15 7,000 East and South-East Asia Indonesia 2010 17.04 133,252 China, Macao SAR 2012 25.6 488 Ketamine
Cannabis
MethamphetamineMalaysia 2011 39 12,214 Heroin/morphine
"Syabu"
"Ganja"Myanmar 2011 30 1,544 Amphetamines
Cannabis
OpiatesNear and Middle East/South-West Asia Israel 2012 51.8 10,480 Lebanon 2012 .. 2,249 Cannabis
Cocaine
HeroinEurope Eastern Europe Belarus 2011 .. 1,200 Opium
Cannabis
TranquillizersRussian Federation 2012 14.8 701,517 Cannabis
Cocaine
OpioidsSoutheast Europe Bulgaria 2011 21.6 9,000 Heroin
Cannabis
AmphetaminesCroatia 2010 17.3 .. Romania 2011 2 29,284 Opioids
Cannabis
"Ecstasy"Western and Central Europe Belgium 2010 .. .. Amphetamine
Cannabis
Cocaine saltsCzech Republic 2012 37.7 20,000 Cannabis
"Ecstasy"-type substances MethamphetamineDenmark 2010 8 3,969 France 2003 .. 61,640 Cannabis
Cocaine
OpioidsGermany 2011 33 70,041 Cannabinoids Opioids
AmphetaminesHungary 2008 8.4 16,328 Cannabis
"Ecstasy" AmphetaminesItaly 2012 23.84 65,701 Latvia 2011 17.7 4,588 Amphetamine Cannabis
Sedatives and tranquillizersLithuania 2012 14.61 9,734 ATS
OpioidsNetherlands 2007 57 13,260 Cannabis
Cocaine
HeroinPoland 2007 .. 84,156 Amphetamine
Cannabis
"Ecstasy"-type substancesSlovakia 2012 17.24 10,850 Heroin
Cannabis
MethamphetamineSlovenia 2011 21.6 4,975 Spain 2011 .. 70,472 Cannabis
Cocaine salts
HeroinSweden 2011 42 6,250 Oceania Oceania Australia 2012 70 29,383 Cannabis
Methamphetamine Pharmaceutical opioidsNew Zealand 2011 5.5 8,600 ATS
Cannabis
OpioidsSource: UNODC annual report questionnaire.
Note: Two dots (..) indicate that data are not available.Morbidity among persons held in prisons
Region Subregion Country Year of estimate Hepatitis B Hepatitis C HIV Infection Prevalence Number Prevalence Number Prevalence Number America North America Canadaa 2008 .. .. 30.2 3,907 1.72 222 United States of Americab 2010 .. .. .. .. 1.46 .. South America Uruguay 2004 8.5 5.5 Asia Central Asia and Transcaucasia Kazakhstan 2012 .. .. .. .. 2.2 .. Kyrgyzstan 2010 10 .. 10 .. 15 .. Tajikistan 2011 .. 3,000 .. 3,000 East and South-East Asia China, Hong Kong SAR 2012 .. .. .. .. 0.7 .. Indonesia 2011 .. .. .. .. 3.63 .. Indonesia 2010 .. .. 0.84 .. .. 5,106 Malaysia 2011 0.18 66 1.23 445 3.04 1,102 Europe Eastern Europe Republic of Moldova 2011 226 Western and Central Europe Belgium 2011 5.8 .. 22.4 .. 4.8 .. Czech Republic 2009 16.2 .. 41.6 .. 2.4 .. Finland 2010 .. .. 84 1,600 2 40 France 2012 .. .. 4.8 3,000 2 1,220 Germany 2011 .. .. 14.3 .. 1.2 .. Hungary 2012 1.25 35 7.01 194 0.13 3 Latvia 2012 .. .. .. .. 6 450 Lithuania 2011 .. .. .. .. 4.1 396 Luxembourg 2007 9 72 52.6 417 5.2 41 Slovakia 2012 3.82 41 36.84 395 0.47 5 Source: UNODC annual report questionnaire unless otherwise stated.
a Source: Public Health Agency of Canada
b Source: United States Department of Justice
Note: Two dots (..) indicate that data are not available.
Regional groupings
This report uses a number of regional and subregional designations. These are not official designations. They are defined as follows:
- East Africa: Burundi, Comoros, Djibouti, Eritrea, Ethiopia, Kenya, Madagascar, Mauritius, Rwanda, Seychelles, Somalia, Uganda and United Republic of Tanzania.
- North Africa: Algeria, Egypt, Libya, Morocco, South Sudan, Sudan and Tunisia.
- Southern Africa: Angola, Botswana, Lesotho, Malawi, Mozambique, Namibia, South Africa, Swaziland, Zambia and Zimbabwe.
- West and Central Africa: Benin, Burkina Faso, Cameroon, Cabo Verde, Central African Republic, Chad, Congo, Cote d'Ivoire, Democratic Republic of the Congo, Equatorial Guinea, Gabon, Gambia, Ghana, Guinea, Guinea-Bissau, Liberia, Mali, Mauritania, Niger, Nigeria, Sao Tome and Principe, Senegal, Sierra Leone and Togo.
- Caribbean: Antigua and Barbuda, Bahamas, Barbados, Bermuda, Cuba, Dominica, Dominican Republic, Grenada, Haiti, Jamaica, Saint Kitts and Nevis, Saint Lucia, Saint Vincent and the Grenadines and Trinidad and Tobago.
- Central America: Belize, Costa Rica, El Salvador, Guatemala, Honduras, Nicaragua and Panama.
- North America: Canada, Mexico and United States of America.
- South America: Argentina, Bolivia (Plurinational State of), Brazil, Chile, Colombia, Ecuador, Guyana, Paraguay, Peru, Suriname, Uruguay and Venezuela (Bolivar-ian Republic of).
- Central Asia and Transcaucasia: Armenia, Azerbaijan, Georgia, Kazakhstan, Kyrgyzstan, Tajikistan, Turkmenistan and Uzbekistan.
- East and South-East Asia: Brunei Darussalam, Cambodia, China, Democratic People's Republic of Korea, Indonesia, Japan, Lao People's Democratic Republic, Malaysia, Mongolia, Myanmar, Philippines, Republic of Korea, Singapore, Thailand, Timor-Leste and Viet Nam.
- Near and Middle East/South-West Asia: Afghanistan, Bahrain, Iran (Islamic Republic of), Iraq, Israel, Jordan, Kuwait, Lebanon, Oman, Pakistan, Qatar, Saudi Arabia, Syrian Arab Republic, United Arab Emirates and Yemen. The Near and Middle East refers to a sub-region that includes Bahrain, Israel, Jordan, Kuwait, Lebanon, Oman, Qatar, Saudi Arabia, the Syrian Arab Republic, the United Arab Emirates and Yemen.
- South Asia: Bangladesh, Bhutan, India, Maldives, Nepal and Sri Lanka.
- Eastern Europe: Belarus, Republic of Moldova, Russian Federation and Ukraine.
- South-Eastern Europe: Albania, Bosnia and Herzegovina, Bulgaria, Croatia, Montenegro, Romania, Serbia, the former Yugoslav Republic of Macedonia and Turkey.
- Western and Central Europe: Andorra, Austria, Belgium, Cyprus, Czech Republic, Denmark, Estonia, Finland, France, Germany, Greece, Hungary, Iceland, Ireland, Italy, Latvia, Liechtenstein, Lithuania, Luxembourg, Malta, Monaco, Netherlands, Norway, Poland, Portugal, San Marino, Slovakia, Slovenia, Spain, Sweden, Switzerland and United Kingdom of Great Britain and Northern Ireland.
- Oceania: Australia, Fiji, Kiribati, Marshall Islands, Micronesia (Federated States of), Nauru, New Zealand, Palau, Papua New Guinea, Samoa, Solomon Islands, Tonga, Tuvalu, Vanuatu and small island territories.
- amphetamine-type stimulants -- a group of substances composed of synthetic stimulants that were placed under international control in the Convention on Psychotropic Substances of 1971 and are from the group of substances called amphetamines, which includes amphetamine, methamphetamine, methcathinone and the "ecstasy"-group substances (3,4-methylenedioxymethamphetamine (MDMA) and its analogues)
- annual prevalence -- the total number of people of a given age range who have used a given drug at least once in the past year divided by the number of people of the given age range
- coca paste (or coca base) -- an extract of the leaves of the coca bush. Purification of coca paste yields cocaine (base and hydrochloride)
- crack cocaine -- cocaine base obtained from cocaine hydrochloride through conversion processes to make it suitable for smoking
- new psychoactive substances -- substances of abuse, either in a pure form or a preparation, that are not controlled under the Single Convention on Narcotic Drugs of 1961 or the 1971 Convention, but which may pose a public health threat. In this context, the term "new" does not necessarily refer to new inventions but to substances that have become available in recent years
- opioids -- a generic term applied to alkaloids from opium poppy, their synthetic analogues and compounds synthesized in the body
- opiates -- a subset of opioids comprising the various products derived from the opium poppy plant, including opium, morphine and heroin
- poppy straw -- all parts (except the seeds) of the opium poppy, after mowing
- problem drug users -- people who engage in the high-risk consumption of drugs, for example people who inject drugs, people who use drugs on a daily basis and/or people diagnosed with drug use disorders or as drug-dependent based on clinical criteria contained in the International Classification of Diseases (tenth revision) of the World Health Organization and the Diagnostic and Statistical Manual of Mental Disorders (fourth edition) of the American Psychiatric Association, or any similar criteria or definition that may be used
Notes:
1. There is no standard definition of problem drug use. The definition may differ from country to countryand may include people who engage in the high-risk consumption of drugs, for example people who inject drugs, people who use drugs on a daily basis and/or people diagnosed with drug use disorders or as drug-dependent based on clinical criteria contained in the International Classification of Diseases (tenth revision) of the World Health Organization and the Diagnostic and Statistical Manual of Mental Disorders (fourth edition) of the American Psychiatric Association, or any similar criteria or definition that may be used. [Back]
2. These estimates reflect the most recent data available from different sources, including integrated biological and behavioural surveillance surveys, the improved coverage and quality of surveillance within countries and the increase in the number of countries reporting. Therefore, these estimates should be understood as an update of previous global estimates and not be used as a comparison for the purposes of trend analysis. [Back]
3. WHO, UNODC, UNAIDS Technical Guide for Countries to Set Targets for Universal Access to HIV Prevention, Treatment and Care for Injecting Drug Users: 2012 Revision (Geneva, World Health Organization, 2012). [Back]
4. This is based on the prevalence rates of any drug use among males and females reported to the United Nations Office on Drugs and Crime (UNODC) by Member States through the annual report questionnaire. [Back]
5. There is no standard definition of problem drug use. The definition differs from country to country and may include people who engage in the high-risk consumption of drugs, for example, people who inject drugs, people who use drugs on a daily basis and/or people diagnosed with drug use disorders or as drug-dependent based on clinical criteria contained in the international Classification of Diseases (10th revision) of the World Health Organization and the Diagnostic and Statistical Manual of Mental Disorders (4th ed.) of the American Psychiatric Association, or any similar criteria or definition that may be used. [Back]
6. The definition of drug-related deaths varies among Member States but includes all or some of the following: fatal drug overdoses, deaths due to HiV acquired through injecting drug use, suicide, and unintentional deaths and trauma, due to drug use. [Back]
7. Because of the very limited reporting of data from countries in Africa, an alternative source is used: Louisa Degenhardt and others, "illicit drug use", in Comparative Quantification of Health Risks: Global and Regional Burden of Disease Attributable to Selected Major Risk Factors, vol. 1, M. Ezzati and others, eds. (Geneva, World Health Organization, 2004). [Back]
8. Discussion paper UNODC/WHO 2013, "Opioid overdose: preventing and reducing opioid overdose mortality", United Nations, June 2013. [Back]
10. Centers for Disease Control and Prevention, "Community-based opioid overdose prevention programs providing naloxone: United States, 2010", Morbidity and Mortality Weekly Report, vol. 61, No. 6 (17 February 2012), pp. 101-105. [Back]
11. Discussion paper UNODC/WHO 2013, "Opioid overdose: preventing and reducing opioid overdose mortality" (United Nations, June 2013). [Back]
12. B. Sergeev and others, "Prevalence and circumstances of opiate overdose among injection drug users in the Russian Federation", as cited in P. Coffin, S. Sherman and M. Curtis, "Underestimated and overlooked: a global review of drug overdose and overdose prevention", in Global State of Harm Reduction 2010: Key Issues for Broadening the Response, C. Cook, ed. (London, International Harm Reduction Association, 2010); K. E. Tobin and C. A. Latkin, "The relationship between depressive symptoms and nonfatal overdose among a sample of drug users in Baltimore, Maryland", Journal of Urban Health, vol. 80, No. 2 (2003), pp. 220-229; P. O. Coffin and others, "Identifying injection drug users at risk of nonfatal overdose", Academic Emergency Medicine, vol. 14, No. 7 (July 2007), pp. 616-623; S. Darke, J. Ross and W. Hall, "Overdose among heroin users in Sydney, Australia: I. Prevalence and correlates of non-fatal overdose", Addiction, vol. 91, No. 3 (1996), pp. 405-411; B. Powis and others, "Self-reported overdose among injecting drug users in London: extent and nature of the problem", Addiction, vol. 94, No. 4 (1999), pp. 471-478. [Back]
13. EMCDDA, Annual Report 2010 (Lisbon, 2010). [Back]
14. M. Warner-Smith, S. Darke and C. Day, "Morbidity associated with non-fatal heroin overdose", Addiction, vol. 97, No. 8 (2002), pp. 963-967. [Back]
15. UNAIDS, Global Report: UNAIDS Report on the Global AIDS Epidemic 2013 (Geneva, 2013). [Back]
16. L. Degenhardt and others, "Global burden of disease attributable to illicit drug use and dependence: findings from the Global Burden of Disease Study 2010", The Lancet, vol. 382, No. 9904 (29 August 2013), pp. 1564-1574. [Back]
17. E. de Buhr, "Assessment of integrated biological and behavioural surveys (IBBS) for key populations", draft report dated 28 October 2013. [Back]
18. Including all former members of the Reference Group to the United Nations on HIV and Injecting Drug Use. [Back]
19. UNAIDS, Global Report: UNAIDS Report on the Global AIDS Epidemic 2012 (Geneva, 2012). [Back]
20. Political Declaration on HIV and AIDS: Intensifying Our Efforts to Eliminate HIV and AIDS (General Assembly resolution 65/277, annex). [Back]
21. Countries of Western and Central Europe and Eastern and South-Eastern Europe. [Back]
22. For the list of countries of the European region as defined by WHO for the purposes of its work, see www.euro.who.int/en/countries. [Back]
23. European Centre for Disease Prevention and Control/WHO Regional Office for Europe. HIV/AIDS surveillance in Europe 2012. [Back]
24. L. Wiessing and others, "Trends in HIV and hepatitis C virus infections among injecting drug users in Europe, 2005 to 2010", Eurosurveillance, vol. 16, No. 48 (2011). [Back]
25. EMCDDA, "HIV outbreak among injecting drug users in Greece" (Lisbon, November 2012). [Back]
26. EMCDDA, "HIV/AIDS among injecting drug users in Romania: report of a recent outbreak and initial response policies" (Lisbon, 2012). [Back]
27. EMCDDA and European Centre for Disease Prevention and Control, "Joint EMCDDA and ECDC rapid risk assessment. HIV in injecting drug users in the EU/EEA, following a reported increase of cases in Greece and Romania" (Lisbon, January 2012). [Back]
28. The initial peak in reported HIV incidence in Central Asia in the early 2000s is also in part related to the increase or initiation of HIV testing among people who inject drugs. [Back]
29. Claire Thorne and others, "Central Asia: hotspot in the worldwide HIV epidemic", Lancet Infectious Diseases, vol. 10, No. 7 (July 2010), pp. 479-488. [Back]
30. R. N. Samo and others, "High HIV incidence among persons who inject drugs in Pakistan: greater risk with needle sharing and injecting frequently among the homeless", PLOS ONE (16 December 2013). [Back]
31. P. Vickerman, M. Hickman and A. Judd, "Modelling the impact on hepatitis C transmission of reducing syringe sharing: London case study", International Journal of Epidemiology, vol. 36, No. 2 (2007), pp. 396-405. [Back]
32. A. J. Sutton and others, "Modelling the force of infection for hepatitis B, hepatitis C, and HIV in injecting drug users in England and Wales", BMC Infectious Diseases (2006). [Back]
33. WHO, UNODC, UNAIDS Technical Guide for Countries to Set Targets for Universal Access to HIV Prevention, Treatment and Care for Injecting Drug Users: 2012 Revision (Geneva, WHO, 2012). [Back]
35. Belarus, Canada, Georgia, Indonesia, Kazakhstan, Latvia, Malaysia, Myanmar, Pakistan, Republic of Moldova, Russian Federation, Spain, Tajikistan, Thailand, Ukraine and United States. Other countries which have higher prevalence rates may not be included in this list due to lack of reporting of service provision data. [Back]
36. Roy Walmsley, "World Prison Population List" 10th ed. (London, International Centre for Prison Studies). [Back]
37. The World Prison Population List (10th ed.) indicates that the median prison population rate per 100,000 for West African countries is 46; Southern African countries: 205; North American countries: United States: 716, Canada: 118; South American countries: 202; Caribbean countries: 376; South/Central Asian countries (mainly the Indian subcontinent): 62, East Asian countries: 160; Western European countries: 98; countries spanning Europe and Asia (e.g., Russian Federation and Turkey): 225; and Oceania: 151. [Back]
38. EMCDDA, Statistical Bulletin 2013. Tables DUP-3 and DUP-4. [Back]
39. WHO, UNODC and UNAIDS, Effectiveness of Interventions to Address HIV in Prisons, Evidence for Action Technical Papers (Geneva, WHO, 2007). [Back]
41. K. Dolan and others, "HIV in prison in low-income and middle-income countries, The Lancet Infectious Diseases, vol.7; No. 1 (2007), pp. 32-41. [Back]
42. UNODC/UNAIDS, "Women and HIV in prison settings". [Back]
43. For details see annex on drug use in prisons. [Back]
44. National inquiry on the prevalence of psychoactive substance abuse among the general population, conducted by the Ministry of Justice of Cabo Verde, published in April 2013, in collaboration with UNODC. [Back]
45. UNODC, annual report questionnaire replies submitted by Nigeria for 2012. [Back]
46. Federal Neuropsychiatry Hospital, Aro, Substance Abuse in Perspective in Nigeria 2009: National Survey on Alcohol and Drug Use in Nigeria 2012, Nigeria. [Back]
47. UNODC, annual report questionnaire replies submitted by South Africa for 2012. [Back]
48. Siphokazi Dada and others, "Alcohol and drug abuse trends", update, June 2013 (Cape Town, South Africa, South African Community Epidemiology Network on Drug Use, 2013). [Back]
49. United States, Department of Health and Human Services, Substance Abuse and Mental Health Services Administration, Center for Behavioral Health Statistics and Quality, TheNSDUH Report: Trends in Adolescent Substance Use and Perception of Risk from Substance Use (Rockville, Maryland, 2013). [Back]
50. United States, Department of Health and Human Services, Substance Abuse and Mental Health Services Administration, Results from the 2012 National Survey on Drug Use and Health: Detailed Tables (Rockville, Maryland, 2013), table 7.2B. [Back]
51. Ibid., Summary of National Findings, NSDUH Series H-46, HHS Publication No. SMA 13-4795 (Rockville, Maryland, 2013). [Back]
52. Ibid., Detailed Tables, tables 7.5B and 7.6B. [Back]
53. The category "opiates other than heroin" includes non-prescription methadone, buprenorphine, codeine, hydrocodone, hydromorphone, meperidine, morphine, opium, oxycodone, pentazocine, propoxy-phene, tramadol and any other drug with morphine-like effects. [Back]
54. United States, Department of Health and Human Services, Substance Abuse and Mental Health Services Administration, Center for Behavioral Health Statistics and Quality, Treatment Episode Data Set (TEDS): 2001-2011. National Admissions to Substance Abuse Treatment Services, BHSIS Series S-65, HHS Publication No. SMA 13-4772 (Rockville, Maryland, 2013). [Back]
55. Centers for Disease Control and Prevention, "Prescription painkiller overdoses: a growing epidemic, especially among women", 3 July 2013. [Back]
56. United States, Department of Health and Human Services, Substance Abuse and Mental Health Services Administration, Drug Abuse Warning Network, 2011: National Estimates of Drug-Related Emergency Department Visits, DAWN Series D-39, HHS Publication No. SMA 13-4760 (Rockville, Maryland, 2013). [Back]
57. Health Canada, Canadian Alcohol and Drug Use Monitoring Survey: summary of results for 2012; available from www.hc-sc.gc.ca. [Back]
58. Comunidad Andina, II Estudio Epidemiológico Andino sobre Consumo de Drogas en la Población Universitaria, Informe Regional 2012 (Lima, 2013). [Back]
59. The Colombian forensic experts of the Attorney General's Office analysed samples of substances sold as LSD, following a reported increase in its use and unusual health effects reported by users. The results from samples obtained in three major cities of Colombia revealed that substances sold as LSD did not contain such substance but rather the synthetic phenethylamines 25B-NBOMe and 25C-NBOMe (reported in UNODC, Global SMART Update 2013, vol. 10, September 2013). [Back]
60. UNODC, Global SMART Update 2013, Patterns and Trends of Amphetamine-Type Stimulants and Other Drugs: Challenges for Asia and the Pacific (Vienna, November 2013). [Back]
63. China, National Narcotics Control Commission, Annual Report on Drug Control in China 2013 (Beijing, 2013). [Back]
64. UNODC, annual report questionnaire replies submitted by China for 2012. [Back]
65. China National Centre for AIDS/STD Control and Prevention, 2012. [Back]
66. EMCDDA, European Drug Report: Trends and Developments 2013. [Back]
67. Use of cannabis in Italy was reported as 14.6 per cent in 2009 and 4 per cent in 2011, while in Poland cannabis use was reported as 9.6 per cent in 2010 and 3.8 per cent in 2012. [Back]
68. EMCDDA, European Drug Report: Trends and Developments 2013. [Back]
73. UNODC, annual report questionnaire, replies submitted by Belarus and Ukraine for 2012. [Back]
74. UNODC, annual report questionnaire, replies submitted by the Russian Federation for 2012. [Back]
76. UNODC, annual report questionnaire, replies submitted by Australia for 2012. [Back]
77. UNODC, annual report questionnaire, replies submitted by New Zealand. [Back]
78. WHO, "Summary: Health, health systems and economic crisis in Europe, impact and policy implications" (Geneva, 2013). [Back]
79. Alexander Kentikelenis and others, "Health effects of financial crisis: omens of a Greek tragedy", The Lancet, vol. 378, No. 9801 (October 2011), pp. 1457-1458. [Back]
80. Shu-Sen Chang and others, "Impact of the 2008 global economic crisis on suicide: time trend study in 54 countries", BMJ, vol. 17, No. 347 (September 2013). [Back]
81. Margalida Gili and others, "The mental health risks of economic crisis in Spain: evidence from primary care centres, 2006 and 2010", European Journal of Public Health, vol. 23, No. 1 (February 2013), pp. 103-108. [Back]
82. European Commission, European Economic Forecast: Winter 2014 (Brussels, 2014). [Back]
83. Claudia Costa Storti and others, "Economic recession, drug use and public health", International Journal of Drug Policy, vol. 22, No. 5 (September 2011), pp. 321-325. [Back]
84. Jonathan Caulkins, "The global recession's effect on drug demand -- diluted by inertia", International Journal of Drug Policy, vol. 22, No. 5 (September 2011), pp. 374-375. [Back]
85. Zuccato E. and others, "Changes in illicit drug consumption patterns in 2009 detected by wastewater analysis", Drug Alcohol Depend, vol. 118, Nos. 2 and 3 (November 2011), pp. 464-469. [Back]
86. Botescu Andrei and others, "HIV/AIDS among injecting drug users in Romania Report of a recent outbreak and initial response policies", EMCDDA, 2012 [Back]
87. EMCDDA and Greek RETOIX Focal Point, 2011 National Focal Report (2010 data) to the EMCDDA by the Retoix National Focal Point: Greece -- New Development, Trends and In-Depth Information on Selected Issues (RETOIX, Athens 2011). [Back]
88. Drug possession for personal consumption refers to drug offences related to the use or the possession of drugs for personal consumption (see art. 3, para. 2, of the United Nations Convention against Illicit Traffic in Narcotic Drugs and Psychotropic Substances of 1988). [Back]
89. Drug trafficking refers to drug offences committed not in connection with the use or possession of drugs for personal consumption (see art. 3, para.1, of the 1988 Convention). [Back]
90. UNODC and Ministry of Counter Narcotics of Afghanistan, "Afghanistan opium survey 2013: summary findings", November 2013 [Back]
91. UNODC, Southeast Asia Opium Survey 2013 (Bangkok, 2013). [Back]
93. These calculations are approximate and are derived by assuming that the weighted average purity of heroin seizures worldwide (among which seizures at upper levels of the supply chain, in terms of weight, are believed to be predominant) is no less than one third of the purity at the point of manufacture, and that a range of 7-10 kg of opium are needed for 1 kg of heroin at the point of manufacture. In addition, in order to account for the delay between the production of opium and seizures of derived opiates, some of which are made after processing into heroin and in locations far removed from the source, a two-year moving average of opium production is considered as a proxy for the amount of opiates present in the market. [Back]
94. UNODC, The illicit drug trade through South-Eastern Europe, 2014. [Back]
95. Data from the database on illicit drug seizures with relation to European airports, Germany Customs. [Back]
96. UNODC IDS database. [Back]
97. UNODC, annual report questionnaire, replies submitted by the Russian Federation for 2012. [Back]
98. UNODC and Pakistan, Ministry of Narcotics Control, "Drug use in Pakistan, 2013: technical summary report". [Back]
99. Solar Hijri calendar year 1390. [Back]
100. United States, Department of State, Afghanistan National Urban Drug Use Survey (ANUDUS) (December 2012). [Back]
101. World Drug Report 2011, pp. 73 and 74 and fig. 42. [Back]
102. China, National Narcotics Control Commission, 2013 Annual Report on Drug Control in China (Beijing, 2013). [Back]
103. Ibid., 2014 Annual Report on Drug Control in China (Beijing, 2014). [Back]
104. UNODC, Patterns and Trends of Amphetamine-Type Stimulants and Other Drugs: Challenges for Asia and the Pacific (November 2013). [Back]
106. Malaysia assessed the proportion of seized heroin originating in Myanmar at 80 per cent in 2010. For the reporting year 2011, Malaysia mentioned the Lao People's Democratic Republic, Myanmar and Pakistan as the main countries of provenance. Over the period 2010-2012, Myanmar nationals accounted for the largest number of foreign nationals arrested for drug-related offences in Malaysia. See also UNODC, Patterns and Trends of Amphetamine-Type Stimulants, p. 92. [Back]
107. UNODC, Patterns and Trends of Amphetamine-Type Stimulants (November 2013). [Back]
108. Country report submitted by Malaysia to the Thirty-seventh Meeting of Heads of National Drug Law Enforcement Agencies, Asia and the Pacific. [Back]
109. Pakistan Anti-Narcotics Force "Heroin and precursors trafficking through southern route", presentation made at the UNODC workshop on Afghan opiate trafficking through the southern route, held on 24 and 25 March 2014. [Back]
110. Presentations by the Drug Control Commission of the United Republic of Tanzania on heroin trafficking in the country and by the National Drug Law Enforcement Agency of Nigeria on "heroin trafficking: Nigeria's experience", made at the UNODC workshop on Afghan opiate trafficking, March 2014. [Back]
111. Combined Maritime Forces is a multinational naval partnership that operates in international waters, encompassing some of the world's most important shipping lanes in the Indian Ocean and adjoining bodies of water. [Back]
112. Presentation by the Combined Maritime Forces on counter-narcotics operations in the Indian Ocean, made at the UNODC workshop on Afghan opiate trafficking, March 2014. [Back]
113. Country Report by India to the Thirty-seventh Meeting of Heads of National Drug Law Enforcement Agencies, Asia and the Pacific, Bangkok 21-24 October 2013. [Back]
114. Country Report by India to the Thirty-sixth Meeting of Heads of National Drug Law Enforcement Agencies, Asia and the Pacific, Bangkok 30 October -- 2 November 2012. [Back]
115. Country Report by India to the Thirty-seventh Meeting of Heads of National Drug Law Enforcement Agencies, Asia and the Pacific, Bangkok 21-24 October 2013. [Back]
116. UNODC, annual report questionnaire, replies submitted by Bangladesh, India and Sri Lanka; and country report submitted by India to the Thirty-seventh Meeting of Heads of National Drug Law Enforcement Agencies, Asia and the Pacific. [Back]
117. See UNODC, World Drug Report 2013, pp. 33-35. [Back]
118. Each year of the period 2002-2012, Nigeria consistently ranked between eighth and twelfth among all countries mentioned in the annual report questionnaire as countries of provenance of trafficked heroin. Over the period 2000-2011, Pakistan reported 681 heroin consignments trafficked by air with Nigeria as a destination; expressed as a percentage of all such seizure cases with a known destination other than Pakistan, this number peaked at 51 per cent in 2004 and declined to 3 per cent by 2011. Nigeria assessed the percentage of heroin on its territory that had been trafficked by air in 2004 to be 90 per cent; in 2012, the corresponding proportion was 25 per cent for inbound seizures and 70 per cent for outbound seizures. [Back]
119. Australian Crime Commission, Illicit Drug Data Report 2011-12. [Back]
120. UNODC, annual report questionnaire, replies submitted by the United States for 2012. [Back]
121. UNODC, annual report questionnaire, replies submitted by Canada for 2012. [Back]
122. EMCDDA, Drug profiles, heroin. Available from www.emcdda.europa.eu. [Back]
123. United States, Department of Health and Human Services, National Institute on Drug Abuse, "Topics in Brief: Prescription Drug Abuse" (December 2011), available at www.drugabuse.gov/publications/topics-in-brief/prescription-drug-abuse. [Back]
124. C. M. Jones, "Heroin use and heroin use risk behaviors among nonmedical users of prescription opioid pain relievers -- United States, 2002-2004 and 2008-2010", Drug and Alcohol Dependence, vol. 132, Nos. 1 and 2 (September 2013), pp. 95-100. [Back]
125. UNODC estimates based on data from the National Survey on Drug Use and Health of the Substance Abuse and Mental Health Services Administration and extracted from the Substance Abuse and Mental Health Data Archive, hosted by the Inter-university Consortium for Political and Social Research at the University of Michigan. [Back]
126. G. J. Unick and others, "Intertwined epidemics: national demographic trends in hospitalizations for heroin-and opioid-related overdoses, 1993-2009", PLOS ONE, vol. 8, No. 2 (2013). [Back]
127. United States, Department of Justice, Drug Enforcement Administration, "National Drug Threat Assessment Summary" (November 2013). [Back]
128. Cicero T. J., Ellis M. S. and Surratt H. L., "Effect of abuse-deterrent formulation of OxyContin", New England Journal of Medicine, vol. 367 (2012), pp. 187-189. [Back]
129. EMCDDA, "Fentanyl in Europe: EMCDDA trendspotter study" (Lisbon, November 2012). [Back]
130. Information provided by Estonia in the annual report questionnaire (2012). [Back]
131. EMCDDA, "Drugnet Europe 85" (January-March 2014). [Back]
132. Report of the International Narcotics Control Board for 2012 (E/INCB/2012/1). [Back]
133. World Drug Report 2013. [Back]
134. Amanda Roxburgh and others, Trends in Drug Use and Related Harms in Australia, 2001 to 2013 (Sydney, National Drug and Alcohol Research Centre, University of New South Wales, 2013). [Back]
135. Assessment based on data on morphine and oxycodone injection surveyed in the Australian Illicit Drug Reporting System, presented in Trends in Drug Use and Related Harms in Australia, 2001 to 2013, p. 69. Similar trends also emerge from data -- which cannot be differentiated into appropriate prescribing use and non-medical use -- on medical prescriptions of these substances. See Amanda Roxburgh and others, "Prescription of opioid analgesics and related harms in Australia", Medical Journal of Australia, vol. 195, No. 5 (2011), pp. 280-284. [Back]
136. This comparison is based on a price of 100 Australian dollars for a quarter of a gram of heroin in Queensland, taking into account a purity in Queensland of 18.1 per cent (median) at the retail level (for quantities not larger than 2 g), and a potency for heroin of 2.67-3.33 times that of oxycodone. Under those assumptions, 0.25 g of heroin would be equivalent to 121-151 mg of pure oxycodone, which is higher than the relevant purchase unit for oxycodone (60 mg, net of bulking agents). The comparison does not correct for the "bulk discount" possibly arising from this discrepancy, but such a correction (if it could be quantified) would render the price of heroin even higher relative to oxycodone. Price and purity data from the Australian Crime Commission, Illicit Drug Data Report 2011-12. [Back]
137. New Zealand reported a price of 1,000 New Zealand dollars per gram (approximately 807 United States dollars, using 2012 exchange rates) of imported heroin during the reporting years 2011 and 2012, which was double the per-unit price of "homebake" (50 New Zealand dollars per 100 mg), despite the greater size of the purchase unit of the former. [Back]
138. United States, Department of State, Bureau for International Narcotics and Law Enforcement, Demand Reduction Program Research Brief, "Afghanistan National Urban Drug Use Survey" (December 2012). [Back]
139. World Drug Report 2013 and Report of the International Narcotics Board Control for 2012 (E/INCB/2012/1). [Back]
140. UNODC, Government of Colombia, Colombia: Coca cultivation survey 2012 (June 2013). [Back]
142. However, there remains the possibility of double-counting of quantities of cocaine seized, considering that there are joint operations conducted by national agencies together with agencies of other countries. [Back]
143. In its reply to the relevant question in the annual report questionnaire, the United States assessed that 95 per cent of cocaine seized in 2012 originated in Colombia. In terms of the last country from which cocaine entered the United States, Mexico and the countries of Central America collectively accounted for 96 per cent of seizures made in the United States. [Back]
144. United States, Department of Justice, Drug Enforcement Administration, National Drug Threat Assessment Summary 2013 (November 2013). [Back]
145. From around 2005 onward, seizures at sea appear to correlate well with the prevalence of cocaine use, suggesting that maritime seizures reported by the United States reflect cocaine availability reasonably well (significantly better than seizures at the south-west border). When a time lag of one year from the supply indicator (seizures) to the demand indicator (prevalence) is introduced (comparing seizures in the period 2004-2011 to prevalence in the period 2005-2012, rather than using the period 2004-2011), the correlation coefficient improves from 0.89 to 0.96. [Back]
146. Brazil, National Drug Policy Secretariat (SENAD), First Nationwide Survey on the Use of Alcohol, Tobacco and Other Drugs among College Students in the 27 Brazilian State Capitals (Brasilia, 2010). [Back]
147. The small decline in coca bush cultivation in Peru registered in 2012 was probably too recent to have an impact on indicators in Europe in 2012. As of 2011, cultivation in Peru had increased for six consecutive years (by 34 per cent), while in Colombia it stood at approximately one third less than the peak level of 2007, and in the Plurinational State of Bolivia, where the cultivation area continued to be significantly lower than both Colombia and Peru, it fell to the lowest level since 2005. An increase in cocaine originating in Peru is also borne out by data from Australia (see figure 38 and relevant discussion). See also Cocaine Smuggling in 2011, produced for the United States Office on National Drug Control Policy. [Back]
148. Amanda Roxburgh and others, Trends in Drug Use and Related Harms in Australia, 2001 to 2013, p. 108. [Back]
149. Finland, Latvia and Lithuania all identified the Russian Federation as being among the destinations of cocaine seized on their territory at least once over the reporting years 2010-2012. [Back]
150. This is suggested by a combined analysis of replies to the annual report questionnaire submitted by Albania, Austria, Belarus, Bulgaria, Hungary, Poland, Romania, Serbia, Turkey and Ukraine. See also the World Drug Report 2013, pp. 44-45. [Back]
151. Nigeria identified South Africa as being among the countries of provenance for seized cocaine every year from 2009 to 2012. However, among individual cocaine seizures made in West and Central Africa since 2006, a small number (14) of cocaine consignments (including 9 seized by Nigeria) were seized on their way to South Africa, but none were seized entering the region from South Africa. [Back]
152. See also the World Drug Report 2013, p. 40. [Back]
153. UNODC annual report questionnaire and other official data. [Back]
154. World Drug Report 2013. [Back]
155. UNODC and Afghanistan, Ministry of Counter-Narcotics, "Afghanistan opium price monitoring monthly report" (December 2012). [Back]
156. United States, Department of Health and Human Services, Substance Abuse and Mental Health Services Administration , "Monitoring the Future Surveys". [Back]
157. Health Canada, 2012 Canadian Alcohol and Drug Use Monitoring Survey (Ottawa, 2013). [Back]
158. UNODC, annual report questionnaire for 2012. [Back]
159. United States, Department of Justice, Drug Enforcement Administration, National Drug Threat Assessment Summary 2013 (November 2013), p. 12. [Back]
160. Data from Treatment Episode Data set as reported in the 2013 National Drug Threat Assessment Summary. [Back]
161. United States, Drug Enforcement Administration, National Drug Threat Assessment Summary 2013, p. 12. [Back]
163. Data from the Brazilian National Alcohol and Drugs Survey (BNADS II), Cannabis use in Brazil, 2012. [Back]
164. UNODC and Pakistan, Drug use in Pakistan, 2013. [Back]
166. UNODC, annual report questionnaire. [Back]
167. Price data retrieved on self-reported price, quality and location information for the United States, submitted to the PriceOfWeed.com website. [Back]
168. Uruguay, Law No. 19.172. In Uruguay, prior to passing of the new law legislation already exempted from punishment the possession of a "reasonable quantity" (of any drug) intended exclusively for personal use. The new legislation now permits cannabis cultivation, production and sale for recreational use. [Back]
169. United States, State of Washington, Initiative Measure No. 502. Available at http://lcb.wa.gov/publications/Marijuana/I-502/i502.pdf. [Back]
170. Data from Amendment 64: Use and Regulation of Marijuana (United States, Constitution of the State of Colorado, art. XVIII, sect. 16). Available at www.fcgov.com/mmj/pdf/amendment64.pdf. [Back]
171. The United States federal Controlled Substances Act continues to prohibit cannabis production, trafficking and possession. [Back]
172. For non-medical and non-scientific uses. [Back]
173. Report of the International Narcotics Control Board for 2013 (E/INCB/2013/1). [Back]
174. Uruguay, Law No. 19.172. [Back]
175. United States, State of Colorado, Amendment 64, sect. 5, part 2. [Back]
176. In the states of Colorado and Washington, for-profit businesses can enter the market and use any means that are within the law to promote production, consumption and profits. [Back]
177. United States, Center for Public Health and Tobacco Policy, "Cause and effect: tobacco marketing increases youth tobacco use - findings of the 2012 Surgeon General's report (Boston, 2012). Available at www.tobaccopolicycenter.org/documents/SGR%20NY%205-25-12.pdf. [Back]
178. Researchers estimate that the pre-tax retail price will decline by more than 80 per cent, but the eventual consumer price will depend on the tax-structure. See Beau Kilmer and others, Altered State? Assessing How Marijuana Legalization in California could Influence Marijuana Consumption and Public Budgets (Santa Monica, California, RAND Corporation, Drug Policy Research Center, 2010). [Back]
179. J. P. Caulkins and others, "Design considerations for legalizing can-nabis: lessons inspired by analysis of California's Proposition 19", Addiction, vol. 107, No. 5 (2011), pp. 865-871. [Back]
180. Beau Kilmer and others, Altered State? [Back]
181. Rosalie Liccardo Pacula, "Examining the impact of marijuana legalization on marijuana consumption: insights from the economics literature" (RAND Corporation, Working Papers, July 2010). [Back]
182. Research by the United States Substance Abuse and Mental Health Services Administration has shown initiation of marijuana use before the age of 15 is associated with higher risk of other drug use at 26 or older, and that those who tried marijuana before the age of 15 were six times more likely to be dependent on an illicit drug at 26 or older (relative to those who initiated marijuana at 21 or older). (See Joseph C. Gfroerer, Li-Tzy Wu and Michael A. Penne, Initiation of Marijuana Use: Trends, Patterns, and Implications, Substance Abuse and Mental Health Services Administration, Rockville, Maryland, 2002.) [Back]
183. M. H. Meier and others, "Persistent cannabis users show neuro-psychological decline from childhood to midlife, Proceedings of the National Academy of Sciences of the United States of America, vol. 109, No. 40 (October 2012), pp. E2657-E2664. [Back]
184. A. Caspi and others, "Moderation of the effect of adolescent-onset cannabis use on adult psychosis by a functional polymorphism in the catechol-Omethyltransferase gene: longitudinal evidence of a gene X environment interaction", Biological Psychiatry, vol. 57, No. 10 (15 May 2005), pp. 1117--1127; Wayne Hall and Louisa Degenhardt, "Adverse health effects of non-medical cannabis use", The Lancet, vol. 374, No. 9698 (October 2009), pp. 1383--1391; Wayne Hall, "The adverse health effects of cannabis use: What are they, and what are their implications for policy?", International Journal of Drug Policy, vol. 20, No. 6 (2009), pp. 458--466; A. D. Schweinsburg, S. A. Brown and S. F. Tapert, "The influence of marijuana use on neuro-cognitive functioning in adolescents", Current Drug Abuse Review, vol. 1, No. 1 (2008), pp. 99--111; D. M. Fergusson and J. M. Boden, "Cannabis use and later life outcomes", Addiction, vol. 103, No. 6 (2008), pp. 969--976 and discussion pp. 977--968; E. Gouzoulis-Mayfrank, "Dual diagnosis psychosis and substance use disorders: theoretical foundations and treatment" [article in German], Zeitschrift für Kinder- und Jugendpsychiatrie und Psychotherapie, vol. 36, No. 4 (2008), pp. 245--253; J. Macleod and others,"Psychological and social sequelae of cannabis and other illicit drug use by young people: a systematic review of longitudinal, general population studies", The Lancet, vol. 363, No. 9421 (2004), pp. 1579--1588; John Curtis, "Study suggests marijuana induces temporary schizophrenia-like effects", Yale Medicine, vol. 39, No. 1 (Fall/Winter 2004); "Neuro-toxicology: neurocognitive effects of chronic marijuana use characterized", Managed Care Weekly Digest (16 May 2005); J. McGrath and others, "Association between cannabis use and psychosis-related outcomes using sibling pair analysis in a cohort of young adults", Archives of General Psychiatry, vol. 67, No. 5 (2010), pp. 440-447; L. Goldschmidt and others, "Prenatal marijuana exposure and intelligence test performance at age 6", Journal of the American Academy of Child and Adolescent Psychiatry, vol. 47, No. 3 (March 2008), pp. 254263; J. M. Tertrault and others, "Effects of marijuana smoking on pulmonary function respiratory complications: a systematic review", Archives of Internal Medicine, vol. 167, No. 3 (2007), pp. 221-228; BMJ-British Medical Journal, "Cannabis use doubles chances of vehicle crash, review finds", in Science Daily (10 February 2012). [Back]
185. S. Khatapoush and D. Hallfors, "Sending the wrong message: did medical marijuana legalization in California change attitudes about and use of marijuana", Journal of Drug Issues, vol. 34, No 4 (October 2004), pp. 751-770. [Back]
186. See L. D. Johnston and others, Monitoring the Future National Survey Results on Drug Use 1975-2012: Key Findings on Adolescent Drug Use (Institute for Social Research, University of Michigan, 2012). [Back]
187. E. L. Sevigny and others, "The effects of medical marijuana laws on potency", International Journal of Drug Policy, vol. 25, No. 2 (18 January 2014), pp. 308-319. [Back]
188. Heavy use is defined as daily or near daily use. [Back]
189. Panel of three people known as the "commission for the dissuasion of drug addiction" (Comissoes para a Dissuasão da Toxicodependência). [Back]
190. Caitlin Hughes and Alex Stevens, "The effects of decriminalization of drug use in Portugal", Briefing Paper 14 (Beckley Foundation Drug Policy Programme, December 2007). Available at http://kar.kent.ac.uk. [Back]
191. Karyn Model, "The effect of marijuana decriminalisation on hospital emergency room drug episodes: 1975-1978", Journal of the American Statistical Association, vol. 88, No. 423 (September 1993), pp. 737-747. [Back]
192. Depenalization refers to any policy that reduces penalties, quantitatively (amount of penalty) or qualitatively (type of penalty), associated with possession or use of cannabis for non-medical or non-scientific purposes, but there are variations from country to country in the respective laws and how they are enforced. Decrim-inalization implies a change in the nature of the consequences of possession or use, from criminal penalties to administrative or civil penalties or to no penalties. [Back]
193. In the United States, approximately 750,000 people are arrested each year for cannabis possession. A similar order of magnitude in the number of arrests is seen in the European Union, with nearly 800,000 arrested for cannabis-related drug offences in 2011. [Back]
194. S. Lenton and others, "Laws applying to minor cannabis offences in Australia and their evaluation", International Journal of Drug Policy, vol. 10, No. 4 (1999), pp. 299-303. [Back]
195. Robin Room and others, Cannabis Policy Moving Beyond Stalemate (Oxford University Press, 2010). [Back]
196. UNODC, World Drug Report 2011. [Back]
197. Alejandro Hope and Eduardo Clark, "Si los vecinos legalizan: reporte tecnico", Instituto Mexicano para la Competitividad (October 2012). Available at www.imco.org.mx. [Back]
198. Beau Kilmer and others, Reducing Drug Trafficking Revenues and Violence in Mexico, Would Legalizing Marijuana in California Help? (Rand Corporation, 2010), e-book. [Back]
199. See "The fiscal impact of Amendment 64 on state revenues" (Colorado, Colorado State University, 24 April 2013). [Back]
200. UNODC and Pakistan, Drug use in Pakistan, 2013. [Back]
201. Precursors and Chemicals Frequently Used in the Illicit Manufacture of Narcotic Drugs and Psychotropic Substances: Report of the International Narcotics Control Board for 2012 on the Implementation of Article 12 of the United Nations Convention against Illicit Traffic in Narcotic Drugs and Psychotropic Substances of 1988 (E/INCB/2012/3). [Back]
202. United States, Drug Enforcement Administration, "National Drug Threat Assessment Summary" (November 2013). [Back]
203. UNODC annual report questionnaire and other official sources. [Back]
204. Central Asian Regional Information and Coordination Centre (CARICC) Information Bulletin No. 114, 11 June 2012. [Back]
205. UNODC and Pakistan, Drug use in Pakistan, 2013. [Back]
206. International Narcotics Control Board annual report 2012 and previous reports. [Back]
207. United States, Quest Diagnostics, "Drug Testing Index", (Madison, New Jersey, November 2013). [Back]
208. The annual prevalence of mephedrone declined from 1.1 per cent in 2011/12 to 0.5 per cent in 2012/13 in the adult population and from 3.3 per cent to 1.6 per cent among young adults, while ketamine annual prevalence has declined from 0.6 per cent to 0.4 per cent in the adult population and from 1.8 per cent to 0.8 per cent among young adults over the same period. [Back]
209. United Kingdom, Home Office, "Drug misuse: findings from the 2012/13 Crime Survey for England and Wales" (London, July 2013). [Back]
210. United Kingdom, National Treatment Agency for Substance Misuse, Club drugs: emerging trends and risks (London, November 2012). [Back]
211. This is an update from the World Drug Report 2013, which contains a detailed chapter on new psychoactive substances. [Back]
212. Early warning advisory on new psychoactive substances, UNODC. This information is based on information submitted by Member States through surveys and submissions to UNODC from laboratories participating in the international collaborative exercises programme. [Back]
213. UNODC, The Challenge of New Psychoactive Substances (Vienna, March 2013). [Back]
214. In 2011, mephedrone, methylenedioxypyrovalerone (MDPV) and five synthetic cannabinoids were placed under temporary control (United States, Drug Enforcement Administration, "Schedules of controlled substances: temporary placement of three synthetic cathi-nones into Schedule I", Final order, 21 CFR Part 1308, Docket No. DEA-357). In 2012, these substances, along with 26 synthetic cannabinoids were placed permanently under control within the Controlled Substance Act (as amended by the Synthetic Drug Abuse Prevention Act of 2012). [Back]
215. National Institute on Drug Abuse, United States, Monitoring the Future Survey (December 2013). Available at http://monitoringthefuture.org/data/13data.html#2013data-drugs. [Back]
216. United Kingdom, Home Office, "Drug misuse: findings from the 2012/13 Crime Survey for England and Wales". [Back]
217. For example, through the Internet website "Talk to Frank" website (www.talktofrank.com) and the Welsh Emerging Drugs and Identification of Novel Substances project (www.wedinos.org). [Back]
218. In 2010, mephedrone was initially placed under control as a class B drug in the United Kingdom Misuse of Drugs Act (1971). [Back]
219. United Kingdom, Home Office, "Drug misuse: findings from the 2012/13 Crime Survey for England and Wales". [Back]
220. Chemical Action Task Force, Status Report for the 1992 Economic Summit (Washington, D.C., June 1992), p. 11. [Back]
221. Progress made in precursor control was highlighted in the March 2014 joint ministerial statement of the high-level review by the Commission on Narcotic Drugs on the implementation by Member States of the Political Declaration and Plan of Action on International Cooperation towards an Integrated and Balanced Strategy to Counter the World Drug Problem. [Back]
222. The International Narcotics Control Board is given the prime responsibility for precursor control at the international level under article 12 of the 1988 Convention. [Back]
223. United Nations, Commentary on the United Nations Convention against Illicit Traffic in Narcotic Drugs and Psychotropic Substances 1988 (New York, 1998). [Back]
224. "Reagents" are chemicals that react with, or take part in the reaction of another substance during the manufacture of a drug. They do not become part of the molecular structure of the end product. "Solvents" are liquid chemical substances used to dissolve or disperse one or more substances. They do not "react" with other substances and are not incorporated into the molecular structure of the end product. They are typically used to purify the end product. [Back]
225. General Assembly resolutions S-20/4 A-E. [Back]
226. UNODC estimates, based on data contained in the 2013 edition of the UNIDO INDSTAT 2 database at the two-digit level of International Standard Industrial Classification (ISIC) Revision 3. [Back]
227. International Narcotics Control Board, Precursors and Chemicals Frequently Used in the Illicit Manufacture of Narcotic Drugs and Psychotropic Substances: 2012 (New York, 2013), paras. 45-49. [Back]
228. Information from the INDSTAT 2 database, which has entries regarding the chemical industry of 158 countries and areas over the 1963-2010 period. Data are missing mainly from a few island countries and, in recent years, from countries affected by serious conflict in Africa. [Back]
229. The value added of the manufacture of chemicals is defined as the sum of gross output less the value of intermediate inputs used in the production for industries classified under International Standard Industrial Classification (ISIC) major division 3 by UNIDO as chemical industries. This comprises ISIC groups 351 (manufacture of industrial chemicals) and 352 (manufacture of other chemical products). The ISIC groups 353 (petroleum refineries), 354 (miscellaneous products of petroleum and coal), 355 (rubber products) and 356 (plastic products) are not included. [Back]
230. The data presented here are UNODC estimates based on country data provided by the World Bank (for the value added of manufacturing in United States dollars) and by the UNIDO INDSTAT 2 database (for the proportion of the manufacturing sector comprised by the chemical sector), as reported by the World Bank. For missing years within a time series for a particular country, an interpolation was applied. For missing data at the beginning or end of a time series, the assumption was made that results remained unchanged from the first (or last) reporting year. [Back]
231. The concepts of value added and output are different economic measures of overall production. Value added measures the value of the final product regardless of the number of companies involved in the intermediate production steps, while output measures the value of the products produced during all production steps. Countries with higher levels of output and similar levels of value added may reflect an overall lower degree of vertical integration. [Back]
232. This ranking is based on UNIDO data for 2010 or the latest year available (adjusted for inflation). [Back]
233. Companies and Markets, "Global Chemicals Market" (11 July 2013). Available from www.companiesandmarkets.com. [Back]
234. Despite its sizable chemical industry, Taiwan Province of China does not participate in international precursor control. The International Narcotics Control Board encouraged the Government of China to work with Taiwan Province of China to devise practical ways and means of addressing the issue, notably in the areas of pre-export notifications, suspicious shipments and diversions of precursors involving Taiwan Province of China (see Precursors Report, 2013, para. 33). [Back]
235. European Chemical Industry Council, "Chemicals sales by country: top 30" (2012). Available from www.cefic.org. [Back]
236. The average output per "establishment" of the chemical industry during the 2007-2009 period amounted to $81 million in the Netherlands, $64 million in Belgium and $59 million in Germany. This was more than three times the average output per establishment in China ($18 million), more than eight times the average output per establishment in India ($7 million), 15 times the average in Hong Kong, China, or Viet Nam ($4 million) and more than 40 times the average in Thailand ($1.25 million in 2006) (INDSTAT 2 database). [Back]
237. MBendi Information Services, "World chemicals: global chemical industry overview". Available from www.mbendi.com. [Back]
238. This applies to 34 out of 146 countries and areas for which both export and domestic production data were available. Adding countries and areas which exported chemicals but did not report production of chemicals, the overall proportion of countries and areas where exports exceeded domestic production would rise to above 40 per cent (80 out of 192). [Back]
239. Data on 127 countries and areas for the year 2012 show a correlation coefficient of r = 0.93 between imports and exports. [Back]
240. The "know your customer" principle, for those who manufacture or market chemicals, is set out in the Political Declaration adopted by the General Assembly at its twentieth special session and the measures to enhance international cooperation to counter the world drug problem (General Assembly resolutions S-20/4 A-E). [Back]
241. Any product obtained from any of the phenanthrene alkaloids of opium or from the ecgonine alkaloids of the coca leaf. [Back]
242. Article 11 of the 1931 Convention made it clear that no manufacture or trade in such products should be allowed "unless and until it has been ascertained to the satisfaction of the Government concerned that the product in question is of medical or scientific value". [Back]
243. In article 2 of the 1936 Convention, each of the High Contracting Parties agreed "to make the necessary legislative provisions for severely punishing, particularly by imprisonment or other penalties of deprivation of liberty ... the manufacture, conversion, extraction, preparation ... of narcotic drugs, contrary to the provisions of the ... conventions". Article 10 of the Convention states that "any narcotic drugs as well as any substances and instruments intended for the commission of any of the offences referred to in article 2 shall be liable to seizure and confiscation". This was the first international obligation relating to precursor control. Nonetheless, the practical importance of this obligation remained limited, as only 13 countries (Belgium, Brazil, Canada, China, Colombia, Egypt, France, Greece, Guatemala, Haiti, India, Romania and Turkey) signed and ratified the Convention (Thomas Pietschmann, "A century of international drug control", Bulletin on Narcotics, vol. LIX, Nos. 1 and 2 (2007). [Back]
244. Article 2, paragraph 8, of the 1961 Convention states that "the Parties shall use their best endeavours to apply to substances which do not fall under this Convention, but which may be used in the illicit manufacture of drugs, such measures of supervision as may be practicable". This definition of a "substance" was left very broad on purpose, as the authors admitted that they could not foresee what kind of substances would be employed in the illicit manufacture of drugs in the future. Article 2 is important because it lays down a general obligation for the control of precursors used in the manufacture of narcotic drugs. In the discussion of the plenipotentiary conference that adopted the 1961 Convention, acetic anhydride, used in the conversion of morphine into heroin, was explicitly mentioned as a substance to which paragraph 8 would apply (Commentary on the Single Convention on Narcotic Drugs, 1961 (New York, 1962)). [Back]
245. Article 3, paragraph 3 (iii), of the 1961 Convention enables the scope of controlled substances to be extended to any substance "convertible into a drug". Thus, one finds ecgonine, an alkaloid of the of coca plant which itself is not addictive but which can be converted into cocaine, in Schedule I of the 1961 Convention. [Back]
246. The specific provisions for precursor control of the 1936 Convention entered the 1961 Convention in article 37: "Any drug, substances and equipment used in or intended for the commission of any of the offences, referred to in article 36, shall be liable to seizure and confiscation." Article 36 states that each Party shall "adopt such measures as will ensure that ... production, manufacture, extraction, preparation ... of drugs contrary to the provisions of this Convention ... shall be punishable offences when committed intentionally". [Back]
247. Article 2 states that "the Parties shall use their best endeavours to apply to substances which do not fall under this Convention, but which may be used in the illicit manufacture of psychotropic substances, such measures of supervision as may be practicable". Subsequently, article 22 also follows closely the wording of the Single Convention, laying down in its paragraph 3 that "any psychotropic substance or other substance, as well as any equipment, used in or intended for the commission of any of the offences referred to . shall be liable to seizure and confiscation". [Back]
248. Thus lysergic acid, for instance, which is easily convertible into lysergic acid diethylamide (LSD), could not be scheduled under the 1971 Convention. [Back]
249. The Convention has been ratified by or acceded to by 187 countries and areas (plus the European Union). [Back]
250. Substances listed in Table I are specifically required in the manufacture of narcotic drugs or psychotropic substances. Substances listed in Table II are mostly solvents, cleaning agents and chemical reagents. [Back]
251. Article 12, paragraph 1, contains a general statement that "the Parties shall take the measures they deem appropriate to prevent diversion of substances in Table I and Table II used for the purpose of illicit manufacture of narcotic drugs or psychotropic substances, and shall cooperate with one another to this end". [Back]
252. Article 12, paragraph 8 (a), states that "the Parties shall take the measures they deem appropriate to monitor the manufacture and distribution of substances in Table I and Table II which are carried out within their territory". Paragraph 8 (b) proposes the following concrete measures that parties may take to that end:
(i) Control all persons and enterprises engaged in the manufacture and distribution of such substances;
(ii) Control under licence the establishment and premises in which such manufacture or distribution may take place;
(iii) Require that licensees obtain a permit for conducting the aforesaid operations;
(iv) Prevent the accumulation of such substances in the possession of manufacturers and distributors, in excess of the quantities required for the normal conduct of business and the prevailing market conditions. [Back]253. Article 12, paragraph 9, lists the following measures that each party shall take with regard to international trade in substances in Table I and Table II:
(a) Establish and maintain a system to monitor international trade in such substances in order to facilitate the identification of suspicious transactions;
(b) Provide for the seizure of any such substance if there is sufficient evidence that it is for use in the illicit manufacture of a narcotic drug or psychotropic substance;
(c) Notify, as soon as possible, the competent authorities and services of the parties concerned if there is reason to believe that the import, export or transit of such a substance is destined for the illicit manufacture of narcotic drugs or psychotropic substances;
(d) Require that imports and exports be properly labelled and documented;
(e) Ensure that documents referred to in subparagraph (d) above are maintained for a period of not less than two years and may be made available for inspection by the competent authorities. [Back]254. Article 12, paragraph 10, contains the core principle of international precursor control: the obligation of an exporting country, if asked by an importing country, to issue a "pre-export notification" for substances listed in Table I. This then entails some form of a clearance or permission to be granted from the competent authorities of the importing country. Importing countries can adopt stricter measures and request a pre-export notification not only for substances in Table I but also for some or all of the substances in Table II. A number of countries have made use of this provision. [Back]
255. See article 12, paragraph 11. [Back]
256. Article 12, paragraph 14, for example, excludes pharmaceutical preparations from precursor controls if such substances cannot be easily used in the manufacture of drugs: "The provisions of this article shall not apply to pharmaceutical preparations, nor to other preparations containing substances in Table I or Table II that are compounded in such a way that such substances cannot be easily used or recovered by readily applicable means". [Back]
257. In the case of States members of the European Union, the prime responsibility is with the European Union, not the individual member States. [Back]
258. See article 12, paragraphs 2-7. [Back]
261. Article 22 sets forth action that the Board may take if it has reason to believe that the aims of the Convention in matters related to its competence are not being met. [Back]
262. See article 14, paragraph 2, of the 1961 Convention and article 19, para. 2, of the 1971 Convention. [Back]
263. That list contained more than 50 substances in 2012. [Back]
264. For more information, see http://incb.org/incb/en/precursors/precursors/tools_and_kits.html. [Back]
265. Topics addressed included the following: controls for non-scheduled substances, the Precursors Incident Communication System, the strengthening of monitoring and control systems at the points of entry of precursors (airports, ports, customs ports), the real-time exchange of information, backtracking investigations, the promotion of participation in Project Prism and Project Cohesion, chemical profiling, training in precursor control, the provision to International Narcotics Control Board of annual estimates of legitimate requirements for precursors of amphetamine-type stimulants, trafficking via the Internet, the development of joint actions with the national chemical industry, the promotion of a voluntary code of conduct for the chemical industry, the smuggling of precursors to and within Afghanistan, use of the Pre-Export Notification Online system for precursors and pharmaceutical preparations containing ephedrine and pseudoephedrine, treatment of safrole-rich oils, ephedra, PMK (=3,4-methylenedioxyphenyl-2-propanone (3,4-MDP-2-P)), nore-phedrine and potassium permanganate. A comprehensive summary of the resolutions relevant to precursor control is available from http://incb.org/incb/en/precursors/resolutions.html. [Back]
266. General Assembly resolution S-20/2. [Back]
267. General Assembly resolutions S-20/4 A-E. [Back]
268. See General Assembly resolution S-20/4 B, paras. 4, 7 (a) (i) and 9 (b). [Back]
269. Ibid., para. 9 (c). In addition, the "know your customer" principle is found in several resolutions of the Economic and Social Council and the Commission on Narcotic Drugs. [Back]
270. General Assembly resolution S-20/4 B, para. 14 (b). [Back]
271. See Official Records of the Economic and Social Council, 2009, Supplement No. 8 (E/2009/28), chap. I, sect. C, Plan of Action, para. 33; and Political Declaration, para. 36. [Back]
272. Ibid., Plan of Action, paras. 35 and 39. While the 1988 Convention excluded pharmaceutical preparations from the control efforts (para. 14), the 2009 Plan of Action, as a consequence of the changed situation, stated in its paragraph 36 (c) that Member States should "strengthen controls, including through the Pre-Export Notification Online system, where required, for the import and export of preparations containing precursor chemicals, such as ephedrine and pseudoephedrine, which could be used in the manufacture of amphetamine-type stimulants". [Back]
273. Ibid., paras. 41 (k) and (r). [Back]
275. Ibid., para. 41 (s). [Back]
276. Ibid., para. 41 (u). That provision has not been widely used so far. While that could represent a major leap forward in strengthening and improving backtracking investigations, there are concerns about the costs involved and its actual value added. In addition, the "marking" involved in the provision could be potentially problematic if applied to chemicals used in the manufacture of pharmaceutical products, entailing expensive litigation if patients claim that such pharmaceuticals have been contaminated. [Back]
277. Twenty Governments reported licit manufacture of any of the 15 Table I precursor chemicals during the 2010-2012 period, out of a total of 104 Governments reporting to UNODC in part I of the annual reports questionnaire. According to UN COMTRADE, 73 countries exported Table I precursor chemicals during the 2010-2012 period, i.e. almost half of the countries contained in that database. Thirty-eight countries reported higher exports of Table I precursors than imports during the 2010-2012 period. If exports exceed imports in a country over a period of time, local manufacture is probably taking place. Combining information from the annual reports questionnaire and UN COMTRADE, the number of "potential" Table I manufacturing countries could rise to 47. Extending the analysis to all substances controlled in Table I and Table II, UN COMTRADE data show exports of internationally controlled precursors by 122 countries and imports by 150 countries. If one includes countries reporting domestic precursor production, the potential number of countries involved in the manufacture of precursor chemicals rises to 77. [Back]
278. International trade is defined here, in line with the definition used by the Board, as the total levels of exports or imports, whichever is greater. Global exports should, in theory, largely equal global imports, except for minor differences. Owing to a lack of consistent reporting, however, there are important data discrepancies, i.e. some countries report exports, but not all of their trading partners report the corresponding imports, and vice versa. [Back]
279. October 2013 data from UN COMTRADE, based on HS07 classification for precursor chemicals and Standard International Trade Classification Revision 3 for global imports and exports of chemicals. [Back]
280. The subsequent analysis of international trade will be based, unless otherwise indicated, on information contained in UN COMTRADE. Those data have the advantage of being readily available and, in contrast to trade data submitted by Member States to the Board, not being subject to any confidentiality clauses. [Back]
281. The number of countries reporting seizures of Table I precursors to the Board rose from 32 in 2002 to 51 in 2012; the number of countries reporting seizures of Table II precursors rose from 28 to 45 during the same time period. [Back]
282. Data from the annual reports questionnaire of UNODC. [Back]
283. The peak in 2011 occurred in the wake of the international Operation Phenylacetic Acid and Its Derivatives, conducted under the auspices of Project Prism, which deals with precursors of synthetic drugs. [Back]
284. Josef Köhler and others, Explosivstoffe (Wiley-VCH, July 2008). [Back]
285. H. L. Schlesinger, "Topics in the chemistry of cocaine", in Bulletin on Narcotics, Issue 1 (1985), pp. 63-78. [Back]
286. If correctly reported, total imports and exports at the global level should be equal in weight terms. [Back]
287. See calculations in subsection 1 (a) of section G below. [Back]
288. International Narcotics Control Board, Precursors Report, 2013. [Back]
289. International Narcotics Control Board, Precursors Report, 2012, para. 96. [Back]
290. Seizures of potassium permanganate in the Plurinational State of Bolivia surged between 2006 (104 kg) and 2011 (9,914 kg) before falling in 2012 (954 kg). These trends were in parallel with the destruction of coca base and HCl laboratories in that country, rising from 645 in 2000 to 2,622 in 2005, 4,074 in 2006 and 5,299 in 2011, before falling to 4,508 in 2012. (UNODC, Estado Plurinacional de Bolivia: Monitoreo de Cultivos de Coca 2012 (July 2013)). [Back]
291. The average annual area under coca cultivation declined in Colombia by 71 per cent between 2000 and 2012, or 18 per cent during the 2007-2012 period as compared with the 2002-2006 period. In contrast, it increased in Peru by 39 per cent during the 2000-2012 period, or 23 per cent during the 2007-2012 period as compared with the 2002-2006 period, and it increased in the Plurinational State of Bolivia by 73 per cent between 2000 and 2012, or by 15 per cent during the 2007-2012 period as compared with the 2002-2006 period. (See chapter I of this edition and previous World Drug Reports) [Back]
292. The number of dismantled cocaine paste, base and crystallization laboratories rose in the Plurinational State of Bolivia from 3,093 units in 2007 to 5,299 units in 2011. Similarly, the number of dismantled coca paste and base laboratories in Peru rose from 649 in 2007 to 1,498 in 2011 while the number of cocaine crystallization laboratories there rose from 16 in 2007 to 21 in 2010 and still 19 in 2011. In contrast, the number of cocaine paste/base laboratories in Colombia declined from 3,147 in 2008 to 2,200 in 2011 while the number of dismantled cocaine crystallization laboratories fell in Colombia from 296 to 200 over the same period. (UNODC, Colombia, Monitoreo de Cultivos de Coca 2011 and previous years; Peru, Monitoreo de Cultivos de Coca 2011 and previous years; and Estado Plurinacional de Bolivia, Monitoreo de Cultivos de Coca 2011 and previous years.) [Back]
293. Data from the annual reports questionnaire of UNODC. [Back]
294. International Narcotics Control Board, Precursors Report, 2013, para. 97. [Back]
295. International Narcotics Control Board, Precursors Report, 2012, para. 95. [Back]
296. International Narcotics Control Board, Precursors Report, 2013, para. 98. [Back]
297. United Nations International Drug Control Programme, Recommended Methods for Testing Opium, Morphine and Heroin (New York, 1998), p. 7. [Back]
298. "Acetic Acid Global Market to 2020" (GBI Research, 1 February 2013). Available from www.companiesandmarkets.com. See also www.plastemart.com/Plastic-Technical-Article.asp?LiteratureID=1918&Paper=global-acetic-acid-market-estimated-15.5-million-tons-2020. [Back]
299. International Narcotics Control Board, Precursors Report, 2012, box 1. One kilogram of acetic anhydride is equivalent to 0.926 litres of acetic anhydride. [Back]
300. International Narcotics Control Board, Precursors Report, 2013, para. 106. [Back]
301. International Narcotics Control Board, Precursors Report, 2013, paras. 109-112. [Back]
302. This reflects huge exports of 94,749 tons of acetic anhydride in 2008, while no exports were reported in other years. [Back]
303. According to Board classification, West Asia includes countries in the Near and Middle East, Central Asia, Turkey and the Caucasus. [Back]
304. International Narcotics Control Board, Precursors Report, 2012, para. 106. [Back]
305. International Narcotics Control Board, Precursors Report, 2012, para. 112. [Back]
306. In January 2012, Iraqi authorities objected to a shipment of 32 tons of acetic anhydride from China. (INCB, 2012 Precursors and chemicals frequently used in the illicit manufacture of narcotic drugs and psychotropic substances, New York 2013, p. 25). [Back]
307. In mid-2013, for instance, 15 tons of acetic anhydride were seized while transiting Pakistan on its way to Afghanistan (International Narcotics Control Board, Precursors Report, 2013, para. 111). [Back]
308. A recent example was a shipment of 17.8 tons of acetic anhydride from China via the Islamic Republic of Iran to Afghanistan, which was seized by the Iranian authorities in June 2013. (International Narcotics Control Board, Precursors Report, 2013, para. 111). [Back]
309. According to the International Narcotics Control Board classification, which excludes Turkey. [Back]
310. One of the largest cases involved the seizure of 17 tons of acetic anhydride in Turkey in December 2010 on a truck which had loaded the chemicals in Slovakia and was, officially, said to be transporting disinfectants. [Back]
311. International Narcotics Control Board, Precursors Report, 2012, para. 115. [Back]
312. Woodburne Levy and Kavita Kalidas, "Use of addictive medications and drugs in athletics", in Principles of Addictions and the Law: Applications in Forensic, Mental Health, and Medical Practice, Norman S. Miller, ed. (Academic Press, 2010), pp. 307-308. [Back]
313. World Health Organization, WHO Model List of Essential Medicines: 18th list (April 2013). [Back]
314. "Annual legitimate requirements for ephedrine and pseudoephedrine include quantities of those substances that may be manufactured domestically and/or imported into the country to provide adequate supplies of each chemical for estimated medical, scientific, research and industrial needs; licit export requirements; and establishment and maintenance of reserve stocks." (International Narcotics Control Board, "Issues that Governments may consider when determining annual legitimate requirements for ephedrine and pseudoephed-rine". Available from www.incb.org/incb/en/precursors/precursors/tools_and_kits.html.) [Back]
315. International Narcotics Control Board, Precursors Report, 2013, annex II. [Back]
317. United States Department of State, Bureau of International Narcotics and Law Enforcement Affairs, International Narcotics Control Strategy Report, vol. I (March 2013), chapter on "Chemical controls". See also the same report from previous years. [Back]
318. International Narcotics Control Board, Precursors Report, 2013 (and previous years). [Back]
319. Based on international trade data collected by the International Narcotics Control Board, the proportions during the 2007-2011 period amounted to 14 per cent for bulk ephedrine and 2 per cent for pseu-doephedrine (Precursors report, 2012, table 1). [Back]
320. UNODC, Patterns and Trends of Amphetamine-Type Stimulants and Other Drugs: Challenges for Asia and the Pacific, Global SMART Programme 2013. [Back]
321. International Narcotics Control Board, Precursors Report, 2013, para. 48. [Back]
322. In total, 24 countries reported licit requirements for P-2-P to the Board. (International Narcotics Control Board, Precursors Report, 2013, annex II.) [Back]
323. Based on international trade statistics collected by the Board, seizures of P-2-P were equivalent to 15 per cent of international trade, and phenylacetic acid equivalent to 11 per cent of international trade during the 2007-2011 period. (International Narcotics Control Board, Precursors Report, 2012, table 1.) [Back]
324. International Narcotics Control Board, Precursors Report, 2012, para. 76. [Back]
325. That terminology may have led to some misunderstandings, however, and thus resulted in erroneous classifications. [Back]
326. "Safrole-rich essential oils -- risk of illicit use", in Eastern Horizons (UNODC Regional Centre for East Asia and the Pacific, Summer-Autumn 2007), pp. 9-10. [Back]
327. Sergio Rocha and Lin Chau Ming, 1999, "Piper hispidinervum: a sustainable source of safrole" in Perspectives on new crops and new uses, J. Janick, ed. (American Society for Horticultural Science Press, Alexandria, VA, 1999), pp. 479-481. [Back]
328. UNODC, Amphetamines and Ecstasy: 2008 Global ATS Assessment (August 2008), p. 103. [Back]
329. Joint FAO-WHO Expert Committee on Food Additives, WHO Food Additives Series 16. Available from www.inchem.org/documents/jecfa/jecmono/v16je22.htm. [Back]
330. For more information, see http://micro.magnet.fsu.edu/primer/techniques/polarized/gallery/pages/heliotropinsmall.html. [Back]
331. Average annual imports of 1,726 tons of piperonal, 71 tons of isosaf-role, 40 tons of 3,4-MDP-2-P and 18 tons of safrole during the 2007-2011 period. This would amount to approximately 1,000 tons in 3,4-MDP-2-P equivalents. [Back]
332. The comparison made exaggerates the actual difference, as sassafras oil is not specifically reported in UN COMTRADE statistics. Nevertheless, excluding sassafras oil, the overall total based on International Narcotics Control Board statistics would have still been almost five times larger than shown in the UN COMTRADE statistics. This is mainly owing to differences in the reported trade in piperonal, which is much larger in the Board data and more than offsets the smaller numbers reported by the Board in the other categories. [Back]
333. The calculation shows a ratio of 0.85 per cent for the 2007-2012 period. Based on trade statistics of the International Narcotics Control Board, the proportion amounted to 0.15 per cent during the 2007-2011 period (see Precursors Report, 2012, table 1). [Back]
334. International Narcotics Control Board, Precursors Report, 2013, para. 75. [Back]
335. Global cocaine manufacture estimates amounted to between 1,024 and 1,064 tons for 2007, 865-1,122 tons for 2008, 842-1,110 tons for 2009, 788-1,060 tons for 2010, 776-1,051 tons for 2011 and 714-973 tons for 2012 (World Drug Report data). [Back]
336. Estimates by the International Narcotics Control Board arrived at an interception rate of between 12 and 25 per cent for the period 20072011 (International Narcotics Control Board, Precursors Report, 2012, para. 98). [Back]
337. World Drug Report data. [Back]
338. The estimate of 479 tons has been calculated as the average of annual heroin manufacture estimates, which are derived from annual opium production (686 tons of heroin in 2007, 600 tons in 2008, 427 tons in 2009, 383 tons in 2010, 467 tons in 2011 and 311 tons in 2012). While the annual heroin figures derived from opium production estimates may be incorrect for individual years as a result of the accumulation or depletion of opium stocks in such years, over a longer period of time such changes in stocks, in general, do not play much of a role. This suggests that the 2007-2012 average may be a good estimate for actual average annual heroin manufacture during that period. [Back]
339. According to International Narcotics Control Board data, between 1 and 2.5 litres of acetic anhydride are required for the manufacture of 1 kg of heroin (midpoint estimate of 1.75 litres). However, the bulk of the world's heroin is manufactured in Afghanistan and, according to UNODC studies, the amounts of acetic anhydride used in Afghanistan typically range from 1 to 1.5 litres for a kilogram of heroin (midpoint 1.25 litres). Afghanistan accounted for 83 per cent of the world's total opium production during the period 2007-2012. This gives a best estimate of about 1.34 litres of acetic anhydride per kilogram of heroin at the global level. The best estimate thus suggests that the heroin manufactured required some 642,000 litres of acetic anhydride. UNODC estimates are based on International Narcotics Control Board and World Drug Report data. [Back]
340. Not all seizures of acetic anhydride have been related to the manufacture of heroin. Acetic anhydride is also used in the conversion of phenylacetic acid to P-2-P, which is of particular importance in North America, where those precursors are then used to manufacture methamphetamine. The subsequent calculation of seizures of acetic anhydride was thus based on two scenarios: (a) all acetic anhydride seized was intended for use in the manufacture of heroin (seizures of 131,000 litres); and (b) all acetic anhydride seized in North America was for use in the manufacture of methamphetamine (remaining acetic anhydride seizures: 97,000 litres). The actual figure is most likely somewhere in between the two. [Back]
341. According to International Narcotics Control Board estimates, less than 17 per cent of globally diverted acetic anhydride was seized each year during the period 2007-2011 (International Narcotics Control Board, Precursors Report, 2012, para. 106). [Back]
342. United Kingdom, Home Office, Drug Misuse: Findings from the 2012 to 2013 Crime Survey for England and Wales (London, 2013). [Back]
343. Annual prevalence of LSD use among young adults (aged 15-34) fell in Ireland from 2.9 per cent in 1998 to 0.6 per cent during the period 2010-2011; in Latvia from 1 per cent in 2003 to 0.1 per cent in 2011; and in Hungary from 1.3 per cent in 2001 to 0.3 per cent in 2007 (European Monitoring Centre for Drugs and Drug Addiction, Statistical Bulletin 2013 (Lisbon, 2013)). [Back]
344. See Lloyd D. Johnston and others, Monitoring the Future National Survey Results on Drug Use: 1975-2013 -- 2013 Overview: Key Findings on Adolescent Drug Use (Ann Arbor, University of Michigan, 2014). [Back]
345. The correlation between annual prevalence and perceived availability of LSD turned out to be very strong during the 1996-2013 period, amounting to r = 0.93 (statistically significant at a = 0.01). The decline in perceived availability was much sharper than the decline in the perceived risk of harm during that period (see table 8). [Back]
346. Data from UN COMTRADE. [Back]
347. Andreas Plüddemann and others, Monitoring Alcohol and Drug Abuse Trends in South Africa, Proceedings of SACEADUReport Back Meetings: January-June 2002, Phase 12, October 2002 (Cape Town, South Africa, South African Community Epidemiology Network on Drug Use, 2002). [Back]
348. Siphokazi Dada and others, Monitoring Alcohol and Drug Abuse Treatment Admissions in South Africa: August 2012, Phase 31, July to December 2011 (and previous years) (Cape Town, South Africa, South African Community Epidemiology Network on Drug Use, 2012). [Back]
349. UNODC, data from the annual report questionnaires. [Back]
350. Data from UN COMTRADE. [Back]
351. International Narcotics Control Board, Precursors Report, 2013, para. 75. [Back]
352. Drug Misuse: Findings from the 2012 to 2013 Crime Survey for England and Wales. [Back]
353. European Monitoring Centre for Drugs and Drug Addiction, Statistical Bulletin 2013. [Back]
354. Data from UN COMTRADE. [Back]
355. UNODC, Global Smart Update 2012, vol. 7, March 2012, p. 4. [Back]
356. The export prices are calculated by dividing the global value of exports of acetic anhydride by global exports of the substance in kilograms; import prices are calculated by dividing the global value of imports of acetic anhydride by global imports of the substance in kilograms. [Back]
357. International Narcotics Control Board, Precursors Report, 2013. [Back]
358. UNODC, The Global Afghan Opium Trade, p. 147. [Back]
360. UNODC and Afghanistan, Ministry of Counter Narcotics, Afghanistan drug price monitoring monthly reports. [Back]
361. UNODC, The Global Afghan Opium Trade, p. 147. [Back]
362. United States Department of State, Bureau of International Narcotics and Law Enforcement Affairs, International Narcotics Control Strategy Report, vol. 1, Drug and Chemical Control (March 2009). [Back]
363. International Narcotics Control Board, Precursors Report, 2011. [Back]
364. International Narcotics Control Board, Precursors Report, 2013, para. 112. [Back]
365. UNODC, The Opium Economy in Afghanistan: An International Problem (New York 2003). [Back]
366. UNODC, The Global Afghan Opium Trade, p. 146. [Back]
367. UNODC and Ministry of Counter Narcotics of Afghanistan (December 2013). [Back]
368. In 2013, the UNODC annual opium survey estimated heroin manufacture in Afghanistan at between 350 and 490 tons, which would have resulted in a demand for acetic anhydride of between 525,000 and 735,000 litres. Given an average price of $221 per litre according to this report, the acetic anhydride market in Afghanistan can be estimated to have ranged from $116 to $162 million in 2013. (Estimates based on data from UNODC, Afghanistan: Opium Survey 2013.) [Back]
369. UNODC, The Opium Economy in Afghanistan, p. 139. [Back]
370. UNODC, The Global Afghan Opium Trade, p. 151 [Back]
371. UNODC, The Opium Economy in Afghanistan, p. 136. [Back]
372. UNODC, World Drug Report 2010, p. 138. [Back]
373. In total, 41 heroin samples were analysed in 2008 and 40 samples in 2007. In 2007, the tested heroin samples had a purity ranging from less than 1 per cent to 86 per cent; in 2008 the purities ranged from less than 1 per cent to 91 per cent. Data suggested that the purity of heroin was low in the south of Afghanistan. In contrast, high purity levels were reported in Kabul in both 2007 and 2008 and heroin purity levels were also quite high in the north in 2007 and in the east in 2008. [Back]
374. UNODC and Afghanistan, Forensic Laboratory of the Counter Narcotics Police of Afghanistan, "Laboratory Information Bulletin" (LIB/1/2011), p. 2. [Back]
375. International Narcotics Control Board, Precursors Report, 2011, para. 158. [Back]
376. In El Salvador and Guatemala, for instance, police investigated the operations of more than a dozen front companies, including companies involved in pesticides, clothes and furniture, that had been set up to smuggle precursor chemicals in large quantities from China into Central America in 2011 and 2012. The clandestine labs were apparently controlled by the Mexican Sinaloa cartel, and the final market for the methamphetamine was the United States. (Elyssa Pachico, "Investigations in El Salvador, Guatemala reveal thriving trade in precursor chemicals" (27 June 2012). Available from www.insightcrime.org.) [Back]
377. United States Department of State, Bureau for International Narcotics and Law Enforcement Affairs, International Narcotics Control Strategy Report (March 2013). [Back]
378. Food and Drug Administration, Ministry of Health and Welfare, Statistics Table for Seized Narcotics Drugs and Controlled Drugs in Taiwan. Available from www.fda.gov.tw/EN/download.aspx. [Back]
379. International Narcotics Control Board, Precursors Report, 2013, para. 33. [Back]
380. Over the years, the operators of clandestine laboratories have identified simple means for extracting pseudoephedrine from such preparations, e.g. by dissolving the tablets in isopropyl alcohol. (UNODC, Patterns and Trends of Amphetamine-Type Stimulants and other Drugs: Asia and the Pacific, 2011, p. 43.) [Back]
381. International Narcotics Control Board, Precursors Report, 2013, annex VI. [Back]
382. International Narcotics Control Board, Precursors Reports, 2012 and 2013. [Back]
383. International Narcotics Control Board, Precursors Report, 2012, figure XI. [Back]
385. International Narcotics Control Board, Precursors Report, 2014 and previous years. [Back]
386. International Narcotics Control Board, Precursors Report, 2013, para. 82. [Back]
387. UNODC, Global Smart Update 2012, vol. 7, March 2012, p. 5. [Back]
388. International Narcotics Control Board, Precursors Report, 2012, para. 88. [Back]
389. International Narcotics Control Board, Precursors Report, 2013, p. 80. [Back]
392. International Narcotics Control Board, Precursors Report, 2012 para. 89. [Back]
393. The Board sent an official communication to the UN Secretary-General to formally initiate procedures for the scheduling of APAAN in March 2013. The Secretary-General invited Member States to express their opinion. A total of 42 Governments responded to the questionnaire, which confirmed that there was practically no legitimate use of that substance for industry. On the basis of those responses, the Board submitted a recommendation to the Commission on Narcotic Drugs to include APAAN in Table I of the 1988 Convention, and the Commission approved that proposal in March 2014. [Back]
394. UNODC, Global Smart Update 2012, vol. 7, March 2012, pp. 5-6. [Back]
395. Contrary to the substances controlled under Schedule I of the 1961 Convention, where esters are automatically under international control. [Back]
396. International Narcotics Control Board, Precursors Report, 2011, para. 90. [Back]
397. Average annual phenylacetic acid seizures at the global level amounted to some 217 tons per year over the period 2007-2012, seizures of ephedrine amounted to some 29 tons and seizures of pseudoephed-rine to some 18 tons. [Back]
398. International Narcotics Control Board, Precursors Report, 2013 para. 91. [Back]
399. International Narcotics Control Board, Precursors Report, 2013 para. 70. [Back]
400. International Narcotics Control Board, Precursors Report, 2013, para. 93. [Back]
401. International Narcotics Control Board, Precursors Report, 2012, para. 92. [Back]
402. International Narcotics Control Board, Precursors Report, 2013, para. 92. [Back]
403. European Monitoring Centre for Drugs and Drug Addiction -- Trimbos instituut, Report by the Reitox National Focal Point The Netherlands Drug Situation 2012, p. 154 (and previous years). [Back]
404. UNODC, Global Smart Update, vol. 7, March 2012, pp. 4-5. [Back]
405. M. Collins and others, "Methyl 3-[3',4'-(methylenedioxy)phenyl]-2-methyl glycidate: an ecstasy precursor seized in Sydney, Australia", Journal of Forensic Sciences, vol. 52, No. 4 (July 2007), pp. 898-903. [Back]
406. International Narcotics Control Board, Precursors Report, 2010, para. 62. [Back]
407. UNODC, Global Smart Update, Volume 7, March 2012, pp. 4-5. [Back]
408. International Narcotics Control Board, Precursors Report, 2011, para. 99. [Back]
409. International Narcotics Control Board, Precursors Report, 2013, para. 89. [Back]
411. Global seizures in 2012: pseudoephedrine, 25 tons; ephedrine, 7 tons; P-2-P, 6,800 litres; phenylacetic acid, 2 tons; safrole, 2,000 litres; piperonal, 336 kg; 3,4-MDP-2-P, 228 litres; isosafrole, 10 litres (International Narcotics Control Board, Precursors Report, 2013, p. 81). [Back]
412. International Narcotics Control Board, Precursors Report, 2011, para. 95 [Back]
413. International Narcotics Control Board, Precursors Report, 2011, para. 95. [Back]
414. International Narcotics Control Board, Precursors Report, 2012, para. 93. [Back]
415. International Narcotics Control Board, Precursors Report, 2013, para. 90. [Back]
Informes sobre corrupción y crimen organizado
 | This document has been published on 11May15 by the Equipo Nizkor and Derechos Human Rights. In accordance with Title 17 U.S.C. Section 107, this material is distributed without profit to those who have expressed a prior interest in receiving the included information for research and educational purposes. |