| Information |  | |
Derechos | Equipo Nizkor
| ||
| Information | | |
Derechos | Equipo Nizkor
| ||
09Jan15
China's Mineral Industry and U.S. Access to Strategic and Critical Minerals:
Issues for Congress
Contents
Resources and Reserves
Supply of and Demand for Raw Materials in ChinaSupply
China's Imports of Strategic and Critical Minerals
Demand
Role of the State-Owned Enterprises
U.S. Imports of Strategic and Critical Raw Materials
Reports by the National Research Council (NRC), the Massachusetts Institute of Technology (MIT), and the Department of Energy (DOE)
U.S. Mineral Policy
Potential U.S. Production and Minerals on Federal LandResearch and Development
USGS Assessment
Minerals Information Administration
Greater Exploration for Critical Minerals
Other OptionsFigures
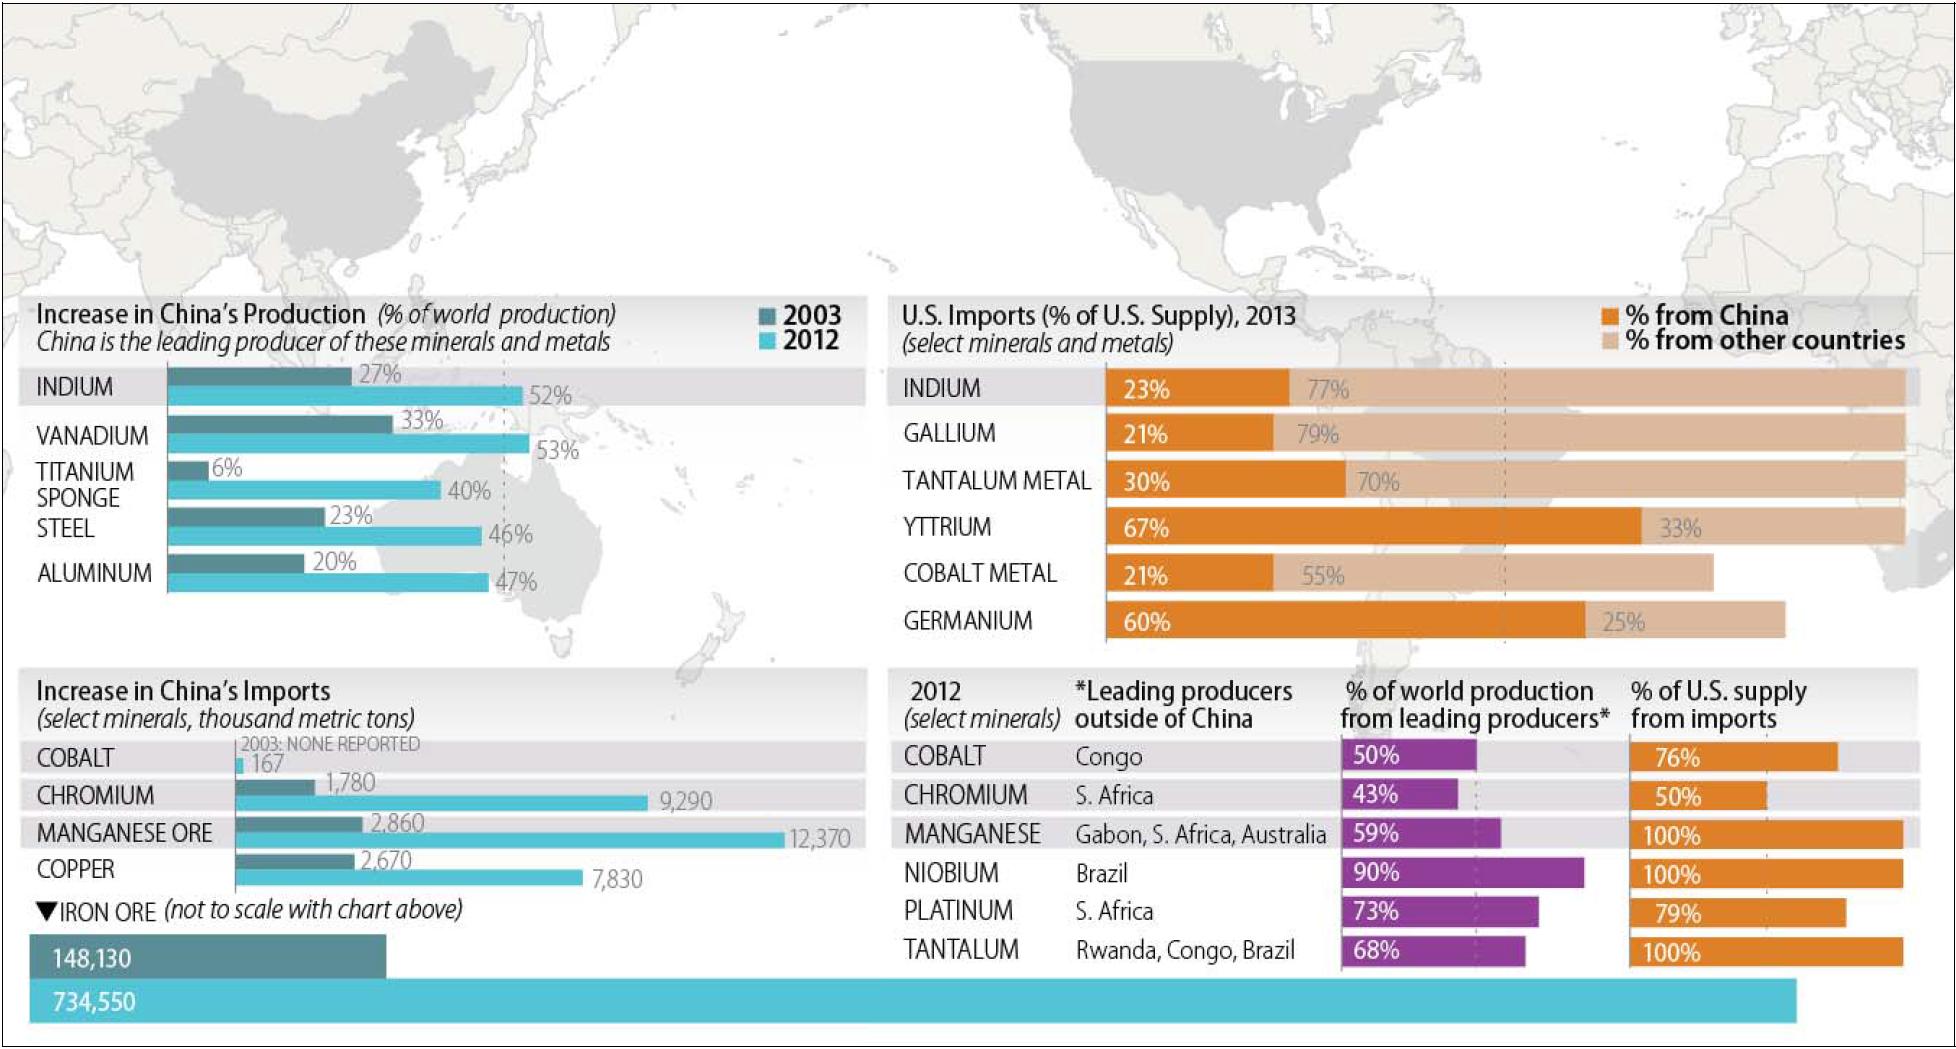
Figure 1. Production and Import of Select Minerals and Metals
Tables
Table 1. Reserve Growth of Selected Minerals/Metals 1993-2012
Table 2. Selected Mineral Production in China, 2003 and 2012
Table 3. China Demand for Selected Metals/Minerals, 2003 and 2010
Table 4. China Raw Material Imports, 2003-2012
Table 5. U.S. Mineral Import Dependence from China, 2013
Table 6. U.S. Mineral Import Dependence Outside ChinaAppendixes
Appendix A. Selected Minerals Major Applications
Appendix B. Selected Critical Minerals-Related Legislation in the 113th Congress
Appendix C. 2013 U.S. Net Import Reliance
Summary
China is the world's leading producer and consumer of many minerals and metals that are in high demand in the United States and on which the United States is highly import dependent. In the near future, China anticipates rapid urbanization, a rising middle class, and increased product manufacturing of high-value, high-quality goods and increased consumption. As China pursues this development path, will adequate supplies of critical and strategic raw materials and metals be available to the U.S. economy from reliable suppliers? Is there a possibility of material shortfalls? If China uses more of its raw materials and metals for its own downstream manufacturing sector instead of exporting them, as well as competing for raw materials and metals from outside China, then there may be a cause for concern. Materials such as the platinum group metals (PGMs), niobium, tantalum, manganese, and cobalt are heavily imported by the United States and China. Over the past several years there has been some concern in Congress that China was trying to "lock up" long term supplies of raw materials, particularly iron ore. Long-term contracts have been established for some imports, but for others, Chinese companies have made equity investments or entered joint ventures in order to secure needed resources.
China is a relative newcomer to the global mining stage, but in recent years, under its "go global" policy, China has become much more aggressive in pursuing raw materials from all over the world. The mining industry in China consists of many small and fragmented companies. China's government seeks to consolidate its mining industry, eliminating obsolete and inefficient capacity, and has announced specific consolidation goals for certain sectors.
Aside from a small amount of recycling, the United States is 100% import reliant on 19 minerals that provide critical support for the U.S. economy and national security. The United States has diversified sources for some of its material requirements over the past several years, but still imports significant quantities and has become more dependent on China as either a primary or major provider of raw materials and several metals since 1993. China's dominance in the supply and demand of global raw materials could be addressed, if needed, through consistent development of alternate sources of supply, alternative materials (substitutes) when possible, efficiency gains, aggressive R&D, and comprehensive minerals information to support this effort.
There may not be an immediate crisis, but China is likely entering an era of fewer raw material exports over the long run, which requires some type of long-term planning by the private sector and government entities that want to meet U.S. national security, economic, and energy policy interests and challenges. Congress is likely to keep an eye on free trade issues, such as export restrictions on rare earth oxides and other raw materials, which were brought before the World Trade Organization by the United States, Europe, and Japan and won against China.
Legislation aimed at domestic mineral production was considered in the 113th Congress. H.R. 761, introduced by Representative Mark E. Amodei, passed the House by 246-178 on September 18, 2013. The bill would have defined critical and strategic minerals and sought to streamline the federal permitting process for domestic mineral exploration and development. There were hearings held on S. 1600, the Critical Minerals Policy Act of 2013, introduced by Senator Lisa Murkowski. The bill would have defined what critical minerals are, established analytical and forecasting capability on mineral/metal market dynamics as part of U.S. mineral policy, and required that the Secretary of the Interior direct a comprehensive resource assessment of critical mineral potential in the United States, including the critical mineral potential on federal lands.
China is in a new era of development and is at a crossroads with its economic development plans and its newly announced commitment to consolidate the minerals industry. China is the world's leading producer and consumer of many minerals and metals that are in high demand in the United States and China and upon which the United States is highly import dependent. China's current, 12th Five-Year Plan (2011-2015) and successive five-year plans anticipate rapid urbanization, a rising middle class, and increased product manufacturing of high-value, high-quality goods and increased consumption. With China's potential economic growth and heavy U.S. reliance on imported raw materials, will adequate supplies of critical and strategic raw materials and metals be available to the U.S. economy from reliable suppliers? Is there a possibility of material shortfalls? If China uses more of its raw materials and metals for its own downstream manufacturing sector instead of exporting them, as well as competing for raw materials and metals from outside China, then there may be a cause for concern. Materials such as the platinum group metals (PGMs), niobium, tantalum, manganese, and cobalt are heavily imported by the United States and China. Most of the minerals and metals discussed in this report have been classified by the Department of Defense (DOD) as strategic minerals, while others are classified by the Department of Energy (DOE) as critical. Many of these materials are used in building defense systems while others are required for new energy technologies.
Many Chinese leaders have acknowledged that double-digit economic growth is unsustainable. Over the next five years, China is planning a more sustainable growth rate in its gross domestic product (GDP) of about 7%-8% annually. New economic reforms that will generally lead to more market-based decision making are underway, according to China's Third Plenum. |1| The slowing of China's economy and less construction has resulted in less demand, overcapacity, and lower prices for many raw materials, particularly steel and steel-making materials (e.g., iron ore, chromium, and manganese). The economic slowdown in China has implications for the global economy, particularly those countries and companies that export raw materials to China (e.g., Brazil, Australia, and South Africa). Because of weak domestic demand for steel and subsequent falling prices, Chinese steel producers are exporting more high-valued steel products to other parts of Asia. Prices in general could rebound once excess production capacity is eliminated and high-cost producers discontinue operations or are merged with large-scale operations.
The mining industry in China consists of many small and fragmented companies. China's national government seeks to consolidate its mining industry, eliminating obsolete and inefficient capacity, and has announced specific consolidation goals for certain sectors. |2| Chinese consolidation plans intend to address energy efficiency along with air and water pollution concerns. The Chinese government has closed some obsolete iron ore smelting plants and mines around Beijing because of their negative impact on air quality. It also has begun to implement longer-term plans to improve the quality of the environment. The mining and metals industry is generally seeking technology upgrades that are more efficient and less polluting.
Eliminating excess capacity will be the mining sector's biggest challenge, said Gu Zangqin, Head of the China National Petroleum and Chemical Planning Institute. Gu argues that China's move to more urbanization, a growing middle class, and industrialization will likely continue to drive up demand for raw materials and consumer products in the long run. One vice president, however, argued that overcapacity is not the biggest challenge, but rather innovation and sustainability. He stated further that China's industrialization and urbanization will bring opportunities, but government and consumers should focus on sustainability of raw materials used in the entire supply chain. |3|
In a recent InvestorIntel article, Jack Lifton, a metals analyst, concurs with a good part of the analysis by Gu stated above. Lifton acknowledges that there is already significant raw material industry restructuring taking place now, and he concludes that more changes, that is, consolidations, are likely for the raw materials sector in the 13th Five Year Plan. Lifton reports that in 2014, China consumed 60% of the world's metals supply of all types and that China consumes as much as 80% of the world supply of various high-tech metals (e.g., rare earth elements, yttrium). |4| Lifton reiterated that China's push is to manufacture more of the high-value consumer goods (e.g., electronics, appliances, and autos) as well as the intermediate materials and parts that are required to make them. Under this consumption-driven model, domestic consumption of parts, intermediate goods, and finished goods would accelerate. Having access to raw materials needed to sustain the emerging phase of the Chinese economy is still most important and will "underpin the growth of the high-tech manufacturing economy so that Chinese domestic consumption can grow," according to Lifton. The quality of goods produced and sold in China is an important factor for the rising middle class and generally important for its more recent consumption-driven economic model. |5|
The Chinese government announced plans for a more aggressive approach in its "go global" campaign designed to secure raw materials. The government policy to "go global" was established in 1999 but was not fully implemented until around 2002-2003. It articulated three main objectives: (1) to support national exports and expand into international markets; (2) to push domestic firms to internationalize their activities as a means of acquiring advanced technologies; and (3) to invest in the acquisition of strategic resources. |6| Concern by the Communist Party of China (CPC) over "resource security" has increased during the past few years, which led to more outbound direct investment (ODI) in the mining sector as a policy to secure access to raw materials. Even as China's economy slows, the Chinese are positioning themselves more aggressively through their "go global" policy and continue to secure access to raw materials needed for sustained economic development. In some instances, lower-cost imports may be cheaper than producing high-cost domestic materials.
The official goal of China, and part of its "go global" strategy, according to the Ministry of Commerce, is to invest another $390 billion in ODI over the next five years. Outbound direct investment in mining projects reached $106 billion at the end of 2013, accounting for 16% of China's overall ODI, |7| according to reports discussed in the China Daily. |8| Most of China's resource imports are purchased from corporations not owned by the Chinese, but there are some equity investments in the raw materials and metals sectors.
A recent study by the Council on Foreign Relations (CFR) concluded that China's demand for resources will not slow anytime soon. According to the authors of the CFR study, "Leaders will need to take steps to respond as the world is transformed by China's growing presence and pursuit of natural resources." |9| Further, they argue, there is the possibility that "Chinese companies will control larger amounts of natural resource production overseas and possibly impose a more rigid trading arrangement, possibly slowing the world's response to supply disruptions." And because of the emergence of market-based investment decisions in China, and a consumption-driven economy, the next 20 years will very likely not look like the previous 20.
Many on Capitol Hill express a deep sense of skepticism and are not convinced that China's leaders are taking sufficient measures to address economic reforms or quality of life issues such as environmental pollution. In recent years, primarily because of China's raw material export policies (e.g., export restrictions and new export licensing requirements on rare earth elements, particularly the HREEs) there has been heightened congressional and executive branch interest in seeking legislative options that would facilitate continued U.S. access to reliable mineral supplies. |10|
This report will examine China's position in the global mineral and metal markets; its growth in mineral reserves; the growth of supply, demand, and imports; and the role of China's state-owned enterprises (SOEs). The report takes a look at U.S. mineral import dependence, U.S. import dependence on China, and selected policy options. There are Appendices on mineral end-use applications, and selected critical minerals legislation in the 113th Congress.
China's reserves in several mineral commodities have grown significantly (see Table 1). Large-scale refining and production facilities of aluminum, tantalum, and cobalt have been installed over the past 20 years in China. Over the past 20 years, selected mineral reserves grew in China at a faster pace than world reserves and refining capacity. Chinese firms continue to explore for, and discover, minerals inside China. For example, the Hunan Geology and Mineral Exploration and Development Bureau announced discoveries of zinc, lead, copper, and silver in Hunan province in 2014. |11| Major copper discoveries were made in both the Uygun and the Xizang Autonomous Regions. The Mining Engineering Annual Exploration Review indicates that China accounted for about 4% of the global exploration budget in 2013. This, however, is much lower than other countries such as Canada and Australia, accounting for about 13% and 14% of the global exploration budget respectively. |12| In terms of spending for major exploration projects, Canada and Australia have the most active exploration sites (22% and 21% respectively). Over the last 10 years, most countries' total exploration budgets peaked in 2012 then dropped significantly in 2013. |13| When it comes to new mining projects, Canada and Australia rank the highest with 400 each, the EU with 200, while China ranks 4th at 120.
For economic development to be successful under China's policy to "go global," investments were made in China and abroad in both raw material exploration and production, metal refining, and smelting capacity.
Supply of and Demand for Raw Materials in China
China's pace of economic growth has been aggressive; its supply of, and demand for, raw materials has grown faster than its overall economy over the past 20 years. There was a 20% annual average increase in the demand for copper, steel, and aluminum over this time period. Overall, imports for copper concentrate and iron ore increased by 300% and 500%, respectively. From 2005-2010, China accounted for more than 80% of the rise in global demand for metals and metal products. In order to support its rapid rise of urbanization, China produced 717 million metric tons (mt) of steel in 2013, up from 220 million mt in 2003, requiring record levels of domestic iron ore production and iron ore imports.
Table 1. Reserve Growth of Selected Minerals/Metals 1993-2012
metric tons (unless otherwise indicated)
Material 1993 Percent of World Total 2012 Percent of World Total Copper 3,000,000 1 30,000,000 4 Illmenite 30,000,000 11 200,000,000 29 Lithium Not Listed Not Listed 3,500,000 27 Manganese 14,000,000 2 44,000,000 8 Molybdenum 500,000 9 4,300,000 39 Vanadium 2,000,000 20 5,100,000 36 Zinc 5,000,000 4 43,000,000 17 Refined Metal Aluminum Not Listed Not Listed 26,900,000 47 Source: USGS, Mineral Commodity Summaries, 1995, 2013, and 2014.
According to 2012 U.S. Geological Survey (USGS) data, China ranked as the number one producer of several minerals and metals, including all those listed in Table 2 (except lithium and manganese). The USGS data show a rapid surge of production over the past 10 years in iron ore and copper, both of which China also heavily imports. China's copper production doubled while iron ore production increased five-fold since 2003. China's gains in production far outpaced the rest of the world. By 2003, China had already dominated in the production of cement, graphite, indium, magnesium compounds, magnesium metal, rare earth elements (REEs), silicon, tungsten, vanadium, and yttrium, but in 2012 China solidified its number one producing status of these minerals, producing more than 50% of the world's total. While there are no single monopoly producers in China, as a nation, China is a near-monopoly producer of rare earth elements (90%) and yttrium (99%).
Many of these raw materials (e.g., manganese, molybdenum, and vanadium) are used for steel-making and infrastructure projects, such as roads, housing, rail lines, and electric power grids. Others (e.g., REEs, lithium, indium, tantalum, gallium, and germanium) are used in the manufacturing of high-value electronic products, such as cell phones, laptops, batteries, renewable energy systems, and of other goods, such as automobiles and appliances. (See Appendix A for more details on mineral applications.)
Analyst L. Song describes China's current phase of development as the "mid-phase of industrialization," which is more mineral and energy-intensive than the previous labor-intensive phase. Mid-phase development is noted by the higher proportion of manufacturing and high share of heavy industries, such as high-end steel production, and automobile manufacturing. China is currently the leading automobile producer in the world. Production inputs, such as steel and aluminum, play a major role. However, the rapid surge in production is not likely to be repeated in the next 10 years, due to slower growth, but a continuing increase in production and imports of raw materials is still anticipated.
Table 2. Selected Mineral Production in China, 2003 and 2012
(in metric tons, unless indicated)
Mineral 2003 Percent
of World Total2012 Percent
of World TotalAluminum 5,450,000 20 20,300,000 44 Cement 813,000,000 42 2,210,000,000 58 Germanium NA small 90,000 kg 70 Graphite 450,000 61 800,000 68 Indium 100 27 405 52 Iron ore 261,000,000 23 1,310,000,000 45 Lithium 2,500 17 4,500 13 Magnesium compounds 1,070,000 31 4,600,000 72 Magnesium metal 340,000 67 698,000 87 Manganese 800,000 10 2,900,000 18 Molybdenum 30,600 24 104,000 40 Rare earths 92,000 93 100,000 91 Silicon 1,970,000 44 5,050,000 65 Steel 220,000,000 23 717,000,000 46 Titanium sponge 4,100 6 80,000 40 Tungsten 52,000 84 64,000 85 Vanadium 13,200 33 39,000 53 Yttrium 2,300 almost 100 7,000 almost 100 Zinc 1,650,000 18 4,900,000 36 Source: USGS, Mineral Commodity Summaries, 2005 and 2014.
Notes: Indium is produced primarily in China as a by-product of zinc smelting. Data on primary production of indium are not available but the USGS reports that China holds the vast majority of the world's indium reserves. China is also the number one producer of tantalum metal, but exact data is unavailable.During this anticipated slower growth period, major iron ore producers outside China have announced capacity expansions that are coming soon, while many small and old (high cost and low value) iron ore mines in China are being closed. China will likely continue to shut down high-cost, inefficient domestic production capacity. |14|
China's demand for natural resources rose to historic levels and will likely continue to rise over the long term. Because of China's expanding middle class, many believe that China is not even close to its market saturation point for consumer goods. Ongoing urbanization, that is the building of new mega-cities and the expansion of the high-tech industry, will drive demand for industrial metals, base metals, and also high-tech metals such as lithium, indium, tellurium, cobalt, and REEs. In order for this increasing demand scenario to play out, the cities would need to fill up with enough people who are making high enough wages to support the economic growth that China is seeking. It is uncertain whether such a high level of consumer demand will materialize.
Table 3 highlights the surge in demand of aluminum, zinc, and copper from 2003 to 2010. China's demand more than doubled during that time period and nearly doubled as a percent of global demand. |15| China has also been the fastest growing market for niobium and in 2010 accounted for 25% of world consumption. |16| Manganese consumption rose from about 2,200 metric tons (mt) in 2003 to about 9,000 mt in 2008. |17| China's demand for vanadium paralleled that of steel demand and rose 13% annually from 2003 to 2009. In general, vanadium demand is projected to double from 2010 to 2025 because of its continued use in steelmaking and because of the potential for application in new battery technology used for renewable energy storage (e.g., lithium-vanadium-phosphate batteries). |18| In 2010, China accounted for 85% of chrome ore import demand |19| and is currently the world's leading producer of stainless steel, for which chrome is a major production input. Chrome imports will likely continue to increase as stainless steel demand at the global level remains a big part of China's high-valued exports, urbanization, and future industrial practices. Current indium consumption data are not readily available, but China's consumption of indium nearly doubled in one year, from about 40 tons in 2009 to75 tons in 2010, because of its increased use in electronics that contain LCDs and in LED lighting. |20|
Table 3. China Demand for Selected Metals/Minerals, 2003 and 2010
thousand metric tons (% of world total)
Commodity 2003 2010 Aluminum 5,177.6 (18.5) 12,412.5 (34.5) Copper 3,083.7 (20) 7,418.6 (39) Zinc 2,003.5 (21) 5,305.6 (43) Source: World Metals Statistics Yearbook, 2011.
It was reported in 2009 that China accounted for about 25% of the world's cobalt demand. Refined cobalt is used with lithium for cell phone batteries. Overall, in 2012, 67% of cobalt demand in China went into batteries. In 2010, China accounted for about 25% of platinum demand and 20% of palladium demand, much of which is used in catalytic converters in automobiles.
China's Imports of Strategic and Critical Minerals
China is also the world's leading importer of copper, iron ore, chromium, manganese, cobalt, tantalum, niobium, PGMs, and lithium. Over the past several years there has been some concern in Congress that China was trying to "lock up" long term supplies of raw materials, particularly iron ore. Long-term contracts have been established for some imports, but for others, Chinese companies have made equity investments or entered joint ventures in order to secure needed resources. An article in China Daily reported that China's iron ore imports may rise from 900 million metric tons (mt) in 2014 and grow to 1 billion mt in 2015 because of consistently high steel production. |21| China may have produced as much as 820 million mt of steel in 2014, including about 110 million mt for a growing export market in other parts of Asia. Rio Tinto (a U.K.-based mining firm) is reported to be expanding its iron ore capacity from 290 million mt to 360 million mt by June 2015 despite lower prices. |22| China will likely continue to import high volumes of lower cost iron ore, replacing its higher cost, lower quality domestic production.
China imports most of its iron ore from Australia and because of China's huge increase in demand in the past decade, prices rose from $12.81/mt in 2001 to $187.18/mt in 2011. China has a relatively small investment in Chile but it accounts for about 25% of Chile's exports in value-- primarily copper. Table 4 shows the enormous increase in imports over the 10-year period 2003-2012.
Table 4. China Raw Material Imports, 2003-2012
(in metric tons)
Commodity 2003 2012 Bauxite none reported 39,638,000 Chromium 1,780,000 9,290,000 Cobalt none reported 166,500 Copper 2,670,000 7,830,000 Iron Ore 148,130,000 743,550,000 Manganese Ore 2,860,000 12,370,000 Nickel Ore 8,400 65,000,000 Source: USGS, Minerals Yearbook Volume III, China Chapter.
Mining is an area long-dominated by European, North American (United States and Canada), and Australian multinational corporations. China is a relative newcomer to the global mining stage, but in recent years, under its "go global" policy, China has become much more aggressive in pursuing raw materials from all over the world.
Role of the State-Owned Enterprises
The Communist Party of China (CPC) has tremendous control over the nation's State- Owned Enterprises (SOEs). Top SOE officials are often appointed by the CPC and may also be appointed to top party posts. The SOEs typically align themselves with the five-year plan and national objectives, but as others see it, the objectives within China are changing and some SOEs are beginning to practice more market-based decision making. New economic reforms, articulated in the Third Plenum, would increase private shareholdings in the nation's SOEs. Over the past several decades, SOEs have been important in generating revenues for the CPC and the government.
China's mineral and metal producing sector is heavily dominated by SOEs. There are still many small-scale operators organized at the provincial level. Some analysts suggest that the Central government edicts are not always heeded by the provincial officials as their concerns may be to meet revenue goals and provide local jobs, while the Central government is promoting larger scale, more efficient, and less polluting operations.
This new national policy often requires that the smaller local SOEs be merged into a larger conglomerate. There are government policy guidelines supporting industrial mergers with the objective to reduce production and transportation costs, upgrade technology, and use energy more efficiently. The government encouraged SOEs to diversify their business practices and invest in non-core business areas (e.g., the Aluminum Corporation of China has invested in rare earth mining and processing). The National Development Reform Commission (NDRC) and the Ministry of Land and Resources approved a plan for 15 mineral commodities as part of the government policy guidelines for mergers and acquisitions. In that plan, small mines would be integrated into larger operations. The NDRC has the authority to approve all major investment projects to improve the efficiency of investment.
The Chinese government has proposed that rare earth producers be merged into six firms: Boatang Group (Baotou Steel and Rare Earth), Chinalco (Chalco Rare Earth), Minmetals Rare Earth, Ganzho Group, Fujian, and Guandong Rising Non Ferrous Metals. Iron and steel consolidations would likely involve the large players such as the Baogang Group, Hebei Iron and Steel Group, Tangshan Iron and Steel, and the Ashan Iron and Steel Group. Chinalco is a dominant firm in the aluminum and alumina sectors. Other major players in aluminum include China Power and Investment Group and the Xinjiang Nongliushi Aluminum Company, Ltd. |23|
The Central government's position to restrict expansion of some mining operations is not always taken well at the provincial level, where production and revenue goals are major drivers. And to the detriment of smaller operations, since 2012, new government regulations spell out minimum levels of production capacity. For iron ore, it's 1 million metric tons annually; for specialty steel, it's 300,000 mt annually. The government's policy would restrict overall production capacity in energy-intensive industries such as aluminum, steel and cement, and may require possible capacity reductions. However, many of the small SOEs have continued high levels of production to increase revenues. A new regulation for the iron and steel industry is that they cannot use obsolete technology and their energy and water uses per ton of production are regulated.
A common critique of the SOEs is that they possess too much market power, and can thus determine prices and earn enormous profits. China can also create barriers to entry by deciding who gets access to capital from its state-owned banks. The number of SOEs is getting smaller, but the average size of the firms is getting larger and more powerful. Many of the state-owned firms fall under the State Owned Assets Supervisor and Administration Commission (SOASAC), which owns or has controlling shares in over 100 SOEs. There has been a corporatization of SOEs. This reform has reorganized SOEs into limited liability corporations (LLC) or joint-stock companies. State-owned, shareholding companies account for 60% of state firms and 70% of industrial output.
China created the SOASAC with the idea to turn some of the SOEs into "national champions." In 2007, new industrial policies were created that provided large SOEs an advantage over their smaller domestic and foreign competitors. More SOEs are motivated by profit now, but still incentivized by state government actions through its "go global" policy.
Many SOEs are taking equity positions (which are supported by national policies) in resource companies abroad. The CFR reports that 37% of Chinese mining companies involved in foreign projects are state-owned. In 2011, former PRC President Hu Jintao said, "In the next five years China will make great efforts to pursue the strategy to go global and we will encourage enterprises of different structures to invest overseas." |24| China offers three types of assistance to foreign countries for doing business with China: grants, low-cost loans (interest free loans), and concessional loans. |25| There is an ongoing strategy to invest in overseas mineral projects to protect against "resource bottlenecks." The Bank of China provided $70 billion in loans in 2011 for foreign mineral acquisition. Australia is the top destination for Chinese mining investment dollars--mostly for iron ore. Sub-Saharan Africa and Mongolia are getting Chinese attention. In one example of the government's "go global" strategy, the Jinchuan Group International Resources Co., an SOE and the largest cobalt producer in China, is a vertically integrated company that recently acquired Meet Reese of South Africa. This merger added significant reserves and resources to the company's portfolio. Chinese companies, particularly SOEs, are being scrutinized more by host countries (especially in developed countries), particularly in terms of corporate governance (basically, how these mining firms are carrying out their operations overseas).
In a recent book, Markets over Mao, Nick Lardy suggests that there is little support for an increased role of the SOE and that the future will be market-driven with less state intervention. Lardy concluded that SOASAC firms did not perform better or keep up with China's growth in GDP and that size did not matter (e.g., the size of the merger and acquisition did not result in better financial performance). |26| He also argues that the SOASAC model has not been very efficient nor was it good at producing national champions and "... the private firms have become the major source of economic growth.... " In a separate Wall Street Journal interview, Nick Lardy said, "China would get a big lift if they opened up certain sectors (e.g., oil and gas) to competition which are now dominated by SOEs." |27| This prospect may be unlikely under the current Chinese leadership.
U.S. Imports of Strategic and Critical Raw Materials |28|
The United States has increased its mineral imports from China over the past 20 years. The United States has diversified its sources for some of its material requirements since 1993, but still imports significant quantities and became more dependent on China as either a primary or major provider of raw materials and several metals by 2013 (See Table 5). Aside from a small amount of recycling, the United States is 100% import reliant on 19 minerals that provide critical support for the U.S. economy and national security (see Appendix C). The United States is more than 75% import reliant on several other minerals, including cobalt, titanium concentrate, germanium, and the platinum group metals.
While import reliance may be a cause for concern and high levels of import reliance potentially a security risk, high import reliance is not necessarily the best measure, or even a good measure, of supply risk. A more important measure may be the reliability of the suppliers. The supply risk for bauxite, for example, may not be the same as that for REEs due to the multiplicity of potential sources. There are a number of factors that affect the availability of mineral supplies that may have little to do with import reliance. A company that is the sole supplier, or a single country as a primary source, with export restrictions, would likely constitute supply risks. But any number of bottlenecks that might arise among both domestic and foreign producers, such as limited electric power, skilled labor shortages, equipment shortages, labor unrest, weather or transportation delays, and opposition on environmental policy grounds, could also pose supply risks. Any of these above-mentioned potential supply disruptions could raise costs or prices, and exacerbate the tightness of supplies. For other minerals, such as iron ore and molybdenum, the United States is self-sufficient. For refined aluminum, zinc, and uranium, the United States' chief trading partner is Canada, a stable ally. Also, U.S. companies have invested in overseas operations--e.g., copper and bauxite mines--and, thus, U.S. supply sources for some materials are diversified, of higher quality, or lower cost, and located in countries that have extensive reserves and production capacity.
Reports by the National Research Council (NRC), the Massachusetts Institute of Technology (MIT), and the Department of Energy (DOE)
A 2008 National Research Council (NRC) report on minerals critical to the U.S. economy states that "most critical minerals are both essential in use (difficult to substitute for) and prone to supply restrictions." |29| The NRC report is based on several availability criteria (e.g., geological, technical, environmental and social, political, and economic) used to rank minerals for criticality.
The NRC produced a criticality matrix which has been used as a framework for analysis to determine whether selected minerals are critical to the U.S. economy. Out of 11 minerals assessed, indium, manganese, niobium, PGMs, and REEs were ranked critical, and assessed at a high supply risk with the possibility of severe impacts if supplies were restricted. |30| Among the REE applications, some were viewed as more important than others and some are at greater risk than others, namely the heavy rare earth elements (HREEs), as substitutes are unavailable or not as effective. |31|
MIT examined supply and demand of a list of minerals, which it deemed critical to renewable energy-related systems, electric vehicles, and automobiles in general (and required in many high-valued consumer products). The MIT study referred to these as energy critical elements (ECE). The list is meant to be illustrative and not definitive and includes germanium, indium, tellurium, REEs, yttrium, lithium, PGMs, and cobalt.
A DOE report published in 2011 also examined materials important for wind turbines, electric vehicles, photovoltaic thin films, and energy-efficient lighting. |32| Five of the REEs (including yttrium) were considered to be critical by DOE, while others (e.g., cerium, lanthanum, indium, tellurium, and lithium) were ranked "near-critical" in the short or medium term. Cobalt, gallium, manganese, and nickel were ranked not critical by DOE, in the short or medium term. |33|
There are additional minerals and metals that do not come from China and for which both the United States and China are highly import dependent (see Table 6). The United States and China import these minerals from southern Africa, Australia, South America, and Canada. Mine production of cobalt, platinum, chromite, tantalum, and manganese occur primarily in southern Africa, significant rutile (for titanium) production occurs in Australia and southern Africa, while niobium production occurs primarily in Brazil and Canada.
Even though China has become the primary source or a major source of certain mineral and metal imports by the United States over the past 20 years, there appear to be sufficient reserves from several other countries; thus, there may be alternate sources for some of these materials if supply issues arise from China. While there may be adequate supplies overall in the short and medium terms, according to studies by the DOE and the NRC, a more important question may be who controls the supplies (i.e., reserves, production facilities, and stockpiles). Below are minerals (listed in Table 5 and Table 6) to keep a close watch on as competition for supplies around the world could heat up during an upturn in the global economy.
Table 5. U.S. Mineral Import Dependence from China, 2013
Minerala Percent
Import DependentPercent Imported
from ChinaIndium 100 23 Gallium 100 21 Yttrium 100 67 Graphite 100 48 Tantalum metal 100 30 Scandium 100 near 100 Vanadium Pentoxide 100 15 Germanium 85 60 Cobalt metal 76 21 Silicon 72 NA Magnesium compounds 47 56 Titanium metal 45 10 Tungsten 41 45 Tellurium NA 23 Source: USGS, Mineral Commodity Summaries, 2014.
a. USGS no longer reports imports dependence for rare earth oxides because of insufficient data. A few years earlier, before Molycorp, Inc. reopened its Mountain Pass mine, USGS listed rare earth oxides asl00% import dependent.
Table 6. U.S. Mineral Import Dependence Outside China
Mineral Percent
Import DependentPrimary Sources Comments Manganese 100 South Africa Vanadium 100 China, Southern Africa, Russia Tantalum 100 Southern Africa, Brazil China is the leading producer of tantalum metal Niobium 100 Brazil, Canada PGMs (platinum) 79 South Africa Cobalt 76 Southern Africa China is leading producer of cobalt metal Titanium Mineral Concentrate (rutile) 79 Southern Africa, Brazil Chromium 50 Southern Africa, Russia Source: USGS Mineral Commodity Summaries, 20l4.
The current goal of U.S. mineral policy is to promote an adequate, stable, and reliable supply of materials for U.S. national security, economic well-being, and industrial production. U.S. mineral policy emphasizes developing domestic supplies of critical materials and encourages the domestic private sector to produce and process those materials. |34| But some raw materials do not exist in economic quantities in the United States, and processing, manufacturing, and other downstream ventures in the United States may not be cost competitive with facilities in other regions of the world. However, there may be public policies enacted or executive branch measures taken to offset the U.S. disadvantage of its potentially higher-cost operations. The private sector also may achieve lower-cost operations with technology breakthroughs. Based on this policy framework, Congress has held numerous legislative hearings on the impact of the U.S. economy's high import-reliance on many critical materials and on a range of potential federal investments that would support the development of increased domestic production and production from reliable suppliers. There has been a long-term policy interest in mineral import reliance and its impact on national security and the U.S. economy.
Potential U.S. Production and Minerals on Federal Land
Mineral exploration spending in the United States has been consistently around 7%-8% of the global total exploration budget over the past 10 years. The vast majority of exploration spending is for gold and copper resources. But the value of U.S. mineral production has more than doubled over the past 10 years because of record high prices for many commodities. Production volumes were only slightly higher for some (e.g., copper and zinc) while slightly lower for others (e.g., silver and gold). U.S. aluminum production declined by 25%, but molybdenum production nearly doubled. Most minerals listed on the USGS import reliance chart |35| are locatable on public lands, and of the 19 minerals listed as 100% import dependent, the USGS lists nine as having either a small amount of domestic production or some reserves. |36| There is uncertainty over how much production of these highly import-dependent minerals occurs on public lands. More information is needed on minerals located on federal lands and alternative sources of supply on federal lands and lands outside the United States, showing short and long term potential of development.
Current information is not available from the Department of the Interior (DOI). The Government Accountability Office (GAO) noted in a July 21, 2008, report that the DOI does not have the authority to collect information from mine operators on the amount of hard rock minerals produced or the amount of reserves on public lands and there is no requirement for operators to report production information to the federal government. |37|
However, previous DOI |38| and GAO |39| reports completed in the early 1990s reported that gold, copper, silver, molybdenum, and lead were the five dominant minerals produced on federal lands under the 1872 Mining Law. Currently, the vast majority of mining activity on federal lands is for gold, based on past Department of Interior information. According to the latest data published by the DOI, gold accounted for 88% of the total dollar value of hardrock (base metals and nonmetals) minerals mined on federal lands. |40| Although that report was written in the 1990s, it is unlikely that gold's dominance has decreased since then. The Interior report also showed that federal lands mineral production represented about 6% of the value of all minerals produced in the United States.
Figure 1. Production and Import of Select Minerals and Metals
Click to enlargeSource: Created by CRS. Data from USGS Mineral Commodity Summaries, 2014, USGS Minerals Yearbook, 2012, China Chapter.
This section provides a discussion of selected policy options that are included in legislation introduced in the 113th Congress. Appendix B of this report summarizes much of the critical minerals-related legislation. Similar bills are likely to be introduced in the 114th Congress.
Investment in R&D is considered by many experts (e.g., DOE, MIT, and elsewhere) to play a critical role in the support for and development of new technologies that would address three primary areas: greater efficiencies in materials use; substitutes or alternatives for critical minerals; and recycling of critical minerals. While a small investment is underway at DOE (described below), larger investments in R&D are being discussed.
Congress could authorize and appropriate funding for a USGS comprehensive global assessment to identify economically exploitable critical mineral deposits (as a main product or co-product), and locations where critical minerals could be exploited as a by-product.
Minerals Information Administration
The USGS could establish a Minerals Information Administration for information and analysis on the global mineral/metal supply and demand picture. Companies producing minerals on public lands could be required to report production data to the federal agency.
Greater Exploration for Critical Minerals
Supporting and encouraging greater exploration for critical minerals in the United States, Australia, Africa, and Canada could be part of a broad international strategy. There are only a few companies in the world that can provide the exploration and development skills and technology for critical mineral development. These few companies are located primarily in the above four regions and China, and may form joint ventures or other types of alliances for R&D, and for exploration and development of critical mineral deposits worldwide, including those in the United States. Whether there should be restrictions on these cooperative efforts in the United States is a question that Congress may ultimately choose to address.
Other action by Congress could include frequent oversight of free trade issues associated with critical mineral supply. Recently, two raw material issues associated with China export restrictions were taken up by the World Trade Organization (WTO). One case, settled in 2011, was filed by the United States and was related to restrictions on bauxite, magnesium, manganese, silicon metal, and zinc, among others (using export quotas and export taxes). The other case, resolved in 2012, was filed by the United States, Japan, and the European Union on export restrictions of rare earth oxides, tungsten, and molybdenum. The WTO ruled against China in both cases, concluding that China did not show the link between conservation of resources or environmental protection (and protection of public health) and the need for export restrictions.
The United States could support more trade missions; support U.S. commercial delegations to China and other mineral producing countries; and assist smaller and less-developed countries to improve their governance capacity.
China's economic development will continue to have a major impact on the world supply and availability of raw materials and downstream products. Other countries will likely be faced with making adjustments to secure needed raw materials, metals, and finished goods for national security and economic development. Many firms have moved to China to gain access to its market, raw materials or intermediate products, and generally lower-cost production. At the same time, China is seeking technology transfer from many of these firms to expand its downstream manufacturing capacity. Despite China's current overcapacity and increased exports of some commodities, in the long run it may be in China's interest to use its minerals (plus imports) for domestic manufacturing of higher-valued downstream products (e.g., component parts and consumer electronics). Higher-cost, inefficient facilities and mines may close more rapidly, resulting in China seeking more imports as mining industry consolidations are implemented.
One issue being raised by several economists is how China will respond to global market prices. Will Chinese firms continue to provide domestic industries with discounted prices, keeping more materials in-house, while selling materials at higher prices to the export market? Or will economic reforms and international pressure lead to more closely aligned domestic and export prices and the continuation of mineral and metal exports?
China's dominance in the supply and demand of global raw materials could be addressed through consistent development of alternate sources of supply, use of alternative materials (substitutes) when possible, efficiency gains, aggressive R&D in development of new technologies, and comprehensive minerals information to support this effort. There may not be an immediate crisis, but China is likely entering an era of fewer raw material exports over the long run, which seems to call for some type of long-term planning by the private sector and government entities that want to meet U.S. national security, economic, and energy policy interests and challenges. It would be important to keep an eye on free trade issues and address any concerns through the WTO if needed, such as the previous cases of export restrictions of raw materials brought up and won against China.
More analysis would be useful to investigate U.S. firms' capacity to adjust to supply bottlenecks such as restrictions in exports, underinvestment in capacity, China's materials use domestically, single source issues, strikes, power outages, natural disasters, political risk, and lack of substitutes. Having such analysis and understanding may be a matter of public policy. Congress may consider policies to minimize the risk of potential supply interruption of critical and strategic minerals and metals before a crisis emerges.
[Source: By Marc Humphries, Congressional Research Service, R43864, Washington D.C., 09Jan15. Marc Humphries is a Specialist in Energy Policy.]
Appendix A. Selected Minerals Major Applications
Mineral Major Applications Aluminum transportation, packaging, building, electrical Chromium stainless steel, metal alloys, and chemicals Cobalt superalloys, aircraft engines, batteries, permanent magnets Copper building, electric al, electronic products, transportation equipment Gallium integrated circuits (in high-tech equipment), light emitting diodes (LEDs), solar cells Germanium fiber optics, infrared optics, solar cells, other solar energy applications Graphite steelmaking, refractory applications, foundry operations, brake linings Indium electrical conduction, liquid crystal displays (LCDs), solar cells and photovolta Lithium rechargeable batteries, ceramics, glass, chemical compounds Magnesium metal production of titanium and other metals Manganese steel production Molybdenum steel and superalloys Niobium steel and superalloys Platinum Group Metals autocatalysts, fuel cells, jewelry Rare Earths Oxides permanent magnets, petroleum refining, glass, lasers, steel alloys, fluorescent lighting Silicon aluminum alloys, semiconductors, and solar cells Tantalum capacitors for electronic devices Tellurium photovoltaic panels, solar cells, thermoelectric devices Titanium aerospace applications Tungsten cutting tools, wear-resistant materials used in construction and metal making Vanadium steelmaking, aerospace applications Yttrium phosphors, metal alloys, ceramics Source: USGS, Mineral Commodity Summaries, 2014 and National Research Council, Minerals, Critical Minerals, and the U.S. Economy.
Appendix B. Selected Critical Minerals-Related Legislation in the 113th Congress
H.R. 761, the National Strategic and Critical Minerals Production Act of 2013
Introduced by Representative Mark E. Amodei on February 15, 2013, and referred to House Committees on Natural Resources and the Judiciary. H.R. 761 passed by a vote of 246-178 on September 18, 2013. The bill defines critical and strategic minerals and would seek to streamline the federal permitting process for domestic mineral exploration and development. It would establish responsibilities of the "lead" federal agency to set clear mine permitting goals, minimize delays, and follow time schedules when evaluating a mine plan of operations. The review process would be limited to 30 months, and the priority of the lead agency would be to maximize the development of the mineral resource while mitigating environmental impacts.
S. 1600, Critical Minerals Policy Act of 2013
Introduced by Senator Lisa Murkowski on October 29, 2013; referred to the Committee on Energy and Natural Resources. The bill would define what critical minerals are, but would request that the Secretary of the Interior establish a methodology that would identify which minerals qualify as critical. The Secretary of the Interior shall maintain a list of critical minerals not to exceed 20 at any given time. The bill would establish analytical and forecasting capability on mineral/metal market dynamics as part of U.S. mineral policy. The Secretary of the Interior would direct a comprehensive resource assessment of critical mineral potential in the United States, assessing the most critical minerals first and including details on the critical mineral potential on federal lands.
S. 1600 would require the National Academy of Sciences to update its 1999 report Hardrock Mining on Federal Lands, examine the regulatory framework for mineral development in the United States, and provide the number and location of abandoned hardrock mines. Agency review and reports would be intended to facilitate a more efficient process for critical minerals exploration on federal lands, and specifically would require performance metrics for permitting mineral development activity and report on the timeline of each phase of the process.
The Department of Energy would establish an R&D program to examine the alternatives to critical minerals and explore recycling and material efficiencies through the supply chain. The Department of the Interior would produce an Annual Critical Minerals Outlook report that would provide forecasts of domestic supply, demand, and price for up to 10 years.
Title II of the bill recommends mineral-specific action (led by the Department of Energy) for cobalt, lead, lithium, thorium, and non-traditional sources for rare earth elements. For example, there would be R&D for the novel use of cobalt, grants for domestic lithium production R&D, and a study on issues associated with establishing a licensing pathway for the complete thorium nuclear fuel cycle.
Title III would repeal the 1980 Minerals Policy Act and the Critical Minerals Act of 1984 and would authorize $60 million for appropriation.
Appendix C. 2013 U.S. Net Import Reliance
Commodity Percent Import Reliant Arsenic 100 Asbestos 100 Bauxite and Alumina 100 Cesium 100 Fluorspar 100 Graphite 100 Indium 100 Manganese 100 Mica 100 Niobium 100 Quartz Chrystal 100 Rubidium 100 Scandium 100 Strontium 100 Tantalum 100 Thallium 100 Thorium 100 Vanadium 100 Yttrium 100 Gallium 99 Antimony 85 Germanium 85 Platinum 79 Titanium Mineral Concentrates 79 Cobalt 76 Zinc 75 Silicon Carbide 72 Palladium 60 Chromium 50 Magnesium Compounds 47 Tungsten 41 Source: USGS, Mineral Commodity Summaries, 2014.
Notes: This list is based on high import reliance, or China and South Africa as primary import sources.
Notes:
1. The Third Plenum, which typically provides a broad economic and political roadmap for the Communist Party of China (CPC), was held on November 9-12, 2013, in Beijing and was designed, among other things, to address the balance of power between China's Central Government and Provincial Governments and begin to make significant progress towards economic reforms, including more market-based decision making. China's Third Plenum and its potential economic reforms are discussed at length in an Asia Society Policy Institute Report, Avoiding the Blind Alley, China's Economic Overhaul and its Global Implications, by Daniel Rosen, produced in collaboration with Rhodium Group, October 2014. [Back]
2. The USGS 2012, Minerals Yearbook, China chapter (December 2013), reports that the CPC indicated that it wanted to see the top 10 iron ore producers control 60% of output and the top 10 aluminum producers control 90% of output and to consolidate the rare earth industry into six large conglomerates. [Back]
3. Du Juan, "China's Oil, Petrochemical Sector Faces 5 Years of Tough Challenges," China Daily, September 15, 2014. [Back]
4. There are 17 rare earth elements (REEs), 15 within the chemical group called lanthanides, plus yttrium and scandium. The lanthanides consist of the following: lanthanum, cerium, praseodymium, neodymium, promethium, samarium, europium, gadolinium, terbium, dysprosium, holmium, erbium, thulium, ytterbium, and lutetium. The lanthanides are often broken into two groups: light rare earth elements (LREEs)--lanthanum through europium (atomic numbers 5763)--and the heavier rare earth elements (HREEs)--gadolinium through lutetium (atomic numbers 64-71). Yttrium is typically classified as a heavy element. (USGS). The HREEs are much more valuable and less available than the LREEs. [Back]
5. Jack Lifton, "China Is NOT Standing Still," InvestorIntel, September 17, 2014. [Back]
6. Fueling the Dragon, August 2012. [Back]
7. The phrase outbound direct investment is used by the Chinese government as investment outside of China. [Back]
8. Du Juan, "Outbound Mining projects on the Rise," China Daily, October 22, 2014. [Back]
9. Elizabeth C. Economy and Michael Levi, By All Means Necessary, How China's Resource Quest Is Changing the World, Council of Foreign Relations, 2014. [Back]
10. For more details on China's trade policies see CRS Report RL33536, China-U.S. Trade Issues, by Wayne M. Morrison. [Back]
11. Metals Daily, October 13, 2014. [Back]
12. Exploration Review, 2013, by D.R. Wilburn and K.A. Stanley USGS, Mining Engineering, May 2014. [Back]
14. China Daily, October 20, 2014. [Back]
15. Demand data for China are very spotty at best, most of which is not later than 2010, and has been pulled together from various sources. Also, China's export data available from the USGS is limited, and shows that most of the volume and value of exports are steel-related. [Back]
16. Niobium 101, IAMGOLD Corporation, March 28, 2012. [Back]
17. "Manganese Fact Sheet," Shaw River Manganese Limited, 2010, http://www.shawriver.com.au. [Back]
18. "Vanadium Outlook," American Vanadium, http://www.americanvanadium.com/vanadium-outlook.php. [Back]
19. International Chromium Development Association, "Industrial Minerals," Mining Engineering, June 2011. [Back]
20. "Fact Sheet: Indium, Polinares," EU Policy on Natural Resources, Working Paper no. 39, March 2012. [Back]
21. Du Juan, China Daily, "Iron Ore Imports Poised for 15% Growth," October 20, 2014. [Back]
23. USGS, 2012 Minerals Yearbook, China. [Back]
24. By All Means Necessary, op. cit., p. 52. [Back]
25. Ibid, p. 54. The major state actors in the "go global" policy are (1) SOASAC, (2) Ministry of Commerce-- Department of Outward Investment and Economic Cooperation, MOFCOM, (3) Ministry of Foreign Affairs, and (4) state-owned banks: China's Ex-Im Bank and China Development Bank. [Back]
26. Nicholas R. Lardy, Markets over Mao, The Rise of Private Business in China, Person Institute for International Economics, 2014. [Back]
27. Bob Davis, "China's Growth Seen Slowing Sharply over Decade," Wall Street Journal, October 20, 2014. [Back]
28. The National Research Council report defines critical minerals as a mineral that "performs an essential function for which there are few or no satisfactory substitutes ..., and if there is a high probability that its supply may become restricted." The term strategic mineral is typically associated with "national security and military needs or requirements during a national emergency." National Research Council, Minerals, Critical Minerals, and the U.S. Economy, National Academies Press, 2008. (Hereinafter "NRC Report, 2008.") [Back]
31. DOI/USGS, Minerals Yearbook, Volume 1, 2007. [Back]
32. Energy Critical Elements, Securing Materials for Emerging Technologies, A report by the APS panel on public affairs and the materials research society, 2011. [Back]
33. U.S. DOE, Critical Materials Strategy, p. 116, December 2011. [Back]
34. U.S. mineral policies provide a framework for the development of domestic metal mineral resources and for securing supplies from foreign sources. Specifically, the Mining and Minerals Policy Act of 1970 (30 U.S.C. §21a) declared that it is in the national interest of the United States to foster the development of the domestic mining industry "... including the use of recycling and scrap." The National Materials and Minerals Policy, Research and Development Act of 1980 (30 U.S.C. 1601) declares, among other things, that it is the continuing policy of the United States to promote an adequate and stable supply of materials necessary to maintain national security, economic well-being, and industrial production, with appropriate attention to a long-term balance between resource production, energy use, a healthy environment, natural resources conservation, and social needs. [Back]
35. This chart provides the percent of U.S. import dependence of selected minerals and the primary countries of supply. USGS, Mineral Commodity Summaries, 2014, p. 6. [Back]
36. For example, note the following minerals with some reserves and or production: arsenic--small reserves; asbestos-- small reserves; bauxite--small production and reserves; fluorspar--byproduct of lime; thorium ore--some reserves, no U.S. production; yttrium--some reserves, little production; rare earths--some production, large reserves; rubidium and thallium--no production, small reserves. China produces 99% of the world's yttrium. There is no planned or current production of bauxite or fluorspar on public lands. [Back]
37. The Government Accountability Office (GAO), Hardrock Mining: Information on State Royalties and Trends in Mineral Imports and Exports, GAO-08-849R, July 21, 2008. [Back]
38. U.S. Department of the Interior, Task Force on Mining Royalties, "Economic Implications of a Royalty System for Hardrock Minerals," August 16, 1993. [Back]
39. U.S. GAO, Mineral Resources, "Value of Hardrock Minerals Extracted From and Remaining on Federal Lands," GAO/rced-92-192, August 1992. [Back]
40. U.S. Department of the Interior, Task Force on Mining Royalties, "Economic Implications of a Royalty System for Hardrock Minerals," August 16, 1993. [Back]
 | This document has been published on 17Feb15 by the Equipo Nizkor and Derechos Human Rights. In accordance with Title 17 U.S.C. Section 107, this material is distributed without profit to those who have expressed a prior interest in receiving the included information for research and educational purposes. |