| Information |  | |
Derechos | Equipo Nizkor
| ||
| Information | | |
Derechos | Equipo Nizkor
| ||
12Nov13
International Food Aid: U.S. and Other Donor Contributions
Contents
Commitments Under the Food Aid Convention
Food Aid Shipments under the FAC
Food Aid Contributions to the World Food ProgramFigures
Figure 1. Average Annual Food Aid Shipments (%) in Wheat Equivalent by Major FAC Donors, 1995/1996-2011/2012
Figure 2. Food Aid Contributions by Donors to the World Food Program, 1996-2013Tables
Table 1. Annual FAC Food Aid Commitments and Annual Average Shipments
Appendixes
Appendix A. Annual Food Aid Shipments by FAC Donors, 1995/96-2011/12
Appendix B. Annual Food Aid Contributions by Donors to the World Food Program, 1996-2013
Summary
The United States is the world's major provider of international food aid to low-income developing countries. This report provides data on the U.S. contribution to global food aid as reported by signatories of the International Food Aid Convention (FAC) and compiled by the International Grains Council (IGC), as well as data on U.S. and other donor contributions to the United Nations World Food Program (WFP).
The Food Aid Convention (FAC) is an agreement among donor countries to provide a minimum amount of food aid to low-income developing countries. The food aid commitment agreed to by all FAC signatories in 1999 was approximately 4.9 million metric tons (mmt) annually. The United States pledged to provide 2.5 mmt annually, or 51% of the total annual commitment. A new FAC, renamed the Food Assistance Convention, was negotiated in 2012. The United States ratified the new FAC on September 26, 2012. Commitments under the new convention are pending.
Data from the IGC show that U.S. food aid accounted for 56% of food aid shipments by FAC signatories over the period 1995/1996-2011/2012.
A substantial portion of U.S. food aid is channeled through the WFP. Over the period from 1996 to October 20, 2013, around 43% of donor contributions to the WFP came from the United States.
Commitments Under the Food Aid Convention
The Food Aid Convention (FAC), first agreed to in 1967 during the Kennedy Round of multilateral trade negotiations held under the auspices of the General Agreements on Tariffs and Trade (GATT), was an international agreement that constituted a framework of cooperation on food aid among major donors. The food aid commitment under the FAC was a minimum commitment and was intended to be a guarantee of food security for low-income developing countries. The signatories of the FAC were Argentina, Australia, Canada, the European Union and its member countries, Japan, Norway, Switzerland, and the United States. Signatories could provide more than their minimum commitment.
Under the FAC, the donors could express their annual food aid commitments either in tonnage or in value. Some donors--the EU, Canada, and Japan--use a mix of commodities and cash. The total commitment under the FAC (negotiated in 1999) was 4.9 million metric tons, or mmt (Table 1 and Appendix B). The United States made the largest annual commitment, 2.5 mmt or 51% of the total. The combined EU commitment (European Commission and EU member countries) was around 27%. Commitments by Canada, Japan, and Australia were, respectively, 8.6%, 6.1%, and 5.1%.
Table 1. Annual FAC Food Aid Commitments and Annual Average Shipments
(metric tons wheat equivalent)
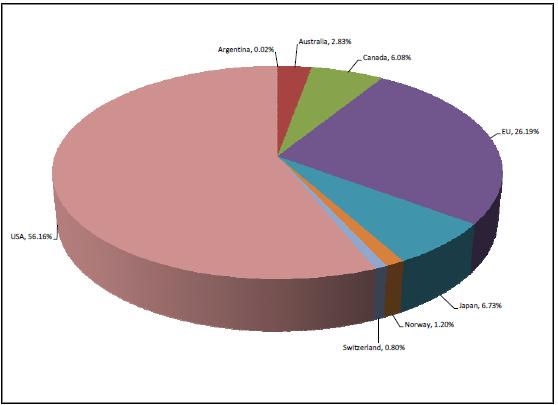
Annual Commitments Percent Average Food Aid Shipments 1999-2012 Percent Argentina 35,000 0.72% 1,753 0.02% Australia 250,000 5.11% 222,757 2.83% Canada 420,000 8.58% 478,940 6.08% EU 1,320,000 26.97% 2,062,203 26.18% Japan 300,000 6.13% 529,886 6.73% Norway 30,000 0.61% 94,310 1.20% Switzerland 40,000 0.82% 63,091 0.80% USA 2,500,000 51.07% 4,422,696 56.16% Total 4,895,000 100.00% 7,875,637 100.00% Source: International Grains Council Food Aid Committee, The Food Aid Convention.
Although the FAC expired in 2003, a working committee of the IGC was established to prepare for its renegotiation. The Food Aid Committee of the IGC meets periodically to review donor food aid contributions in relation to commitments under the 1999 FAC and to global food needs. At their biennial meeting in December 2010, the members of the Food Aid Committee agreed to begin the formal process of renegotiating the Food Aid Convention. |1| Negotiations for a new FAC were completed in 2012. The Food Aid Convention was renamed the Food Assistance Convention to reflect the fact that food aid included not only commodities but also cash-based forms of assistance to provide food security. |2| Commitments under the new convention are pending.
Food Aid Shipments under the FAC
The United States is the major contributor to international food aid, supplying on average, since 1995, around 56% of the annual total food aid donated by members of the Food Aid Committee of the International Grains Council (IGC) and signatories of the 1999 Food Aid Convention (Figure 1). |3| U.S. contributions have averaged 4.4 mmt annually, but U.S. food aid shipments have varied from year to year (Appendix A). |4| The lowest amount shipped was 2.2 mmt in 2010/2011; the largest shipments, 7.1 mmt, were in 2001/2002. U.S. shipments of commodity food aid were 2.8 mmt in 2011/2012,.
Food aid from the European Union (including food aid provided both by the European Commission and by individual EU member countries) has been more stable and averaged around 2.1 mmt or 26% of average annual food aid shipments. Japan and Canada provided 7% and 6%, respectively, of the total from major donors. Historically, the United States, the EU, Canada, Japan, and Australia have accounted for about 98% of total food aid shipments. The United States and the EU together contributed 82% of shipments under the FAC. The United States contributes U.S. commodities, while the European Union and its member countries and Canada provide a mix of cash and commodities. Japan's contributions are provided primarily as cash rather than commodities.
Because the IGC's food aid data are reported on a July/June marketing year basis, its data for U.S. food aid shipments do not correspond, for example, to fiscal year food aid data reported by the U.S. Department of Agriculture in annual budget documents or by the U.S. Agency for International Development in its budget documents or annual food aid reports. The source of the data in Figure 1 and Appendix A is the annual report Food Aid Shipments, prepared by the Food Aid Committee of the International Grains Council, which has been renamed Food Aid Operations. |5|
Figure 1. Average Annual Food Aid Shipments (%) in Wheat Equivalent by Major FAC Donors, 1995/1996-2011/2012

Click to enlarge
Source: Food Aid Operations 2011/12, International Grains Council Food Aid Committee.
Food Aid Contributions to the World Food Program
A substantial portion of U.S. food aid is channeled through the United Nations World Food Program (WFP), the intergovernmental agency that provides food aid for development projects and humanitarian relief in low income countries. U.S. and other donor contributions to the WFP are not in addition to, but are included in, the data reported in Figure 1 and Appendix A.
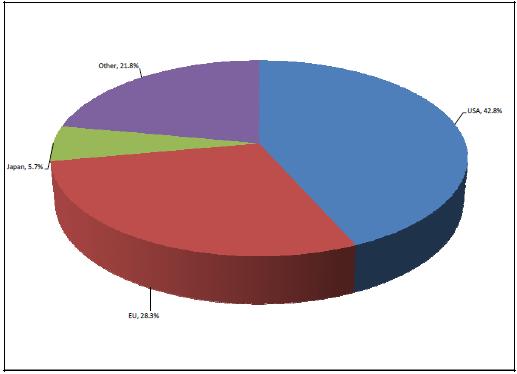
More than 56 donors, mainly countries, but also some non-governmental organizations and private corporations, contribute to the WFP. The United States is the major donor, providing over the last 18 years around 43% of total WFP contributions
Figure 2 and Appendix B). Over that same 18-year period, the EU (European Commission plus EU member countries' contributions) accounted for 28% of total WFP contributions. Japan, whose contributions are in cash, provided around 6%. The remaining donors combined provided 22% to WFP food aid resources.
Figure 2. Food Aid Contributions by Donors to the World Food Program, 1996-2013
Click to enlarge
Source: World Food Programme.
Note: Data as of October 20, 2013.[Source: By Charles E. Hanrahan and Carol Canada, Congressional Research Service, Washington D.C., 12Nov13. Charles E. Hanrahan is a Senior Specialist in Agricultural Policy; Carol Canada is an Information Research Specialist.]
Appendix A. Annual Food Aid Shipments by FAC Donors, 1995/96-2011/12
1995/96 1996/97 1997/98 1998/99 1999/00 2000/01 2001/02 (metric tons wheat equivalent)
Argentina 13,400 0 0 10,135 2,740 0 26 Australia 298,146 305,127 293,221 273,064 296,713 251,865 245,828 Canada 448,764 468,431 417,917 487,095 470,640 293,477 412,082 EU 2,413,991 2,049,691 2,201,162 1,969,892 1,970,768 2,357,778 1,836,717 Japan 474,870 326,835 302,626 561,643 337,357 637,749 531,755 Norway 6,233 32,816 19,306 61,293 75,960 85,876 74,318 Switzerland 75,479 38,636 57,915 38,939 61,295 54,169 58,042 USA 2,849,384 2,553,283 2,818,500 4,734,121 5,692,116 6,798,280 7,124,407 Total 6,580,267 5,774,819 6,110,647 8,136,182 8,907,589 10,479,194 10,283,175 2002/03 2003/04 2004/05 2005/06 2006/07 2007/08 2008/09 (metric tons wheat equivalent)
Argentina 0 0 0 0 0 0 0 Australia 203,820 177,984 168,083 180,667 114,530 216,726 163,857 Canada 499,382 351,168 437,341 448,534 474,438 520,903 551,475 EU 1,980,781 2,218,065 2,151,958 2,853,063 2,488,053 2,178,310 2,263,456 Japan 666,910 580,953 578,261 354,289 318,964 428,301 556,078 Norway 144,927 165,510 145,586 196,034 179,408 102,955 89,382 Switzerland 67,892 69,689 71,854 61,608 71,051 69,872 59,368 USA 6,054,197 5,801,724 5,363,186 4,830,710 3,869,162 3,630,343 4,256,834 Total 9,617,909 9,365,093 8,916,269 8,924,905 7,515,606 7,147,410 7,940,450 2009/10 2010/11 2011/12 Total Annual Average (metric tons wheat equivalent) (percent) (metric tons) Argentina 0 0 0 26,301 0.02% 1,753 Australia 165,081 185,067 247,094 3,786,873 2.83% 222,757 Canada 524,148 603,760 732,428 8,141,983 6.08% 478,940 EU 1,691,765 1,463,241 968,764 35,057,455 26.19% 2,062,203 Japan 691,326 915,223 744,918 9,008,058 6.73% 529,886 Norway 62,774 109,885 51,012 1,603,275 1.20% 94,310 Switzerland 47,861 97,738 71,139 1,072,547 0.80% 63,091 USA 3,745,514 2,209,249 2,854,828 75,185,838 56.16% 4,422,696 Total 6,928,469 5,584,163 5,670,183 133,882,330 100.00% 7,875,431 Source: International Grains Council Food Aid Committee, Food Aid Shipments renamed to Food Aid Operations, various issues.
Appendix B. Annual Food Aid Contributions by Donors to the World Food Program, 1996-2013
(thousand dollars) Government Donors 1996* 1997* 1998 1999 2000 2001 2002 2003 United States of America 494,980 408,380 873,051 721,157 795,676 1,201,223 938,185 1,458,638 European Union 603,981 550,522 522,921 465,575 442,999 449,787 563,170 623,956 EU Commission 196,873 237,254 184,645 167,576 117,794 126,833 177,326 200,874 EU Countries 407,108 313,269 338,276 298,000 325,205 322,953 385,844 423,081 Austria 4,774 4,910 3,853 3,710 2,832 1,117 3,302 2,199 Belgium 19,472 17,416 16,908 10,782 6,284 5,342 5,831 8,405 Bulgaria 0 0 0 0 0 0 0 0 Cyprus 0 0 10 2 0 99 Czech Republic 20 590 37 100 0 175 Denmark 53,064 44,248 43,384 46,900 41,922 39,786 40,158 39,268 Estonia 0 0 0 0 0 0 0 0 Finland 16,045 13,768 13,801 15,345 15,219 14,352 17,444 17,793 France 19,203 21,884 24,742 27,693 26,170 35,957 14,457 14,940 Germany 96,036 68,487 61,779 53,089 46,750 58,228 60,920 46,503 Greece 150 170 0 0 0 0 0 0 Hungary 0 0 65 74 65 65 65 65 Ireland 3,149 4,284 4,378 5,021 7,644 7,338 10,349 11,815 Italy 34,876 9,112 10,632 20,824 19,936 39,748 41,787 41,074 Latvia 0 0 0 0 0 0 0 0 Lithuania 0 0 0 0 0 0 0 0 Luxembourg 218 0 270 130 1,205 1,748 2,919 4,132 Malta 0 0 28 0 0 0 0 1 Netherlands 78,804 45,972 45,532 55,003 62,801 59,173 58,795 50,422 Poland 0 0 0 684 225 200 215 215 Portugal 0 0 185 2,285 0 358 0 447 Romania 0 0 0 0 0 0 0 0 Slovakia 0 0 25 518 15 15 15 697 Slovenia 0 0 227 141 0 57 36 0 Spain 13,720 12,245 2,725 2,511 3,256 3,952 2,607 6,754 Sweden 33,164 35,985 29,511 28,415 30,778 27,721 31,224 42,341 UK 34,434 34,789 80,212 24,284 60,056 27,694 95,718 135,734 Japan 124,032 98,991 123,757 106,438 260,099 90,592 92,896 130,136 All Others 222,166 253,647 125,027 195,058 135,011 151,707 852,568 760,570 Total Government Donors 0 0 1,720,488 1,509,679 1,682,692 1,916,877 1,833,487 2,541,244 Total Financial Institutions, Pooled Funding, and Private Sector Donors 0 0 4,479 2,833 11,149 4,125 709,050 567,789 Total 1,445,159 1,311,540 1,724,966 1,512,512 1,693,841 1,921,002 2,542,536 3,109,034
Government Donors 2004 2005 2006 2007 2008 2009 2010 2011 United States of America 1,065,020 1,173,720 1,123,291 1,184,181 2,070,435 1,767,852 1,552,743 1,239,077 European Union 695,550 868,169 743,215 758,105 1,254,938 1,167,955 975,747 1,054,743 EU Commission 200,501 263,940 265,762 250,437 355,435 343,063 289,928 258,587 EU Countries 495,049 604,229 477,453 507,668 899,503 824,892 685,818 796,156 Austria 2,189 4,093 1,839 3,794 3,935 1,722 1,329 733 Belgium 11,705 13,941 11,132 17,642 24,784 39,111 37,691 36,957 Bulgaria 5 0 10 10 15 0 0 0 Cyprus 5 0 400 656 200 814 690 0 Czech Republic 98 1,236 308 574 817 309 159 237 Denmark 43,436 53,202 43,817 44,731 56,608 41,890 41,112 45,751 Estonia 0 0 0 42 242 0 240 71 Finland 18,000 23,794 18,319 25,567 28,257 28,799 26,643 29,902 France 30,424 37,809 25,325 32,121 40,369 21,701 20,127 38,269 Germany 65,331 69,533 59,680 65,836 100,752 132,118 95,824 194,777 Greece 0 0 0 0 0 0 0 0 Hungary 65 120 65 65 65 65 65 15 Ireland 13,684 19,820 31,005 34,443 39,821 22,549 19,318 27,010 Italy 47,929 45,790 12,392 31,601 101,920 30,058 24,052 27,392 Latvia 0 0 0 0 0 0 37 0 Lithuania 0 0 112 306 27 0 0 0 Luxembourg 5,413 10,933 15,387 12,207 14,276 12,987 12,789 11,575 Malta 0 0 0 0 0 0 0 0 Netherlands 77,740 115,352 80,023 75,663 117,505 77,594 74,424 73,059 Poland 356 200 1,200 755 1,164 535 691 465 Portugal 723 874 488 111 111 112 0 0 Romania 0 0 0 147 301 75 72 0 Slovakia 25 30 48 44 72 30 15 15 Slovenia 34 97 0 107 135 108 119 196 Spain 17,466 11,552 16,993 29,641 117,460 214,204 82,635 68,024 Sweden 44,540 84,259 58,520 64,754 81,708 72,487 90,660 97,832 UK 115,884 111,595 100,390 66,851 168,961 127,624 157,127 143,877 Japan 135,730 160,472 71,381 118,870 178,323 202,905 214,762 282,026 All Others 774,050 637,996 609,321 638,702 1,835,667 754,309 916,726 1,123,170 Total Government Donors 2,226,391 2,671,577 2,406,395 2,510,582 4,661,191 3,697,813 3,459,400 3,398,247 Total Financial Institutions, Pooled Funding, and Private Sector Donors 559,843 280,374 241,202 256,128 847,132 322,832 357,704 444,646 Total 2,786,234 2,951,951 2,647,598 2,766,710 5,508,324 4,020,645 3,817,104 3,842,893
Government Donors 2012 as of October 20, 2013 Total United States of America 1,462,478 1,368,718 20,887,505 European Union 1,083,167 1,036,706 13,834,778 EU Commission 386,136 223,930 4,247,909 EU Countries 697,031 812,777 9,586,868 Austria 1,082 1,185 48,598 Belgium 14,448 36,307 333,817 Bulgaria 0 208 248 Cyprus 5 3 2,767 Czech Republic 399 200 4,326 Denmark 43,510 52,638 814,401 Estonia 180 158 787 Finland 25,999 20,397 369,055 France 30,747 22,600 485,045 Germany 150,055 139,831 1,565,019 Greece 0 0 27,958 Hungary 85 10 954 Ireland 20,002 15,964 297,596 Italy 14,592 21,540 532,786 Latvia 0 0 37 Lithuania 0 0 446 Luxembourg 9,920 11,948 127,914 Malta 0 0 29 Netherlands 75,255 57,967 1,280,937 Poland 744 0 7,647 Portugal 99 0 5,792 Romania 40 0 635 Slovakia 18 0 1,581 Slovenia 0 39 1,297 Spain 12,524 811 616,474 Sweden 95,181 86,173 1,029,363 UK 202,145 344,799 2,030,328 Japan 190,749 215,367 2,796,842 All Others 1,139,317 785,664 10,630,857 Total Government Donors 3,663,113 1,936,302 41,805,981 Total Financial Institutions, Pooled Funding, and Private Sector Donors 414,743 270,361 2,738,009 Total 4,077,856 3,751,255 48,845,280 Source: World Food Program. See http://www.wfp.org/about/donors/wfp-donors.
* 1996 and 1997 includes both the totals for government donors and financial institutions, pooled funding, and private donors.
If a country contributed to the WFP program before joining the EU then the amounts contributed are shown in this table; however, their contributions were not added to the total for the EU countries or EU total. Instead it was added to all others.
Notes:
1. Food Aid Committee, Press Release, December 20, 2010, "Meeting of the Food Aid Committee, London 14 December 2010," viewed at http://www.foodaidconvention.org/Pdf/p_r/prfacdec10.pdf. [Back]
2. The text of the Food Assistance Convention may be accessed at http://www.foodaidconvention.org/Pdf/FoodAssistance/FoodAssistance.pdf. [Back]
3. Information on the International Grains Council, the Food Aid Convention, and the Food Aid Committee is available at http://www.igc.int/en/Default.aspx and at http://www.foodaidconvention.org/en/Default.aspx. [Back]
4. Data on food aid shipments provided by the International Grains Council are reported on a wheat marketing year basis (July-June). [Back]
5. International Grains Council, Food Aid Committee, Food Aid Operations 2011/2012: Report on Operations by Members of the Food Aid Convention, September 2013, viewed at http://foodaidconvention.org/Pdf/annual_reports/faoperations_1112.pdf. [Back]
 | This document has been published on 21Jan14 by the Equipo Nizkor and Derechos Human Rights. In accordance with Title 17 U.S.C. Section 107, this material is distributed without profit to those who have expressed a prior interest in receiving the included information for research and educational purposes. |