| Information |  | |
Derechos | Equipo Nizkor
| ||
| Information | | |
Derechos | Equipo Nizkor
| ||
Jul14
BRICS Joint Statistical Publication 2014
Contents
1 General Information, Economic and Social Indicators Comparison of BRICS Countries
Table 1.1 - General Information on BRICS Countries - 2013
Table 1.2 - Economic and Social Indicators Comparison of BRICS CountriesTable 2.1 - Summary of Population on BRICS Countries - 2000/2013
Table 2.2.1 - Selected Data on Population - Brazil - 2000/2013
Table 2.2.2 - Selected Data on Population - Russia - 2000/2013
Table 2.2.3 - Selected Data on Population - India - 2000/2012
Table 2.2.4 - Selected Data on Population - China - 2000/2013
Table 2.2.5 - Selected Data on Population - South Africa - 2000/2011
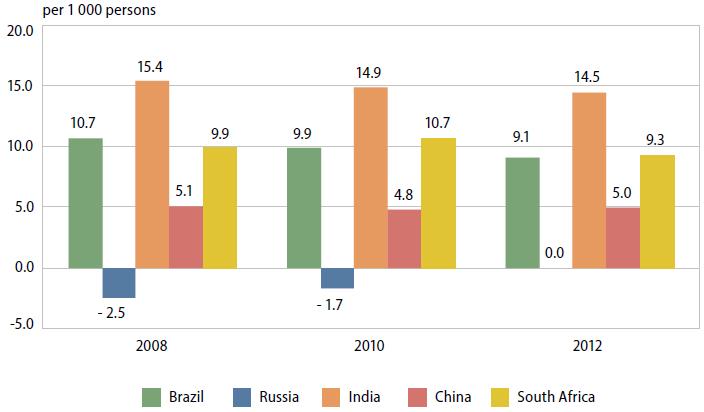
Graph 2.1(a) - Natural Increase Rate of Population on BRICS Countries - 2008/2012
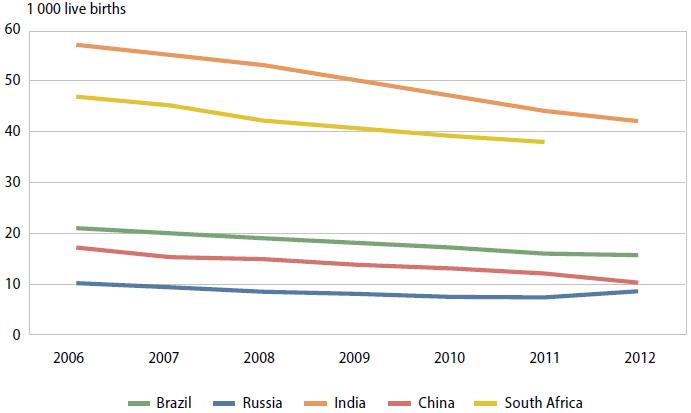
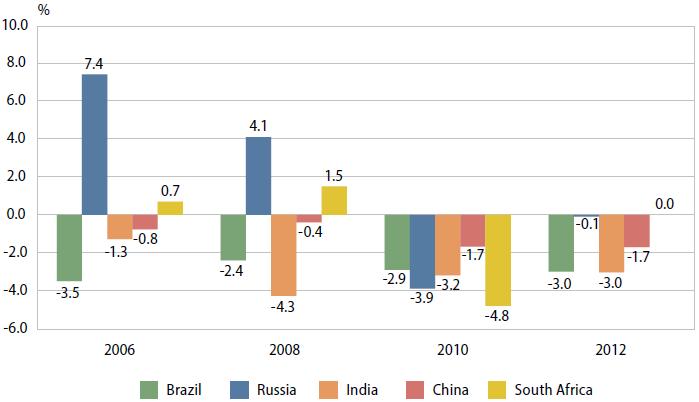
Graph 2.1(b) - Infant Mortality Rate on BRICS Countries - 2006/2012
Explanatory Notes3 Economically Active Population
Table 3.1 - Summary of Economically Active Population on BRICS Countries - 2000-2013
Table 3.2.1 - Selected Data on Economically Active Population-Brazil - 2001/2012
Table 3.2.2 - Selected Data on Economically Active population - Russia - 2000/2013
Table 3.2.3 - Selected Data on Economically Active Population - India - 2000/2012
Table 3.2.4 - Selected Data on Economically Active Population - China - 2000/2013
Table 3.2.5 - Selected data on Economically Active Population - South Africa - 2000/2012
Explanatory NotesTable 4.1 - Summary of National Accounts on BRICS Countries - 2000/2013
Table 4.2.1 - Selected Data on National Accounts - Brazil - 2006/2013
Table 4.2.2 - Selected Data on National Accounts - Russia - 2000/2013
Table 4.2.3 - Selected Data on National Accounts - India - 2000/2014
Table 4.2.4 - Selected Data on National Accounts - China - 2000/2013
Table 4.2.5 - Selected Data on National Accounts - South Africa - 2000/2013
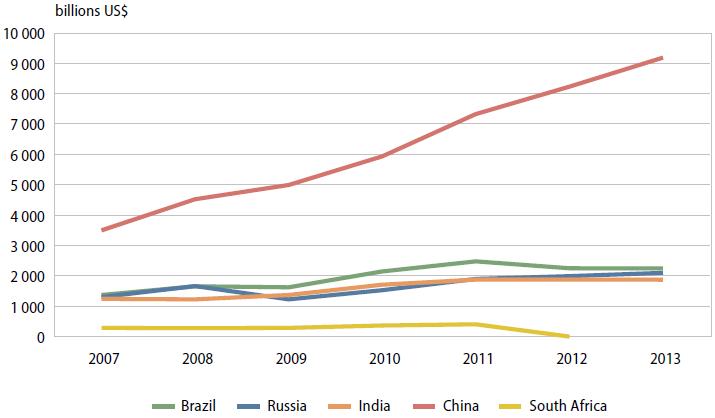
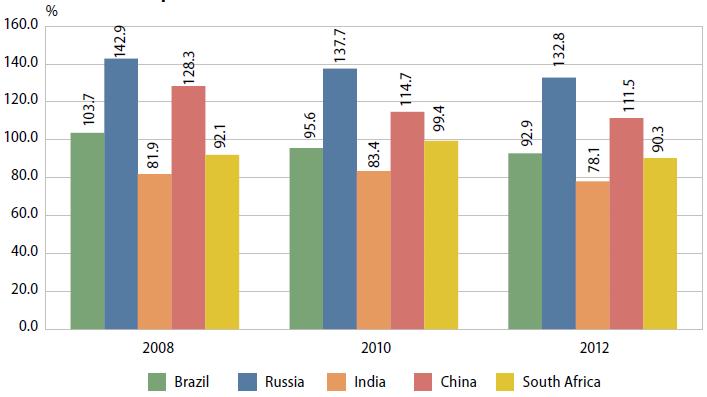
Graph 4.1(a) - Gross Domestic Product GDP on BRICS Countries - 2007-2013
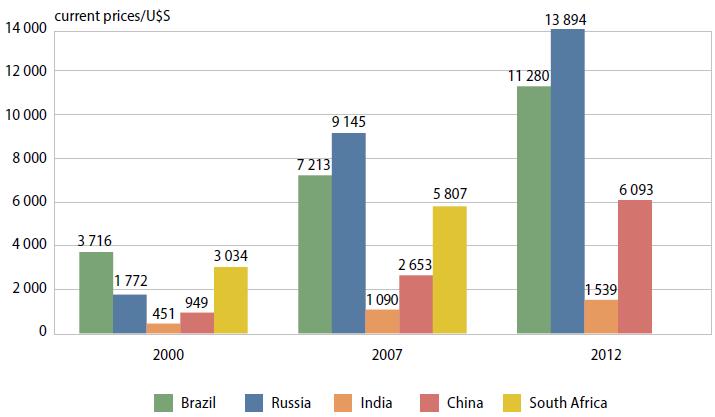
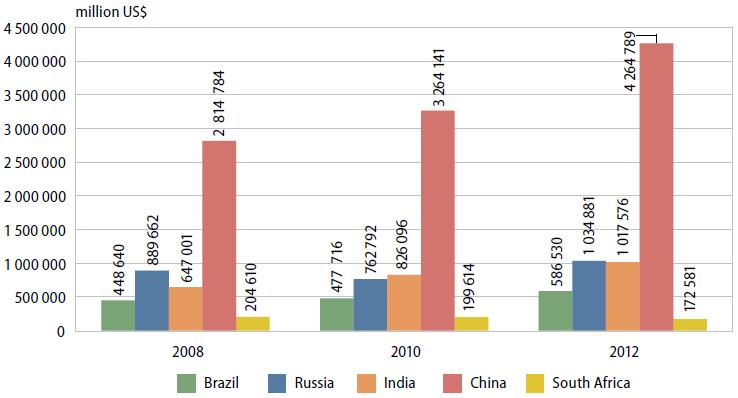
Graph 4.1(b) - Per Capita GDP (Current Prices) on BRICS Countries - 2000/2012
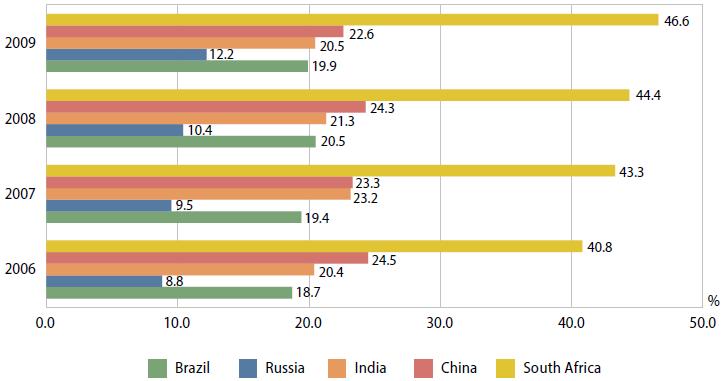
Graph 4.1(c) - Share of GDP in Different Sectors on BRICS Countries - 2012
Explanatory NotesTable 5.1 - Summary of Price Indices on BRICS Countries - 2000/2013
Table 5.2.1 - Selected Data on Price Indices - Brazil - 2000/2013
Table 5.2.2 - Selected Data on Price Indices - Russia - 2000/2013
Table 5.2.3 - Selected Data on Price Indices - India - 2000/2013
Table 5.2.4 - Selected Data on Price Indices - China - 2000/2013
Table 5.2.5 - Selected Data on Price Indices - South Africa - 2000/2013
Explanatory NotesTable 6.1 - Summary of People's Living Standard on BRICS Countries - 2000/2013
Table 6.2.1 - Selected Data on People's Living Standard - Brazil - 2000/2012
Table 6.2.2 - Selected Data on People's Living Standard - Russia- 2000/2012
Table 6.2.3 - Selected Data on People's Living Standard - India - 2000/2012
Table 6.2.4 - Selected Data on People's Living Standard - China - 2000/2013
Table 6.2.5 - Selected Data on People's Living Standard - South Africa - 2000/2011
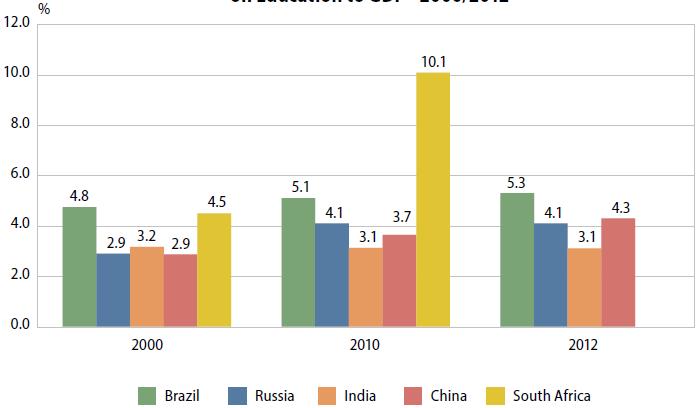
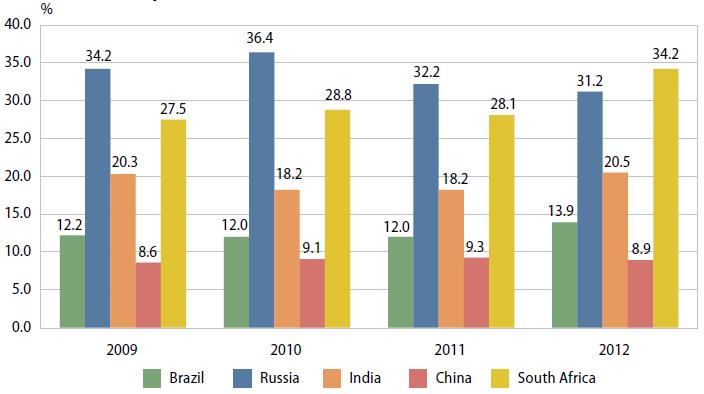
Graph 6.1 (a) - Percentage Share of Public Expenditure on Education to GDP - BRICS Countries - 2000/2012
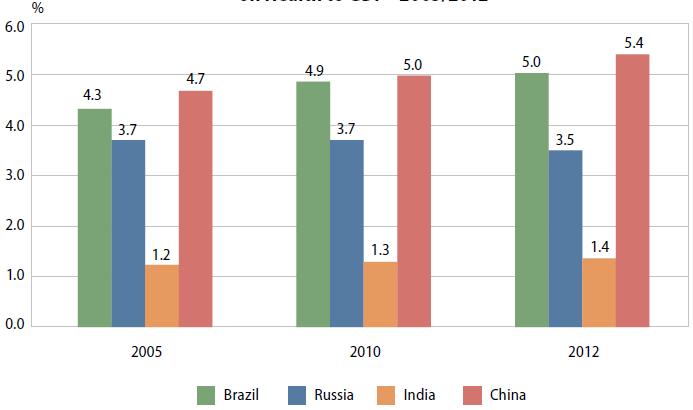
Graph 6.1 (b) - Percentage Share of Public Expenditure on Health to GDP - BRICS Countries - 2005/2012
Explanatory NotesTable 7.1 - Summary of Resources and Environment on BRICS Countries - 2000/2012
Table 7.2.1 - Selected Data on Resources and Environment - Brazil - 2000/2012
Table 7.2.2 - Selected Data on Resources and Environment - Russia - 2000/2012
Table 7.2.3 - Selected Data on Resources and Environment- India - 2000/2013
Table 7.2.4 - Selected Data of Resources and Environment - China - 2000/2012
Table 7.2.5 - Selected Data of Resources and Environment - South Africa - 2000/2010
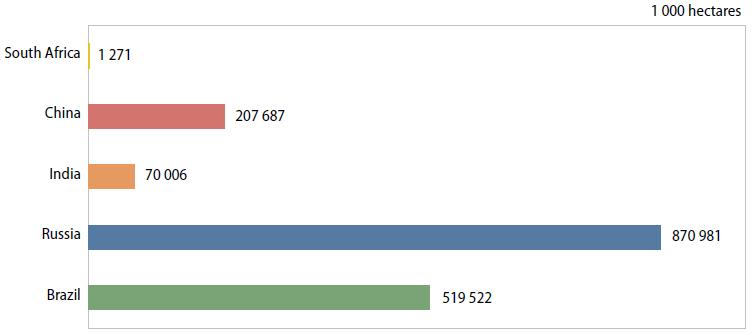
Graph 7.1 - Utilization of Forest Area on BRICS Countries - 2010
Explanatory NotesTable 8.1 - Summary of Industry on BRICS Countries - 2000/2013
Table 8.2.1 - Selected Data on Output of Main Industrial Products - Brazil - 2000/2012
Table 8.2.2 - Selected Data on Output of Main Industrial Products - Russia - 2000/2013
Table 8.2.3 - Selected Data on Output of Main Industrial Products - India - 2000/2012
Table 8.2.4 - Selected Data on Output of Main Industrial Products - China - 2000/2013
Table 8.2.5 - Value of Sales by Industry - South Africa - 2000/2013
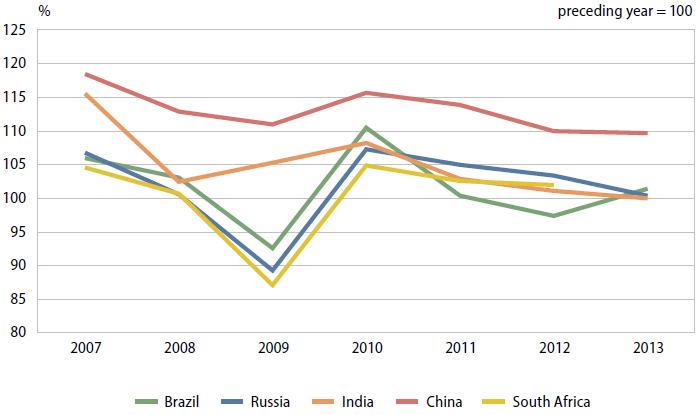
Graph 8.1 - Index of Industrial Production on BRICS Countries - 2007-2013
Explanatory NotesTable 9.1 - Summary of Energy on BRICS Countries - 2000/2012
Table 9.2 - Energy Balance 2012 - Brazil, Russia, China -2012
Table 9.2.1 - Summary of Energy - Brazil - 2000/2012
Table 9.2.2 - Summary of Energy - Russia - 2000/2012
Table 9.2.3 - Energy Commodity Balance - India - 2007-2011
Table 9.2.4 - Summary of Energy - China - 2000/2013
Table 9.2.5 - Energy Supply, Use and Flow Diagrams - South Africa (2009)
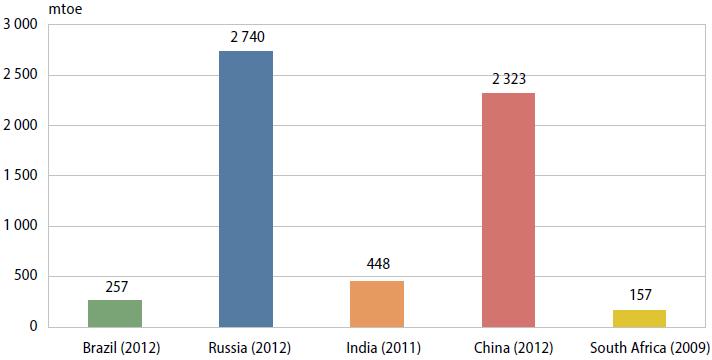
Graph 9.1 (a) - Total Primary Energy Production on BRICS Countries - 2009/2012
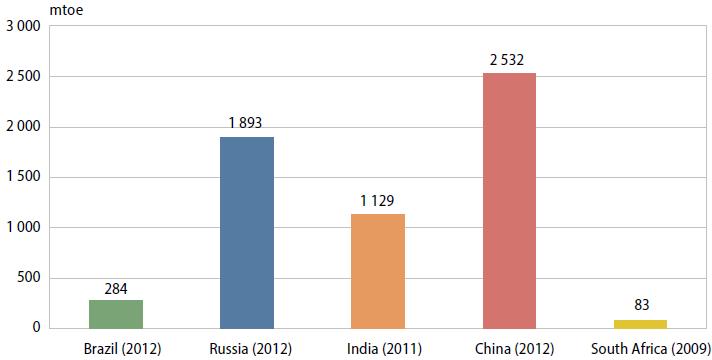
Graph 9.1 (b) - Total Consumption of Energy on BRICS Countries - 2009/2012
Explanatory Notes10 Agriculture, Forestry, Animal Husbandry and Fishery
Table 10.1 - Summary of Agriculture, Forestry, Animal Husbandry and Fishery on BRICS Countries - 2000/2013
Table 10.2.1 - Selected Data on Agriculture, Forestry, Animal Husbandry and Fishery - Brazil - 2000/2013
Table 10.2.2 - Selected Data on Agriculture, Forestry, Animal Husbandry and Fishery - Russia - 2000/2013
Table 10.2.3 - Selected Data on Agriculture, Forestry, Animal Husbandry and Fishery - India - 2000/2013
Table 10.2.4 - Selected Data on Agriculture, Forestry, Animal Husbandry and Fishery - China - 2000/2013
Table 10.2.5 - Selected Data on Agriculture, Forestry, Animal Husbandry and Fishery - South Africa - 2000/2013
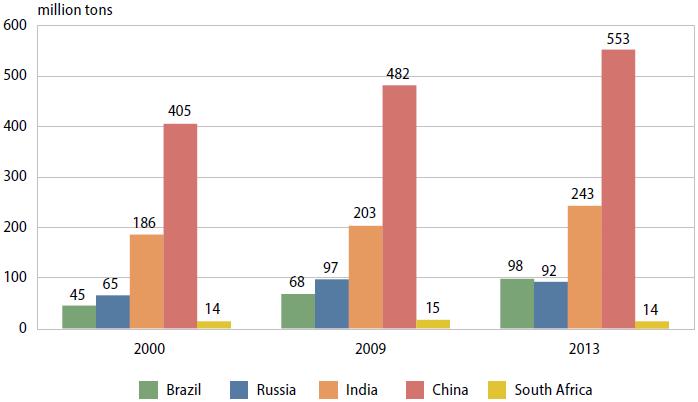
Graph 10.1 - Production of Cereals on BRICS Countries - 2000/2013
Explanatory NotesTable 11.1 - Summary of Transport on BRICS Countries - 2000/2013
Table 11.2.1 - Selected Data on Transport - Brazil - 2000/2013
Table 11.2.2 - Selected Data on Transport - Russia - 2000/2013
Table 11.2.3 - Selected Data on Transport - India - 2000/2012
Table 11.2.4 - Selected Data on Transport - China - 2000/2012
Table 11.2.5 - Selected Data on Transport - South Africa - 2003/2010
Explanatory NotesTable 12.1 - Summary of Information Society on BRICS Countries - 2000/2013
Explanatory NotesTable 13.1 - Summary of Finance on BRICS Countries - 2000/2013
Table 13.2.1 - Selected Data on Finance - Brazil - 2000/2013
Table 13.2.2 - Selected Data on Finance - Russia - 2000/2013
Table 13.2.3 - Selected Data on Finance - India - 2000/2012
Table 13.2.4 - Selected Data on Finance - China - 2000/2013
Table 13.2.5 - Selected Data on Finance - South Africa - 2000/2011
Graph 13.1(a) - Percentage Share of Deficit (-)/Surplus of General Government to GDP - BRICS Countries - 2006/2012
Graph 13.1(b) - Percentage Share of Income Tax to Revenue - BRICS Countries - 2006/2009
Explanatory Notes14 External Economic Relations
Table 14.1 - Summary of External Economic Relations on BRICS Countries - 2000/2013
Table 14.2.1 - Selected Data on Merchandise Trade - Brazil - 2000/2013
Table 14.2.2 - Selected Data on Merchandise Trade - Russia - 2000/2013
Table 14.2.2.1 - Selected Data on Merchandise Trade - Russia - 2013
Table 14.2.3.1 - Selected Data on Merchandise Trade: Major Trade Partners - India - 2012-2013
Table 14.2.3.2 - Selected Data on Merchandise Trade: BRICS Countries - India - 2000/2012
Table 14.2.3.3 - Selected Data on Merchandise Trade - India - 2000/2013
Table 14.2.4.1 - Selected Data on Merchandise Trade - China - 2000/2013
Table 14.2.4.2 - Top 10 Commodities Exported to BRICS Countries by China - 2013
Table 14.2.4.3 - Top 10 Commodities Imported from BRICS Countries by China - 2013
Table 14.2.5 - Selected Data on Merchandise Trade: BRICS Countries - South Africa - 2010
Table 14.3.1 - Selected Data on Foreign Direct Investment - FDI - Brazil - 2000/2013
Table 14.3.2 - Selected Data on Foreign Direct Investment FDI - Russia - 2000/2013
Table 14.3.4 - Selected Data on Foreign Direct Investment FDI - China - 2000/2013
Table 14.4.1 - Balance of Payments - Brazil - 2013
Table 14.4.2 - Balance of Payments - Russia - 2012
Table 14.4.3 - Balance of Payments - India - 2010-2013
Table 14.4.4 - Balance of Payments - China - 2012
Table 14.4.5 - Balance of Payments - South Africa - 2011 178
Graph 14.1(a) - Value of Imports and Exports of Goods and Commercial Services - BRICS Countries - 2008/2012
Graph 14.1(b) - Ratio of Exports of Goods and Commercial Services to Imports of Goods and Commercial Services - BRICS Countries - 2008/2012
Graph 14.1(c) - Share of External Debt to GDP - BRICS Countries - 2009-2012
Explanatory NotesTable 15.1 - Foreign Tourists Arrivals on BRICS Countries from Different Continents - 2006-2013
Table 15.2.1 - Foreign Tourists Arrivals by Top 15 Countries - Brazil - 2001/2012
Table 15.2.2 - Foreign Tourist Arrivals by Top 17 Countries - Russia - 2001/2013
Table 15.2.3 - Foreign Tourist Arrivals by Top 15 Countries - India - 2001/2012
Table 15.2.4 - Foreign Tourist Arrivals by Top 17 Countries or Territories - China - 2000/2013
Table 15.2.5 - Foreign Tourist Arrivals by Top 15 Countries - South Africa - 2009/2012
Table 15.3.1 - Foreign Tourists Arrivals in the Country from Different Continents - Brazil - 2001/2012
Table 15.3.2 - Foreign Tourists Arrivals in the Country from Different Continents - Russia - 2001/2013
Table 15.3.3 - Foreign Tourists Arrivals in the Country from Different Continents - India - 2001/2013
Table 15.3.4 - Foreign Tourists Arrivals in the Country from Different Continents - China - 2000/2013
Table 15.3.5 - Foreign Tourists Arrivals in the Country from Different Continents - South Africa - 2009/2012
Explanatory Notes
Annexure
(i) A Brief Overview of the Statistical System of Brazil
(ii) A Brief Overview of the Statistical System of Russia
(iii) A Brief Overview of the Statistical System of India
(iv) A Brief Overview of the Statistical System of China
(v) A Brief Overview of the Statistical System of South Africa
Symbols used
...
Figure not available; .. Not applicable; - Zero not resulting from rounding; 0; 0.0 Originally positive numerical data rounded to zero.
1 General Information, Economic and Social Indicators Comparison of BRICS Countries
Table 1.1 - General Information on BRICS Countries - 2013
Area of territory (1 000 sq. km) Capital city Mid-year population (million persons) Population density (persons per sq. km) National currency Brazil 8 515 Brasilia (1) 201 23.60 Real - R$ Russia 17 098 Moscow 144 8.4 Rouble - Rub India 3 287 New Delhi (2) 1 211 (2) 382.0 Rupee - ₹ China 9 600 Beijing 1 357 141.0 Renminbi - RMB South Africa 1 221 Pretoria (3) 52 (3)42.3 Rand - ZAR Sources
Brazil
Brazilian Institute of Geography and Statistics - IBGE.Russia
a) Federal State Statistics Service of the Russian Federation.
b) Federal Service for State Registration, Cadastre and Cartography.India
Ministry of Information & Broadcasting, India 2014.China
a) China National Tourism Administration.
b) National Bureau of Statistics of the People's Republic of China, 2014 China Statistical Abstract.South Africa
Statistics South Africa.Footnotes:
Brazil
(1) Information about the mid-year population and demographic indicators, were obtained by a projection of the population by sex and age groups by the component method.India
(2) Based on Census 2011 as on 1st March.South Africa
(3) Based on 2011 Census.
Table 1.2 - Economic and Social Indicators Comparison of BRICS Countries - 2009/2013
Year Value Population
Mid-year (millions persons) Brazil (1) 2013 201 Russia 2013 144 India (2) 2011 1 211 China (3) 2013 1 357 South Africa 2011 52 Male (%) Brazil (1) 2013 49.4 Russia 2013 46.3 India (2) 2011 51.5 China (3) 2013 51.2 South Africa 2011 48.6 Female (%) Brazil (1) 2013 50.6 Russia 2013 53.7 India (2) 2011 48.5 China (3) 2013 48.8 South Africa 2011 51.4 Population density (persons per sq. km) Brazil (1) 2013 23.6 Russia 2013 8.4 India (2) 2011 382.0 China 2013 141.0 South Africa 2011 42.3 Crude birth rate (per 1 000 persons) Brazil (1) 2013 14.8 Russia 2013 13.2 India 2012 21.6 China 2013 12.1 South Africa 2011 21.6 Crude death rate (per 1 000 persons) Brazil (1) 2013 6.9 Russia 2013 13.0 India 2012 7.0 China 2013 7.2 South Africa 2011 11.3 Infant mortality rate (per 1 000 live births) Brazil (1) 2013 15.0 Russia 2013 8.2 India 2012 42.0 China 2012 10.3 South Africa 2011 45.1 Maternal mortality rate (per 100 000 live births) Brazil ... ... Russia 2013 11.5 India 2010-2012 178 China 2012 24.5 South Africa ... ... Economically active population
Share (%) Brazil 2012 65.9 Russia 2013 52.7 India (4) 2012-2013 53.1 China (5) 2013 56.6 South Africa 2012 35.4 Unemployment rate (%) Brazil 2012 6.1 Russia 2013 5.5 India (4) 2012-2013 5.3 China (6) 2013 4.1 South Africa 2012 25.1 National accounts
GDP (current prices/billion US$) Brazil 2012 2 246 Russia (7) 2013 2 096 India (8) 2013 1 726 China (9)(10) 2013 9 185 South Africa 2012 382 Per capita GDP (current prices/US$) Brazil 2012 11 171 Russia 2013 14 604 India (8) 2013 1 418 China 2013 6 768 South Africa 2011 7 810 People's living standards
Share of public expend on education as % of GDP Brazil 2012 5.3 Russia 2013 4.3 India (8) 2012 3.3 China (11) 2012 4.3 South Africa 2011 6.8 Expend on health as % of GDP Brazil 2012 5.0 Russia 2013 3.5 India (8) 2012 1.4 China (12) 2012 5.4 South Africa 2011 4.0 Industry
Industrial production (preceding year = 100) (%) Brazil 2013 102.2 Russia 2013 100.4 India (8) 2012 101.1 China 2013 109.7 South Africa 2013 102.0 Iron ore production (million tons) Brazil 2011 468 Russia(concentrate of iron ore) (7) 2013 102 India (8) 2012 136 China 2013 1 451 South Africa ... ... Steel production (million tons) Brazil 2011 50 Russia (7) 2013 69 India (8) 2012 78 China 2013 779 South Africa (million Rand) 2010 92 180 Passenger cars production (1 000 sets) Brazil 2011 2 850 Russia (7) 2013 1 916 India (8) 2012 2669 China 2013 12 104 South Africa (million ZAR) 2012 93 049 TV sets production (1 000 sets) Brazil 2011 14 177 Russia (7) 2013 14 231 India (8) 2010 9 206 China (13) 2013 127 761 South Africa ... ... Energy
Petroleum production (million tons) Brazil 2013 93 Russia (7) 2013 523 India (8) 2012 38 China 2013 209 South Africa 2007 26 Electricity production (billion kWh) Brazil 2013 527 Russia (7) 2013 1 051 India (8) (14) 2012 1 113 China 2013 5 398 South Africa 2010 260 Primary energy production (mtoe) Brazil 2012 257 Russia (7) (15) 2012 2 740 India (7) 2011 448 China (16) 2013 2 380 South Africa 2006 205 Consumption of energy (mtoe) Brazil 2012 284 Russia (15) 2012 1 893 India (8) (14) 2011 1 129 China (16) 2013 2 625 South Africa 2006 210 Agriculture
Cultivated land (million hectares) Brazil 2012 69 Russia 2012 121 India (17) 2010 156 China 2009 135 South Africa ... ... Cereals production (million tons) Brazil 2012 75 Russia 2013 92 India (14) (17) 2013 243 China 2013 553 South Africa 2011 13 Fruits and vegetables (million tons) Brazil 2012 43 Russia 2013 18 India (17) 2012 243 China 2013 986 South Africa 2011 10 Meat production (1 000 tons) Brazil 2012 22 349 Russia (7) 2013 8 542 India (8) 2011 5 514 China 2013 85 350 South Africa 2011 2 531 Fish catch (1 000 tons) Brazil 2010 785 Russia 2009 3 728 India (8) 2011 8 666 China 2013 11 730 South Africa ... ... Transport
Length of railways in operation (1 000 km) Brazil 2013 30 Russia 2013 86 India (8) 2012 65 China 2012 98 South Africa 2010 21 Length of highways (1 000 km) Brazil 2013 1 691 Russia 2013 987 India 2012 3 202 China 2012 4 238 South Africa ... ... Passenger traffic by air (million persons/km) Brazil 2013 116 Russia 2013 225 157 India (8) 2012 99 971 China 2013 565 849 South Africa ... ... Gini coefficient
Brazil (18) 2012 0.500 Russia (19) 2012 0.420 India (17) Rural 2009-2010 0.280 Urban 2009-2010 0.370 China (20) 2013 0.473 South Africa (21) 2011 0.650 Sources
Brazil
a) Brazilian Institute of Geography and Statistics - IBGE, Directorate of Surveys.
b) National Petroleum Agency - ANP.
c) Energy Research Company - EPE.
d) Ministry of Fishery and Aquaculture - MPA.
e) Brazilian Institute of Environment and Renewable Natural Resources - IBAMA.Russia
a) Federal State Statistic Service of the Russian Federation.
b) Federal Services of State Registration, Cadastre and Cartography.
c) Federal Agency for Air Transport.
d) Federal Road Agency.China
a) National Bureau of Statistics of the People's Republic of China.
b) Ministry of Civil Affairs of the People's Republic of China, Annual Statistical Report 2013.
c) National Health and Family Planning Commission of the People's Republic of China, China Statistical Yearbook of Health and Family Planning 2013.
d) Ministry of Transport of the People's Republic of China, Annual Statistical Report 2013.
e) State Administration of Press, Publication, Radio, Film and Television of the Peoples' Republic of China, Annual Statistical Report 2012.
f) National Bureau of Statistics of the People's Republic of China, Annual Industrial Statistical Report 2013.
g) National Bureau of Statistics of the People's Republic of China, 2014 China Statistical Abstract.
h) National Bureau of Statistics of China, China Statistical Yearbook 2013.
i) Ministry of Land and Resources of the People's Republic of China.
j) Ministry of Human Resources and Social Security of the People's Republic of China.
k) Ministry of Environmental Protection of the People's Republic of China, Annual Statistical Report 2012.
l) Ministry of Water Resources of the People's Republic of China, Annual Statistical Report 2012.
m) Ministry of Education of the People's Republic of China, Annual Statistical Report 2011-2012.
n) China Railway Corporation, Annual Statistical Report 2013.Footnotes
1. Specific footnotes and sources of data may be seen from the respective chapters of the indicators.
Brazil
(1) Information about the mid-year population and demographic indicators were obtained by a projection of the population by sex and age groups by the component method.
(18) Gini Index of Household Income.Russia
(7) Provisional data.
(15) In million tons of standard fuel (the volumes of natural fuels - oil, coal, gas, oil products etc., which have been recalculated for their own corresponding calorific coal equivalent into the volume of standard fuel).
(19) Data on Gini Index are based on per capita income data.India
(2) As on 1st March 2011
(4) Based on survey ( Period October 2012 to May 2013) conducted by Labor Bureau, Ministry of Labor & Employment, as per Usual Principal Status taking into account subsisiary activity also.
(8) The information is as per the financial year i.e. during April of the current year to March of the next year. (14) Provisional data.
(17) The information is as per agricultural year/National sample survey round (for Gini coefficient) i.e. July of the current year to June of the next year.China
(3) Year-end population.
(5) Share of number of employed persons to national population.
(6) Registered Unemployment Rate in Urban Areas.
(9) GDP and Per Capita GDP in US dollars are converted using the annual average exchange rates.
(10) Data of GDP are calculated at producers' prices.
(11) Refers to government appropriation for education to GDP.
(12) Refers to total expenditure on health as percentage of GDP
(13) Refers only to Color TV.
(16) Electric power in total primary energy production and total consumption of energy are converted on the basis of equal caloric value.
(20) Data of Gini Coefficient are based on per capita annual disposable income.South Africa
(21) Gini is per capita expenditure excluding taxes.
Table 2.1 - Summary of Population on BRICS Countries - 2000/2013
Population (million persons)
2000 2003 2004 2005 2006 2007 2008 2009 2010 2011 2012 2013 Total (Mid-year) Brazil (1) 173.4 180.6 182.9 185.2 187.3 189.5 191.5 193.5 195.5 197.4 199.2 201.0 Russia (2) 146.9 145.0 144.3 143.8 143.2 142.9 142.7 142.7 142.8 142.9 143.1 143.3 India (3) 996.9 1 062.0 1 079.0 1 096.0 1 112.0 1 129.0 1 145.0 1 161.0 1 177.0 1 193.0 1 208.0 1 224.0 China (4) 1 262.6 1 288.4 1 296.1 1 303.7 1 311.0 1 317.9 1 324.7 1 331.3 1 337.7 1 344.1 1 350.7 1 357.4 South Africa 44.4 46.0 47.0 47.6 48.3 48.9 49.6 50.2 50.9 51.6 ... ... Male Brazil (1) 86.2 89.6 90.7 91.8 92.8 93.8 94.8 95.8 96.7 97.6 98.5 99.3 Russia (2) 68.7 67.5 67.1 66.7 66.3 66.1 66.0 66.0 66.0 66.1 66.2 66.4 India (3) 516.0 550.0 558.0 567.0 576.0 584.0 592.0 601.0 609.0 617.0 625.0 634.0 China (4) (5) 654.4 665.6 669.8 673.8 677.3 680.5 683.6 686.5 687.5 690.7 694.0 697.3 South Africa 21.0 22.0 23.0 23.0 23.0 23.0 24.0 24.0 24.0 25.0 ... ... Female Brazil (1) 87.3 91.0 92.2 93.4 94.5 95.6 96.7 97.8 98.8 99.8 100.8 101.7 Russia (2) 78.2 77.5 77.3 77.1 76.9 76.8 76.8 76.8 76.8 76.8 76.9 77.0 India (3) 481.0 513.0 521.0 529.0 537.0 545.0 552.0 560.0 568.0 575.0 583.0 590.0 China (4) (5) 613.1 626.7 630.1 633.8 637.2 640.8 644.5 648.0 653.4 656.7 660.1 663.4 South Africa 23.0 24.0 24.0 24.0 25.0 25.0 25.0 26.0 26.0 26.0 ... ... Urban Brazil (6) 140.9 148.4 150.9 153.3 155.7 158.0 160.4 162.7 164.9 167.1 169.2 171.3 Russia (2) 107.4 106.3 106.0 105.2 104.8 104.7 104.9 104.9 105.1 105.4 105.7 106.1 India (3) 283.7 300.0 307.0 314.0 321.0 329.0 336.0 343.0 351.0 358.0 365.0 373.0 China (4) (5) 459.1 523.8 542.8 562.1 582.9 606.3 624.0 645.1 669.8 690.8 711.8 731.1 South Africa (7) ... ... ... ... ... ... ... ... ... ... ... ... Rural Brazil (6) 35.2 32.2 32.0 31.8 31.6 31.4 31.1 30.9 30.6 30.3 30.0 29.7 Russia (2) 39.5 38.6 38.3 38.6 38.4 38.1 37.9 37.8 37.8 37.4 37.3 37.2 India (3) 713.2 762.0 772.0 782.0 791.0 800.0 809.0 818.0 826.0 835.0 843.0 851.0 China (4) (5) 808.4 768.5 757.1 745.4 731.6 715.0 704.0 689.4 671.1 656.6 642.2 629.6 South Africa (7) ... ... ... ... ... ... ... ... ... ... ... ... Sources
Brazil
Brazilian Institute of Geography and Statistics - IBGE.Russia
Federal State Statistics Service of the Russian Federation.India
Ministry of Home Affairs, Office of the Registrar General of India, Reports of The Technical Committee on Population Projection 1996-2006.China
National Bureau of Statistics of the People's Republic of China, China Statistical Yearbook 2001-2013 and Statistical Communique of the People's Republic of China on the 2013 National Economic and Social Development.South Africa
Statistics South Africa.Footnotes
Brazil
(1) Data derived from Population Projection by Sex and Age for the Period 2000-2060.
(6) Urban percentage estimated by linear interpolation for the intercensal period 2000-2010 and designed by the methodology of the United Nations from 2010.Russia
(2) Data on the 1st of January.India
(3) The information is as on 1st March and is based on population projection. See explanatory notes for Census 2011 figures.China
(4) Data in 2000 and 2010 are estimated from the fifth and sixth National Population Census respectively. Data in 2005 are estimated from the National 1% Population Sample Survey .The other data are estimated from the annual national survey on population changes.
(5) Year-end population.South Africa
(7) Population estimation series not active in 2000. Population figures cannot be verified. Population estimation series does not split population into rural/urban.
Table 2.2.1 - Selected Data on Population - Brazil - 2000/2013
2000 2006 2007 2008 2009 2010 2011 2012 2013 Total (mid-year) (million persons) (1) 173.4 187.3 189.5 191.5 193.5 195.5 197.4 199.2 201.0 Under 15 years 52.1 51.2 51.0 50.7 50.3 49.9 49.5 49.0 48.5 15 to 24 years 34.4 35.3 35.1 34.9 34.7 34.5 34.4 34.3 34.2 25 to 59 years 72.7 83.9 85.8 87.8 89.7 91.5 93.1 94.7 96.2 60 years and older 14.2 16.9 17.5 18.2 18.9 19.6 20.4 21.2 22.1 Sex ratio (female = 100) (1) 98.7 98.2 98.1 98.0 97.9 97.8 97.8 97.7 97.7 Under 15 years 103.6 103.9 103.9 104.0 104.1 104.1 104.2 104.2 104.3 15 to 24 years 102.4 102.5 102.5 102.5 102.6 102.6 102.6 102.6 102.7 25 to 59 years 97.4 97.3 97.3 97.3 97.3 97.3 97.4 97.4 97.4 60 years and older 81.1 79.2 79.1 79.0 79.0 79.0 79.1 79.1 79.2 Crude birth rate (per 1 000 persons) (1) 20.9 17.7 17.2 16.7 16.3 15.9 15.5 15.1 14.8 Crude death rate (per 1 000 persons) (1) 6.7 6.1 6.1 6.1 6.0 6.0 6.0 6.0 6.0 Natural increase rate (per 1 000 persons) (1) 14.2 11.5 11.1 10.7 10.2 9.9 9.5 9.1 8.8 Life expectancy at birth (years) (1) 69.8 72.4 72.8 73.1 73.5 73.9 74.2 74.5 74.8 Total fertility rate (per woman) 2.4 2.0 2.0 1.9 1.9 1.9 1.8 1.8 1.8 Infant mortality rate (per 1 000 live births) 29.0 21.0 20.0 19.0 18.1 17.2 16.4 15.7 15.0 Crude marriage rate (per 1 000 persons) (2) 6.0 6.5 6.6 6.8 6.5 6.7 6.9 6.9 ... Crude divorce rate (per 1 000 persons) (3) 1.2 1.4 1.5 1.5 1.4 1.9 2.7 2.6 ... Source
Brazilian Institute of Geography and Statistics - IBGE.Footnotes
(1) Data on population and sex ratios were derived from Population Projection of Brazil by Sex and Age for the Period 2000-2060.
(2) Data derived from Civil Registration Statistics for the period 2000-2012.
(3) Data derived from Civil Registration Statistics for the period 2000-2012, Data divorces, records refer to procedures provided in the first instance without resources. And from 2007 are included consensual divorces that were signed by the notary public deeds.
Table 2.2.2 - Selected Data on Population - Russia - 2000/2013
2000 2006 2007 2008 2009 2010 2011 2012 2013 Total (million persons) (1) 147 143 143 143 143 143 143 143 (3) 143.3 Under 15 years 27 22 21 21 21 22 22 22 23 15 to 24 years 23.1 24.0 23.5 22.9 22.0 20.6 20.4 19.2 18.0 25 to 59 years 69.9 73.3 73.5 73.9 74.3 74.6 74.6 75.0 75.3 60 years and older 26.8 24.5 24.6 24.8 25.0 26.0 26.1 26.7 27.2 Sex ratio (female = 100) 87.9 86.2 86.0 85.9 85.9 85.9 86.0 86.1 86.2 Under 15 years 104.4 104.6 104.8 105.0 105.0 105.0 105. 105.1 105.2 15 to 24 years 102.7 102.2 102.0 102.0 102.2 102.6 103.4 103.8 104.0 25 to 59 years 94.0 91.2 91.0 90.9 90.9 91.0 91.1 91.4 91.8 60 years and older 53.1 50.7 50.8 51.2 51.5 51.9 52.4 52.8 53.1 Crude birth rate (per 1 000 persons) (2) 8.7 10.3 11.3 12.0 12.3 12.5 12.6 13.3 13.2 Death rate (per 1 000 persons) (2) 15.3 15.1 14.6 14.5 14.1 14.2 13.5 13.3 13.0 Natural increase rate (per 1 000 persons) (2) -6.6 -4.8 -3.3 -2.5 -1.8 -1.7 -0.9 0.0 0.2 Life expectancy at birth (years) (2) 65.3 66.7 67.6 68.0 68.8 68.9 69.8 70.2 (3) 70.7 Total fertility rate (per woman) (2) 1.2 1.3 1.4 1.5 1.5 1.6 1.6 1.7 (3) 1.7 Infant mortality rate (per 1 000 live births) (2) 15.3 10.2 9.4 8.5 8.1 7.5 7.4 8.6 8.2 Maternal mortality rate (per 1 000 live births) (2) 39.7 23.7 22.0 20.7 22.0 16.5 16.2 11.5 ... Crude marriage rate (per 1 000 persons) (2) 6.2 7.8 8.8 8.3 8.4 8.5 9.2 8.5 8.5 Crude divorce rate (per 1 000 persons) (2) 4.3 4.5 4.8 4.9 4.9 4.5 4.7 4.5 4.7 Rate of net migration (%) 0.3 0.2 0.3 0.3 0.2 0.2 0.2 0.2 ... Dependency ratio (%) 0.6 0.5 0.5 0.5 0.5 0.5 0.5 0.5 0.5 Source
Federal State Statistics Service of the Russian Federation.Footnotes
(1) Data on the 1st of January. Data for 2004-2010 revised according the results of the 2010 Russia population census.
(2) For 2003-2010 indicators are calculated using population size adjusted with results of the 2010 Russia population census.
(3) Provisional data.
Table 2.2.3 - Selected Data on Population - India - 2000/2012
2000 2005 2006 2007 2008 2009 2010 2011 2012 Total (million persons) (1) 997.0 1096.0 1112.0 1129.0 1145.0 1161.0 1177.0 1192.5 1208.0 Under 15 years 342.0 368.0 357.0 362.0 368.0 357.0 363.7 346.9 351.5 15 to 24 years 194.0 213.0 222.0 225.0 230.0 227.0 237.0 239.8 243.0 25 to 59 years 389.0 437.0 449.6 460.0 465.0 464.0 487.0 507.3 513.0 60 years and older 72.0 79.0 83.6 82.0 81.0 85.0 88.3 98.5 100.3 Sex ratio (female = 100) (1) 107.3 107.2 107.3 107.2 107.2 107.3 107.2 107.3 107.2 Under 15 years 110.4 110.3 109.0 110.5 109.1 111.6 111.6 111.0 112.6 15 to 24 years 109.7 108.8 112.0 108.3 109.1 109.5 108.8 110.0 107.9 25 to 59 years 105.8 104.7 106.0 104.9 106.7 105.7 105.5 106.0 105.6 60 years and older 94.6 97.5 95.0 93.0 101.2 98.4 97.7 96.0 97.5 Crude birth rate (per 1 000 persons) 25.8 23.8 23.5 23.1 22.8 22.5 22.1 21.8 21.6 Death rate (per 1 000 persons) 8.5 7.6 7.5 7.4 7.4 7.3 7.2 7.1 7.0 Natural increase rate (per 1 000 persons) 17.3 16.2 16.0 15.7 15.4 15.2 14.9 14.7 14.5 Life expectancy at birth (years) (2) 62.5 63.4 66.1 66.1 66.1 66.1 66.1 ... ... Total fertility rate (per woman) 3.2 2.9 2.8 2.7 2.6 2.6 2.5 2.4 2.4 Infant mortality rate (per 1 000 live births) 68.0 58.0 57.0 55.0 53.0 50.0 47.0 44.0 42.0 Maternal mortality ratio (per 100 000 live births) (3) 327.0 254.0 254.0 212.0 212.0 212.0 178.0 178.0 178.0 Source
Ministry of Home Affairs, Office of the Registrar General of India, Reports of The Technical Committee on Population Projection 1996-2006; Sample Registration System Statistical Reports and Bulletins on Maternal Mortality in India.Footnotes
(1) The information pertaining to population is as on 1st march and is based on population projections incorporating the information of Census 2001 (except for 2000 which is based on the information from previous Census i.e. 1991). Actual data for 2011 on the basis of Census 2011 has also been released by Ministry of Home Affairs, Office of the Registrar General of India.
(2) Information on Life Expectancy at Birth pertains to 1998-2002,2002-2006,2006-2010. Projected Life Expectancy for 2011-2015 is 67.3 years for male and 69.6 years for female.
(3) Information on Maternal Mortality Ratio pertains to the period 1997-2001, 2004-2006, 2007-2009 and 2010-2012.
Table 2.2.4 - Selected Data on Population - China - 2000/2013
2000 2006 2007 2008 2009 2010 2011 2012 2013 Total Mid-year (million persons) (1) 1 262.6 1 331.0 1 317.9 1 324.7 1 331.3 1 337.7 1 344.1 1 350.7 1 357.4 Year-end (million persons) (1) 1 267.4 1 314.5 1 321.3 1 328.0 1 334.5 1 340.9 1 347.4 1 354.0 1 360.7 Under 15 years (2) 290.1 259.6 256.6 251.7 246.6 222.6 221.6 222.9 223.3 15 to 59 years (2) 846.4 905.9 911.3 916.5 920.8 940.5 940.7 937.3 935.0 60 years and older (2) 130.9 149.0 153.4 159.9 167.1 177.8 185.0 193.9 202.4 15 to 64 years (2) 889.1 950.7 958.3 966.8 974.8 999.4 1 002.8 1 004.0 1 005.8 65 years and older (2) 88.2 104.2 106.4 109.6 113.1 118.9 122.9 127.1 131.6 Sex ratio (female = 100) 106.7 106.3 106.2 106.1 105.9 105.2 105.2 105.1 105.1 Crude birth rate (per 1 000 persons) 14.0 12.1 12.1 12.1 12.0 11.9 11.9 12.1 12.1 Death rate (per 1 000 persons) 6.5 6.8 6.9 7.1 7.1 7.1 7.1 7.2 7.2 Natural increase rate (per 1 000 persons) 7.6 5.3 5.2 5.1 4.9 4.8 4.8 5.0 4.9 Life expectancy at birth (years) 71.4 ... ... ... ... 74.8 ... ... ... Infant mortality rate (per 1 000 persons) 32.2 17.2 15.3 14.9 13.8 13.1 12.1 10.3 ... Crude marriage rate (per 1 000 persons) 6.7 7.2 7.5 8.3 9.1 9.3 9.7 9.8 ... Crude divorce rate (per 1 000 persons) 1.0 1.5 1.6 1.7 1.9 2.0 2.1 2.3 ... Maternal mortality rate (per 100 000 persons) 53.0 41.1 36.6 34.2 31.9 30.0 26.1 24.5 ... Sources
a) National Bureau of Statistics of the People's Republic of China, China Statistical Yearbook 2001-2013 and Statistical Communique of the People's Republic of China on the 2013 National Economic and Social Development.
b) Ministry of Civil Affairs of the People's Republic of China, China Civil Affairs' Statistical Yearbook 2000-2013.
c) National Health and Family Planning Commission of the People's Republic of China, Annual Statistical Report 2000-2013.Footnotes
(1) Data in 2000 and 2010 are estimated from the Fifth and Sixth National Population Census respectively. Data in 2005 are estimated from the National 1% Population Sample Survey. The other data are estimated from the annual national sample survey on population changes.
(2) Breakdowns do not add up to totals for selected years due to rounding up or down of dimensions in the tolerance stack.
Table 2.2.5 - Selected Data on Population - South Africa - 2000/2011
2000 (1) 2004 2005 2006 2007 2008 2009 2010 2011 Total (mid-year) (million persons) 44.4 47.0 47.6 48.3 48.9 49.6 50.2 50.9 51.6 Under 15 years 15.6 15.4 15.5 15.5 15.5 15.5 15.5 15.5 15.5 15 to 24 years 9.3 9.3 9.4 9.5 9.6 9.7 9.8 9.9 10.0 25 to 59 years 17.0 19.2 19.6 20.0 20.4 20.8 21.3 21.7 22.2 60 years and older 2.7 3.1 3.2 3.3 3.4 3.5 3.6 3.8 3.9 Sex ratio (female = 100) 92.4 93.4 93.6 93.8 94.0 94.2 94.3 94.5 94.7 Under 15 years 101.4 100.9 100.9 100.9 100.9 100.8 100.8 100.8 100.8 15 to 24 years 92.1 96.7 97.5 98.3 99.1 99.9 100.6 101.4 101.3 25 to 59 years 88.6 92.0 92.3 92.7 93.0 93.3 93.6 93.9 94.5 60 years and older 71.4 62.4 62.1 61.9 61.8 61.8 61.9 62.1 62.3 Crude birth rate (per 1 000 persons) 23.6 23.1 22.8 22.6 22.5 22.3 22.2 21.6 Death rate (per 1 000 persons) 15.0 15.2 14.6 13.5 12.6 11.8 11.5 11.3 Natural increase rate (per 1 000 persons) 8.6 7.9 8.2 9.1 9.9 10.5 10.7 10.3 Life expectancy at birth (years) 51.7 51.6 52.5 54.0 55.5 56.8 57.6 58.1 Total fertility rate (per woman) 2.6 2.6 2.5 2.5 2.5 2.5 2.5 2.4 Infant mortality rate (per 1 000 live births) 60.1 58.0 55.6 53.6 50.8 49.1 47.1 45.1 Crude marriage rate (per 1 000 persons) (2) (3) 3.3 4.2 4.2 4.1 4.2 4.1 3.7 3.6 3.4 Crude divorce rate (per 1 000 persons) (3) 0.8 0.7 0.7 0.6 0.6 0.6 0.6 0.5 0.4 Source
Statistics South Africa, Mid-Year Population Estimates 2013 and Vital Statistics 2012.Footnotes
(1) Population estimation series not active in 2000. Population figures cannot be verified.
(2) Only registered marriages and divorces used in analysis.
(3) Data for civil unions starts from 2007.
Graph 2.1 (a) - Natural Increase Rate of Population - 2008/2012
Click to enlargeSource: Summary Table of Chapter 2, BRICS Joint Statistical Publication 2014.
Graph 2.1 (b) - Infant Mortality Rate - 2006-2012
Click to enlargeSource: Summary Table of Chapter 2, BRICS Joint Statistical Publication 2014.
General Notes
Crude Birth rate: Number of Births per 1000 population in a given year. This definition excludes fetal deaths. Crude Death Rate: Number of Deaths per 1000 population in a given year. Natural Increase in Population = Crude Birth Rate - Crude Death Rate Total Fertility Rate (TFR): Average number of children that would be born to a woman if she experience the current fertility pattern throughout her reproductive span (15-49 year). Expectation of live at birth: Average number of years' a new born child is expected to live undercurrent mortality conditions. Infant Mortality Rate (IMR): Number of infants dying under one year of age in a year per 1000 live births of the same year. Crude Divorce Rate refers to ratio of divorce couples to the annual average population for the reference year, the formula is: Crude divorce rate = Number of couples divorced for the reference year x 1000� / Annual Average population Dependency rate - number of people aged 0-15 and 60 and over to the population 15-59. Census: A canvass of a given area, resulting in an enumeration of the entire population and often the compilation of other demographic, social and economic information pertaining to that population at a specific time. Brazil
Total Population (Mid-Year) - Information about the population in half of the year, was obtained by a projection of the population by sex and age groups by the component method. This method consists of working separately each component of population dynamics of the population; fertility, mortality and migration. Sex ratio - expressed as the number of males for every 100 females. It is obtained from the ratio of the male and female populations by age group. Crude Marriage Rate - The nuptiality rate is obtained by dividing the number of marriages of spouses 15 years of age or older by the population of this same age group multiplied by a thousand. Crude Divorce Rate - The overall divorce rate is obtained by dividing the number of divorces by population aged 20 years or more multiplied by a thousand. Divorces granted without recourse or notary performed in people 20 years or older on the date of sentence and the population of the same age was considered. Total fertility rate - The total fertility rate expresses the number of children who, on average, would a woman belonging to a hypothetical cohort of women during their fertile life that had their children according to the fertility rates by age study period and were not exposed to the risk of mortality from birth to the end of the fertile period. Crude Birth Rate of Population - Represents the frequency with which occur births in a given population. It is the ratio of live births occurring in a given year and the mid-year population, by 1000. Crude death rate - Represents the frequency with which deaths occur in a given population. It is the ratio of the deaths in a given year and the mid-year population by 1000. Natural Increase Rate of Population - The rate of natural increase is obtained by the difference between the crude birth rates and mortality, both divided by 10. Life expectancy at birth - is the average number of years that a newborn would expect to live from the moment of birth. Infant mortality rate - The infant mortality rate is defined as the number of deaths of infants under one year of age (per thousand live births) in a given geographical area and time period, and is interpreted as the estimated risk of a born live to die during their first year of life. Total Population (Mid-Year) - Information about the population in half of the year, was obtained by a projection of the population by sex and age groups by the component method. This method consists of working separately each component of population dynamics of the population; fertility, mortality and migration. Russia
The information on births, deaths, marriages and divorces is received on the basis of annual processing of data contained in the records of Civil Registrar Offices. India
Maternal Mortality Ratio (MMR) Refers to the number of women who die as a result of complications of pregnancy or childbearing in a given year per 100,000 live births in that year. This is different from Maternal Mortality Rate which is defined as the number of maternal deaths to women in the ages 15-49 per lakh of women in that age group. Census in India is conducted at interval of ten years and the last census was conducted in 2011. The population projection for intercensal period and that for the future is based on Component Method using data from Census and Sample Registration System with the latter providing time series data on fertility and mortality. Accordingly population from 2005-12 provided in the tables is based on projections using 2001 census information while that for 2000 is based on 1991 Census as per the Report of Technical Committees of 2006 and 1996 respectively. Census 2011 figures are also available and as per the same Population of India in 2011 was 1211 million. As per the Census 2011 the total population comprised of 378 Million Urban & 833 Million Rural Population and 625 Million Males & 586 Million Females).
3 Economically Active Population
Table 3.1 - Summary of Economically Active Population on BRICS Countries - 2000/2013
2000 2003 2004 2005 2006 2007 2008 2009 2010 2011 2012 2013 Share of number of economically active population to national population (%) Brazil (1) (2) ... (3) 67.8 68.6 69.3 69.0 68.6 68.6 68.6 ... 66.2 65.9 ... Russia 49.5 49.9 50.6 51.2 52.0 52.7 53.0 53.3 52.8 53.0 52.9 52.7 India (4) 40.6 41.9 42.1 43.0 42.3 ... 41.3 ... 40.0 ... 39.5 ... China (5) (6) 56.9 57.1 57.1 57.1 57.0 57.0 56.9 56.8 56.8 56.7 56.6 (7) 56.6 South Africa 36.8 34.9 34.3 35.8 36.6 36.2 36.9 35.8 34.8 34.9 35.4 ... Share of number of employed persons of the secondary industry to total employed persons (%) Brazil (1) (2) (8) ... (3) 14.5 14.8 15.0 14.9 15.3 15.3 14.8 ... 13.5 14.0 ... Russia (9) 24.1 24.1 23.5 22.9 22.8 22.2 21.4 20.5 20.5 20.2 20.3 20.2 India (10) 12.6 16.9 18.1 18.1 18.8 ... 18.7 ... 21.5 ... 24.3 ... China (6) 22.5 21.6 22.5 23.8 25.2 26.8 27.2 27.8 28.7 29.5 30.3 30.1 South Africa 20.6 21.3 22.5 22.6 22.6 23.0 23.4 22.9 22.1 21.9 21.0 ... Sources
Brazil
Brazilian Institute of Geography and Statistics - IBGE, National Household Sample Survey 2001/2012.Russia
Federal State Statistics Service of the Russian Federation, Sample Survey on Employment.India
Ministry of Statistics and Programme Implementation, National Sample Survey Reports: Employment and Unemployment Situation in India (various issues).China
National Bureau of Statistics of the People's Republic of China, China Statistical Yearbook 2001-2013 and Statistical Communique of the People's Republic of China on the 2013 National Economic and Social Development.South Africa
Statistics South Africa, Mid-Year Population Estimates (Statistical Release P0302); Labour Force Survey (Statistical Release P0210); and Quarterly Labour Force Survey (Statistical Release P0211).Footnotes
Brazil
(1) Revised data, according the last population estimate.
(2) Population 15 years old and over.
(3) Excluding the rural population of the States of Rondonia, Acre, Amazonas, Roraima, Para and Amapa in the year 2003.
(8) Industry activities: manufacturing, mining and quarrrying, electricity, gas and water supply.Russia
(9) Mining and quarrying, manufacturing and electricity, gas and water supply, construction. India
(4) The information is based on Sample Surveys conducted by National Sample Survey Office & pertains to the Survey Period July (Previous Year) to June (Year Indicated in the table) except for 2002 (July-December), 2003(January-December) & 2004 (January-June).
(10) The information in based on Usual Activity Status taking into account both Principal & Subsidiary activity. Secondary Industry includes Mining & Quarrying , Manufacturing, Construction, Electricity Gas & Water Supply.China
(5) Share of number of employed persons to national population.
(6) The total number of employed persons since 2001 are revised according to the 6th National Population Census.
(7) Preliminary data.
Table 3.2.1 - Selected Data on Economically Active Population - Brazil - 2001/2012
2001 (1) 2006 2007 2008 2009 2011 2012 Economically active population (million persons) 82.7 95.9 97.1 99.1 100.8 100.4 101.5 Employed population (million persons) 75.0 87.9 89.2 92.1 92.5 93.7 95.3 Age (%) 15 to 24 years 23.0 20.9 20.3 19.7 18.8 17.9 17.7 25 to 59 years 70.7 72.4 73.0 73.3 74.2 75.2 75.1 60 years and older 6.3 6.7 6.7 7.1 7.0 6.9 7.2 Sector (million persons) Agriculture, forestry and fishing 15.0 16.5 15.9 15.7 15.4 14.3 13.6 Industry (2) 11.0 13.1 13.7 14.1 13.7 12.6 13.4 Construction 5.3 5.8 6.1 6.9 6.9 7.9 8.3 Trade 12.7 15.5 16.0 16.0 16.4 16.7 16.9 Services 30.8 36.7 37.4 39.2 39.9 42.1 43.0 Other 0.2 0.2 0.2 0.2 0.2 0.1 0.1 Unemployed population (million persons) 7.7 8.0 7.8 7.0 8.3 6.7 6.2 Unemployed urban population (million persons) 7.4 7.5 7.3 6.6 7.8 6.3 5.8 Unemployment rate (%) 9.4 8.4 8.1 7.1 8.3 6.7 6.1 Urban unemployment rate (%) 10.7 9.5 9.1 8.0 9.2 7.4 6.7 Unemployment rate for population aged under 25 years (%) 17.9 17.7 16.8 15.5 17.8 15.3 14.6 Source
Brazilian Institute of Geography and Statistics - IBGE, National Household Sample Survey 2001/2012.Footnotes
1. Revised data, according the last population estimate.
2. Population 15 years old and older.
(1) Excluding the rural population of the States of Rondonia, Acre, Amazonas, Roraima, Para and Amapa in the year 2001.
(2) Industry activities: manufacturing, mining and quarrrying, electricity, gas and water supply.
Table 3.2.2 - Selected Data on Economically Active Population - Russia - 2000/2013
2000 2005 2006 2007 2008 2009 2010 2011 2012 2013 Economically active population (million persons) 72.8 73.6 74.4 75.3 75.7 75.7 75.5 75.8 75.7 75.5 Employed population (million persons) 65.1 68.3 69.2 70.8 71.0 69.4 69.9 70.9 71.5 71.4 Age (%) 15 to 24 years 12.2 11.7 11.3 11.2 11.6 10.9 10.4 10.1 9.0 9.2 25 to 59 years 82.8 84.6 85.2 85.0 84.5 85.0 85.4 85.4 86.4 86.1 60 years and older 5.0 3.8 3.6 3.8 3.9 4.1 4.2 4.5 4.6 4.7 Sector (million persons) Agriculture, forestry and fishing 14.5 10.1 9.9 8.9 8.5 8.3 7.7 7.7 7.3 7.0 Industry (1) 24.1 22.9 22.8 22.2 21.4 20.5 20.5 20.2 20.3 20.2 Construction 5.1 6.7 6.5 7.0 7.6 7.1 7.2 7.2 7.4 7.6 Trade 12.3 15.2 15.3 15.6 15.2 15.2 15.6 15.9 16.1 16.1 Services (2) 37.7 41.8 42.1 42.9 43.6 45.1 45.1 45.0 45.0 45.1 Other (3) 6.3 3.3 3.5 3.5 3.7 3.9 3.9 4.0 3.9 4.1 Unemployed population (million persons) 7.7 5.2 5.3 4.5 4.7 6.3 5.5 4.9 4.1 4.1 Unemployed urban population (million persons) 5.8 3.4 3.2 2.7 3.0 4.2 3.6 3.2 2.6 2.6 Unemployment rate (%) 10.6 7.1 7.1 6.0 6.2 8.3 7.3 6.5 5.5 5.5 Urban unemployment rate (%) 10.7 6.1 5.7 4.7 5.2 7.4 6.3 5.5 4.5 4.6 Unemployment rate for population aged under 25 years (%) 20.7 15.5 16.4 14.4 14.0 18.5 16.9 15.2 14.8 13.8 Source
Federal State Statistics Service of the Russian Federation, Sample Survey on Employment.Footnotes
(1) Including Energy.
(2) Including: hotels and restaurant; transport and communication; financial activity; real estate, renting and business activities; public administration and defence; social security; education; health and social work; other community, social and personal service activities.
(3) Including activities of households and activities of extraterritorial organisations.
Table 3.2.3 - Selected Data on Economically Active Population - India - 2000/2012
2000 2005 2006 2008 2010 2012 Economically active population (million persons) 373.6 417.9 412.7 416.8 408.4 429.9 Employed population (million persons) 365.4 408.2 402.9 407.5 400.0 420.5 Age (million persons) 15 to 24 years 75.8 84.4 81.6 77.1 68.8 67.8 25 to 59 years 255.5 288.8 286.4 295.4 296.8 316.7 60 years and older 24.6 27.5 28.0 29.8 30.1 32.9 Sector (million persons) Agriculture, forestry and fishing 225.6 238.8 233.7 233.5 212.8 205.6 Mining and quarrying 2.1 2.5 2.4 2.0 2.4 2.3 Manufacturing 39.1 47.8 48.8 46.9 44.0 53.0 Electricity, gas, water etc. 1.1 1.2 1.2 1.2 1.2 2.2 Construction 15.8 22.9 23.4 26.1 38.4 44.6 Trade, hotel and restaurant 35.8 42.0 40.3 42.0 43.2 46.1 Transport, storage and communication 12.9 15.5 16.5 17.1 17.2 20.3 Other services 33.5 38.0 36.3 38.7 41.2 46.5 Unemployment rate (%) 2.2 2.3 2.4 2.2 2.0 2.2 Urban unemployment rate (%) 4.7 4.5 4.8 4.1 3.4 3.4 Source
Ministry of Statistics and Programme Implementation, NSS Survey Reports: Employment and Unemployment Situation in India (various issues).Footnotes
1. The information is based on Sample Surveys conducted by National Sample Survey Office & pertains to the Survey Period July (Previous Year) to June (Year Indicated in the table).
2. The information is based on Usual Activity Status taking into account both Principal & Subsidiary activity.
Table 3.2.4 - Selected Data on Economically Active Population - China - 2000/2013
2000 2006 2007 2008 2009 2010 2011 2012 2013 Employed population (million persons) (1) 720.9 749.8 753.2 755.6 758.3 761.1 764.2 767.0 769.8 Age (%) (1) 16 to 24 years 15.9 12.4 11.9 12.1 12.4 14.3 13.4 12.0 11.4 25 to 59 years 77.8 79.4 79.5 79.1 78.7 78.2 78.7 79.1 79.3 60 years and older 6.4 8.2 8.7 8.9 8.9 7.5 7.9 8.9 9.3 Sector (million persons) (1) Agriculture, forestry and fishing 360.4 319.4 307.3 299.2 288.9 279.3 265.9 257.7 241.7 Industry (2) 162.2 188.9 201.9 205.5 210.8 218.4 225.4 232.4 231.7 Services 198.2 241.4 244.0 250.9 258.6 263.3 272.8 276.9 296.4 Unemployment in urban areas (million persons) 6.0 8.5 8.3 8.9 9.2 9.1 9.2 9.2 9.3 Unemployment rate in urban areas (%) 3.1 4.1 4.0 4.2 4.3 4.1 4.1 4.1 4.1 Sources
a) National Bureau of Statistics of the People's Republic of China, China Statistical Yearbook 2001-2013 and Statistical Communique of the People's Republic of China on the 2013 National Economic and Social Development.
b) Ministry of Human Resources and Social Security of the People's Republic of China.Footnotes
(1) The total number of employed persons since 2001 are revised according to the 6th National Population Census.
(2) Including Energy and Construction.
Table 3.2.5 - Selected Data on Economically Active Population - South Africa - 2000/2012
2000 2006 2007 2008 2009 2010 2011 2012 Economically active population (million persons) (1) 16.1 17.3 17.3 18.0 17.7 17.4 17.7 18.1 Employed population (million persons) 12.3 13.4 13.5 13.9 13.5 13.1 13.3 13.5 Age (%) 15 to 24 years 12.9 11.6 11.4 12.0 11.0 10.0 9.8 9.4 25 to 59 years 84.4 85.5 85.8 85.4 86.4 87.4 87.6 88.2 60 to 64 years 2.8 2.9 2.8 2.6 2.6 2.6 2.5 2.4 Sector (million persons) Agriculture, forestry and fishery 1.4 0.9 0.7 0.8 0.7 0.6 0.6 0.7 Industry (2) 0.1 0.1 0.1 0.1 0.1 0.1 0.1 0.1 Construction 0.7 1.0 1.1 1.2 1.1 1.1 1.1 1.0 Trade 2.9 3.5 3.3 3.2 3.0 2.9 3.0 3.0 Services 2.1 2.4 2.5 2.6 2.7 2.7 2.8 3.0 Other 5.2 5.6 5.8 6.0 5.9 5.6 5.7 5.7 Unemployed population (million persons) 3.7 3.9 3.9 4.1 4.2 4.3 4.5 4.5 Unemployment rate (%) 23.3 22.6 22.3 22.9 23.9 24.9 24.9 25.1 Unemployment rate for population aged under 25 years (%) 45.0 46.7 46.5 45.5 48.2 50.5 49.8 51.1 Source
Statistics South Africa, Labour Force Survey (Statistical Release P0210) and Quarterly Labour Force Survey (Statistical Release P0211).Footnotes
(1) 2000 data are for the September wave only (not annual figures) since the March wave was a pilot.
(2) Including Energy.
General notes
1 Economically Active Population (Labour Force): Persons who were either 'working' (or employed) or 'seeking or available for work' (or unemployed) constituted the labour force. This is for a particular reference period. 2 Unemployment Rate (UR):UR is defined as the number of persons unemployed per 1000 in the labour force(which includes both employed and unemployed) 3 Workers (or employed): Persons who were engaged in any economic activity or who, despite their attachment to economic activity, abstained from work for reasons of illness, injury or other physical disability, bad weather, festivals, social or religious functions or other contingencies necessitating temporary absence from work, constituted workers. Unpaid helpers who assisted in the operation of an economic activity in the household farm or non farm activities were also considered as workers. 4 Activity status, Labour Force, Employment, Unemployment: It is the activity situation in which a person was found during a reference period with regard to the person to the person's participation in economic and non-economic activities. According to this, a person could be in one or a combination of the following three broad activity statuses during reference period:
(i) Working or being engaged in economic activity (work)
(ii) Being not engaged in economic activity (work) but either making tangible efforts to seek 'work 'or being available for 'work' if 'work ' is available and
(iii) Being not engaged in any economic activity (work) and also not available for (work)
Broad activity statuses mentioned in (i) and (ii) above are associated with 'being in labour force' and the last with 'not being in the labour force'. Within the labour force, broad activity status ( i) and (ii) were associated with 'employed' and 'unemployed' respectively.
Brazil
Reference Week is the last complete week of September each year. Work - It was considered as work in the exercise of economic activity:
a) Occupation paid in cash, products, goods or benefits (housing, food, clothes etc.) in the production of goods and services:
b) Occupation paid in cash or benefits (housing, food, clothes etc) in domestic services.
c) Occupation without pay in the production of goods and services, performed at least one hour per week
- Helping a member of the household who had work as: employee in the production of primary goods (which includes the activities of agriculture, forestry, livestock, vegetable or mineral extraction, hunting, fishing and fish farming): or own account or employer in any activity.
- Helping in a religious, charitable or cooperative institute or
- As apprentice or trainee, ord) Occupation developed for at least one hour per week:
- In the production of goods ,of the branch that includes the activities of agriculture, forestry, livestock, vegetal extraction, fishing and fish farming, for own consumption or for at least one member of household consumption, or
- Construction of buildings, private roads, wells and other improvements (except only repairs work) for their own use or for the use of at least one member of the household.Employed Person who performed some work during al or part of the reference week. It is also included as employed persons who have not exercised their paid work during the reference week due to vacation, leave, strike etc. Unemployed Person without work which had taken specific action to seek work (getting in touch with employers; enrolling or going in for official examination for a government job; registration at employment agency, union or similar body, placing or answering job advertisement; seeking assistance of relative, friend or colleague; taking an action to start business; etc.) in the reference week. Russia
Data on economically active population are presented in accordance with the standards of the International Labour Organization.The number of economically active population includes data on employed and unemployed based on the results of employment population surveys. The monitoring of economically active population is carried out for persons of 15 - 72 years old. India
The National Sample Survey Office, Ministry of Statistics & Programme Implementation carries out survey on the subject of emplyment and umployment and labour force characterstics at the National and State levels.
The Survey is conducted Quinquiennially along with some annual surveys in between. The Reference Period is usually July to June. However some surveys were conducted in six months. The Report includes status based on Usual Activity (Reference Period 365 days), Current Weekly Status ( Reference Period 7 days)& Current Daily Status ( Reference Period 1 day).
Usual Principal Activity Status - The usual activity status refers to the activity status of a person during the reference period of 365 days preceding the date of the survey. The activity status on which a person spent relatively longer time during the 365 days is considered as the usual principal activity status of the person. Usual Subsidiary Economic Activity Status - A person whose usual principal status was determined on the basis of the major time criterion could have pursued some economic activity for a shorter time throughout the reference year of 365 days preceding the date of survey or for a minor period, which is not less than 30 days, during the reference year. The status in which such economic activity was pursued was the subsidiary economic activity status of that person. Usual Activity Status Considering Principal and Subsidiary Status Taken Together - The usual status, determined on the basis of the usual principal activity and usual subsidiary economic activity of a person taken together, is considered as the usual activity status of the person and is written as usual status (ps+ss). According to the usual status (ps+ss), workers are those who perform some work activity either in the principal status or in the subsidiary status. Thus, a person who is not a worker in the usual principal status is considered as worker according to the usual status (ps+ss), if the person pursues some subsidiary economic activity for 30 days or more during 365 days preceding the date of survey. Unemployed: Persons, who owing to lack of work, had not worked but either sought work through employment exchanges, intermediaries, friends or relatives or by making applications to prospective employers or expressed their willingness or availability for work under the prevailing conditions of work and remuneration, were considered as those who were 'seeking or available for work' or unemployed Labor Bureau, Ministry of Labor, has also started conducting Annual Surveys on Employment & Unemployment in India since 2010-11.
China
Employed Persons refer to persons aged 16 and over who are engaged in gainful employment and thus receive remuneration payment or earn business income. This indicator reflects the actual utilization of total labour force during a certain period of time and is often used for the research on China's economic situation and national situation. Registered Unemployed Persons in Urban Areas refer to the persons with non-agricultural household registration at certain working ages (16 years old to retirement age), who are capable of working, unemployed and willing to work, and have been registered at the local employment service agencies to apply for a job. Registered Unemployment Rate in Urban Areas refers to the ratio of the number of the registered unemployed persons to the sum of the number of persons employed in various units (minus the employed rural labour force, re-employed retirees, and Hong Kong, Macao, Taiwan or foreign employees), laid-off staff and workers in urban units, owners of private enterprises in urban areas, owners of self-employed individuals in urban areas, employees of private enterprises in urban areas, employees of self-employed individuals in urban areas, and the registered unemployed persons in urban areas.
Table 4.1 - Summary of National Accounts on BRICS Countries - 2000/2013
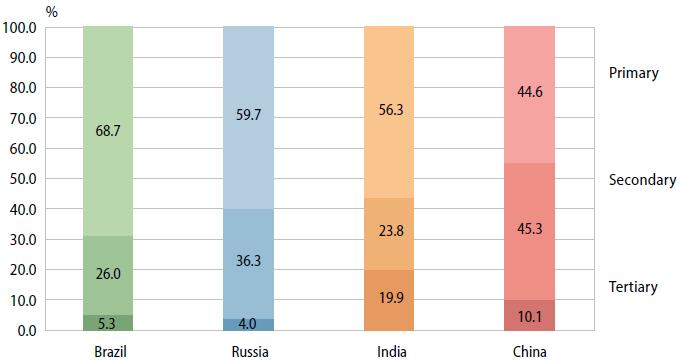
2000 2006 2007 2008 2009 2010 2011 2012 2013 Gross domestic product (GDP) (current prices/billion US$) Brazil (1) (2) 645 1 089 1 367 1 653 1 622 2 142 2 474 2 247 2 246 Russia (3) 260 990 1 300 1 661 1 223 1 525 1 896 1 990 2 096 India 460 950 1 241 1 224 1 367 1 707 1 873 1 873 1 871 China (4)(5) 1 198 2 713 3 496 4 522 4 991 5 931 7 325 8 229 (6)9 185 South Africa 133 261 285 274 285 363 402 382 .... Per capita GDP (current prices/US$) Brazil (1) (2) 3 716 5 813 7 213 8 631 8 380 10 959 12 533 11 280 11 171 Russia (3) 1 772 6 948 9 145 11 700 8 616 10 678 13 261 13 894 14 604 India 451 847 1 090 1 061 1 168 1 439 1 558 1 539 1 518 China (4) 949 2 070 2 653 3 414 3 749 4 434 5 450 6 039 (6)6 768 South Africa 3 034 5 381 5 807 5 484 5 651 7 114 7 810 ... ... GDP growth rate (change from the preceding year) (%) Brazil (1) (2) 4.3 4.0 6.1 5.2 -0.3 7.5 2.7 1.0 2.5 Russia (3) 10.0 8.2 8.5 5.2 -7.8 4.5 4.3 3.4 1.3 India (7) 7.8 16.6 15.9 15.7 15.2 18.7 15.8 11.9 12.3 China 8.4 12.7 14.2 9.6 9.2 10.4 9.3 7.7 (6)7.7 South Africa 4.2 5.6 5.5 3.6 -1.5 3.1 3.5 ... ... Share of primary industry to GDP (%) Brazil (1) (2) 5.6 5.5 5.6 5.9 5.6 5.3 5.5 5.3 5.7 Russia (3) ... 4.6 4.4 4.4 4.6 3.9 4.4 4.0 4.0 India (8) 25.7 21.0 21.0 20.4 20.3 21.0 20.5 19.9 20.5 China 15.1 11.1 10.8 10.7 10.3 10.1 10.0 10.1 (6)10.0 South Africa 10.8 11.3 11.8 12.7 11.9 11.8 12.3 ... ... Share of secondary industry to GDP (%) Brazil (1) (2) 27.7 28.8 27.8 27.9 26.8 28.1 27.5 26.0 25.0 Russia (3) ... 37.2 36.4 35.9 33.7 34.8 37.1 36.3 35.7 India (9) 23.8 26.1 26.3 25.7 25.2 24.3 24.6 23.8 22.6 China 45.9 47.9 47.3 47.4 46.2 46.7 46.6 45.6 (6)43.9 South Africa 24.2 22.7 22.5 22.6 22.0 20.6 19.4 ... ... Share of tertiary industry to GDP (%) Brazil (1) (2) 66.7 65.8 66.6 66.2 66.7 66.6 67.0 68.7 69.3 Russia (3) ... 58.2 59.2 59.7 61.7 61.4 58.5 59.7 60.3 India (10) 50.5 52.9 52.7 53.9 54.5 54.6 54.9 56.3 57.0 China 39.0 40.9 41.9 41.8 43.4 43.2 43.4 44.6 (6)46.1 South Africa 64.9 66.0 65.7 64.7 66.1 67.6 68.3 ... ... Sources
Brazil
Brazilian Institute of Geography and Statistics - IBGE, National Accounts System 2000-2013.Russia
Federal State Statistics Service of the Russian Federation.India
Ministry of Statistics and Programme Implementation, Central Statistics Office, National Accounts Statistics 2008-2013; Press Release of CSO on First Revised Estimates of National Income, Consumption Expenditure, Saving and Capital Formation 2012-2013; and Advance Estimates of National Income and Expenditures on GDP 2013-2014.
Foreign Exchange Rates have been taken from Reserve Bank of India (RBI)/FEDAI (Foreign Exchange Dealer's Association of India)China
National Bureau of Statistics of the People's Republic of China.South Africa
Statistics South Africa and South African Reserve Bank.Footnotes
Brazil
The annual average exchange rates used are available in Tables 13.2.1 and 14.1.
(1) Data for 2010, 2011, 2012 and 2013 are derived from quarterly GDP results.
(2) Data of 2010, 2011, 2012 and 2013 are preliminary estimation.Russia
(3) Data for 2012 and 2013 are preliminary.India
All Information for India pertains to Financial Year i.e. April of Year mentioned in the table above to March of next year. Information for GDP and per capita GDP pertains to current market price.
Annual avearge Dollar - Rs Exchange Rate for the Financial Year has been used in all calculations.
Data for 2000 relates to old base year 1999-2000 Prices while that for 2006 and onwards relates to new base year 2004-05 Prices. Data for 2013 is Advance Estimate whereas that for 2012, 11 & 10 are first , second and third revised estimates respectively.
(7) GDP at Factor Cost, Current Prices has been used for calculating GDP Growth Rate.
(8) Primary Industry includes Agriculture, Forestry & Fishing and Mining & Quarrying . The share of GDP relates to factor cost at current prices.
(9) Secondary Industry includes Manufacturing, Electricity Gas & Water Supply and Construction. The share of GDP relates to factor cost at current prices.
(10) Tertiary Industry includes other industries of national economy. The share of GDP relates to factor cost at current prices.China
(4) GDP and Per Capita GDP in US dollars are converted using the annual average exchange rates.
(5) Data of GDP are calculated at producers' prices.
(6) Preliminary data.
Table 4.2.1 - Selected Data on National Accounts - Brazil - 2006-2013
2006 2007 2008 2009 2010(1) 2011(1) 2012(1) 2013(1) Gross domestic product (GDP) (current prices/billion R$) 2 369 2 661 3 032 3 239 3 770 4 143 4 392 48 45 Indices of GDP (preceding year = 100) (%) 104.0 106.1 105.2 99.7 107.5 102.7 101.0 102.5 GDP deflator (preceding year = 100) (%) 106.1 105.9 108.3 107.2 108.2 107.0 104.9 107.6 Growth rate of per capita GDP (%) 2.7 4.9 4.0 -1.4 6.5 1.7 0.1 1.6 Indices of gross fixed capital formation (preceding year = 100) (%) 109.8 113.9 113.6 93.3 121.3 104.7 96.0 105.2 Components of GDP by production approach (current prices/billion R$) 2 369 2 661 3 032 3 239 3 770 4 143 4 392 4 845 Primary industry 112 127 153 157 171 193 198 235 Secondary industry 585 636 720 750 906 972 969 1 027 Tertiary industry 1 338 1 524 1 708 1 887 2 150 2 366 2 558 2 849 Net taxes on products (billion R$) 335 373 452 445 543 612 667 734 Components of GDP by expenditure approach (current prices/billion R$) 2 369 2 661 3 032 3 239 3 770 4 134 4 392 4 845 Final consumption expenditures 1 904 2 133 2 399 2 667 3 046 3 356 3 686 4 098 Gross fixed capital formation 389 464 580 585 734 799 798 881 Inventory 7.7 23.6 47.6 -7.0 29.0 19.0 -28.5 -14.0 Net exports of goods and services 68.8 40.5 5.8 -5.0 -39.0 -30.0 -63.5 -120.3 Final consumption rate (%) 80.3 80.2 79.1 82.3 80.8 81.0 83.9 84.5 Gross capital formation rate (%) 16.8 18.3 20.7 17.8 20.2 19.7 17.5 18.0 Source
Brazilian Institute of Geography and Statistics - IBGE, National Accounts System 2000-2013.Footnotes
1. The Annual average exchange rates used is available in Tables 14.2.1 and 15.1.
(1) Data derived from quarterly GDP results. Preliminary estimation.
Table 4.2.2 - Selected Data on National Accounts - Russia - 2000/2013
2000 2004 2006 2007 2008 2009 2010 2011 2012 2013(1) Gross domestic product (GDP) (current prices/billion Rub) 7 305.6 17 027.2 26 917.2 33 247.5 41 276.8 38 807.2 46 308.5 55 644.0 61 810.8 66 689.1 Indices of GDP (preceding year = 100) (%) 110.0 107.2 108.2 108.5 105.2 92.2 104.5 104.3 103.4 101.3 GDP deflator (preceding year = 100) (%) 137.6 120.3 115.2 113.8 118.0 102.0 114.2 115.2 107.4 106.5 Growth rate of per capita GDP (preceding year = 100) (%) (2) 110.5 107.6 108.5 108.7 105.3 92.2 104.5 104.2 103.3 101.1 Indices of gross fixed capital formation (preceding year = 100) (%) 118.1 112.6 118.0 121.0 110.6 85.6 105.9 109.1 106.4 99.7 Components of GDP by production approach (billion Rub) Total (2) ... 14 858.8 22 977.3 28 484.5 35 182.7 33 831.3 40 040.1 47 395.7 52 620.2 66 522.8 Primary industry ... 835.1 1 039.4 1 256.4 1 549.3 1 585.1 1 548.5 2 088.4 2 085.7 2 277.7 Secondary industry ... 5 398.0 8 554.4 10 380.6 12 707.9 11 381.0 13 892.4 17 539.0 19 147.8 24 043.2 Tertiary industry ... 8 625.7 13 383.6 16 847.5 20 925.5 20 865.3 24 599.2 27 768.3 31 386.6 40 201.9 Components of GDP by expenditure approach (billion Rub) Final consumption expenditures 4 476.8 11 477.9 17 809.7 21 968.6 27 543.5 29 269.6 32 514.6 37 529.4 42 931.1 47 734.8 Gross fixed capital formation 1 232 ,0 3 130.5 4 980.6 6 980.4 9 200.8 8 535.7 10 014.3 11 950.5 13 603.7 14 316.4 Inventory 133.7 428.4 718.2 1 053.7 1 325.3 -1 190.9 458.3 2 032.2 1 626.4 1 168.0 Net exports of goods and services 1 463.1 2 086.5 3 425.9 2 866.6 3 812.6 2 887.7 3 739.7 4 776.5 4 565.0 3 762.7 Final consumption rate (%) 61.3 67.0 66.1 66.8 65.9 74.1 69.6 66.8 68.3 71.2 Gross capital formation rate (%) 18.6 18.4 18.5 21.2 22.0 21.7 21.4 21.2 21.7 21.4 Source
Federal State Statistics Service of the Russian Federation.Footnotes
(1) Provisional data.
(2) Gross value added by economic activity at basic prices.
Table 4.2.3 - Selected Data on National Accounts - India - 2000-2014
2000 2006 2007 2008 2009 2010 2011 2012 2013 GDP at market prices (current prices/10 000 000 ₹) 2 102 314.0 4 294 706.0 4 987 090.0 5 630 063.0 6 477 827.0 7 784 115.0 9 009 722.0 10 113 281.0 11 320 463.0 GDP at factor cost (current prices) 1 925 017.0 3 953 276.0 4 582 086.0 5 303 567.0 6 108 903.0 7 248 859.0 8 391 691.0 9 388 876.0 10 539 605.0 GNI at factor cost (current prices) 1 902 284.0 3 920 042.0 4 561 574.0 5 270 644.0 6 070 903.0 7 167 053.0 8 314 861.0 9 272 110.0 10 411 105.0 GDP at factor cost (constant prices) 1 864 300.0 3 564 364.0 3 896 636.0 4 158 676.0 4 516 071.0 4 918 533.0 5 247 530.0 5 482 111.0 5 748 564.0 Per capita GDP at factor cost (current prices/ ₹) 18 891.2 35 234.0 40 264.0 45 958.0 52 213.0 61 120.0 69 814.0 77 148.0 85 479.0 Per capita GDP at market prices (current prices/ ₹) 20 631.1 38 277.2 43 823.3 48 787.4 55 366.0 65 633.3 74 956.1 83 100.1 91 812.4 GDP at constant prices (preceding year = 100) (%) 104.4 109.6 109.3 106.7 108.6 108.9 106.7 104.5 104.9 Growth rate of per capita GDP (factor cost, constant prices) (%) 2.2 8.0 7.8 5.2 7.1 7.4 5.3 3.2 3.5 Components of GDP (at factor cost) by production approach (current prices/10 000 000 ₹) Primary industry 495 271.0 829 771.0 961 330.0 1 083 032.0 1 242 818.0 1 524 552.0 1 721 814.0 1 867 342.0 2 157 404.0 Secondary industry 458 431.0 1 033 410.0 1 205 458.0 1 360 426.0 1 536 492.0 1 763 584.0 2 061 650.0 2 238 029.3 2 378 224.0 Tertiary industry 971 315.0 2 090 095.0 2 415 298.0 2 860 109.0 3 329 593.0 3 960 723.0 4 608 227.0 5 283 505.0 6 003 978.0 Components of GDP by expenditure approach (current market price/10 000 000 ₹) Final consumption expenditure(1) 1 604 362.0 2 920 144.0 3 353 748.0 3 864 617.0 4 478 717.0 5 250 459.0 6 167 791.0 6 961 191.0 7 841 338.0 Gross capital formation 511 788.0 1 531 433.0 1 900 762.0 1 931 380.0 2 363 132.0 2 841 457.0 3 200 633.0 3 521 399.0 ... Gross fixed capital formation 477 818.0 1 343 774.0 1 641 673.0 1 821 099.0 2 055 772.0 2 407 069.0 2 861 062.0 3 071 543.0 3 221 566.0 Change in stocks 15 467.0 147 101.0 201 534.0 106 791.0 179 171.0 273 509.0 170 596.0 171 184.0 188 474.0 Final consumption rate (%) 76.3 68.0 67.2 68.6 69.1 67.5 68.5 68.8 69.3 Gross capital formation rate (%) 24.3 35.7 38.1 34.3 36.5 36.5 35.5 34.8 ... Net exports of goods and services (10 000 000 ₹) - 19 397 - 135 663 -200 202.0 -285 275.0 -348 359.0 -339 989.0 -571 621.0 -681 623.0 -435 075.0 Gross domestic savings (current prices/10 000 000 ₹) 499 033.0 1 485 909.0 1 836 332.0 1 802 620.0 2 182 338.0 2 621 742.0 2 824 459.0 3 043 474.0 ... Population (10 000 000) 101.9 112.2 113.8 115.4 117.0 118.6 120.2 121.7 123.3 Exchange rate US$/ average 45.7 45.2 40.2 46.0 47.4 45.6 48.1 54.0 60.5 Source
Ministry of Statistics and Programme Implementation, Central Statistics Office, National Accounts Statistics 2008-2013; Press Release of CSO on First Revised Estimates of National Income, Consumption Expenditure, Saving and Capital Formation 2012-2013; and Advance Estimates of National Income and Expenditures on GDP 2013-2014.Footnotes
1. All Information pertains to Financial Year i.e. April of Year mentioned in the table above to March of next year.
2. Data for 2000 relates to old base year 1999-2000 prices while that for 2006 and onwards relates to new base year 2004-05 prices.
3. Data for 2013 is advance estimate whereas that for 2012, 2011 and 2010 are first, second and third revised estimates respectively.
(1) Includes private and government final consumption expenditure.
(2) Does not include valuables.
Table 4.2.4 - Selected Data on National Accounts - China - 2000/2013
2000 2006 2007 2008 2009 2010 2011 2012 2013(1) GDP (current Prices/billion RMB) 9 921.5 21 631.4 26 581.0 31 404.5 34 090.3 40 151.3 47 310.4 51 947.0 56 884.5 GNI (current prices/billion US$)(2) 1 183.8 2 708.4 3 503.7 4 550.4 4 982.0 5 905.3 7 254.6 8 209.4 9 141.2 Indices of GDP (constant prices/ preceding year = 100) (%) 108.4 112.7 114.2 109.6 109.2 110.4 109.3 107.7 107.7 Growth rate of per capita GDP (%) 7.6 12.0 13.6 9.1 8.7 9.9 8.8 7.1 7.1 Components of GDP by production approach (current prices/billion RMB) (3) Total 9 921.5 21 631.4 26 581.0 31 404.5 34 090.3 40 151.3 47 310.4 51 947.0 56 884.5 Primary industry 1 494.5 2 404.0 2 862.7 3 370.2 3 522.6 4 053.4 4 748.6 5 237.4 5 695.7 Secondary industry 4 555.6 10 372.0 12 583.1 14 900.3 15 763.9 18 738.3 22 041.3 23 516.2 24 968.4 Industry 4 003.4 9 131.1 11 053.5 13 026.0 13 524.0 16 072.2 18 847.0 19 967.1 21 068.9 Construction 552.2 1 240.9 1 529.6 1 874.3 2 239.9 2 666.1 3 194.3 3 549.1 3 899.5 Tertiary industry 3 871.4 8 855.5 11 135.2 13 134.0 14 803.8 17 359.6 20 520.5 23 193.4 26 220.4 Transport, storage and post 616.1 1 218.3 1 460.1 1 636.3 1 672.7 1 913.2 2 243.3 2 466.0 2 728.3 Wholesale and retail trades 815.9 1 653.1 2 093.8 2 618.2 2 898.4 3 574.6 4 344.5 4 939.4 5 567.2 Hotels and catering services 214.6 479.3 554.8 661.6 711.8 806.8 917.3 1 046.4 1 149.4 Financial intermediation 408.7 809.9 1 233.8 1 486.3 1 776.8 2 098.1 2 495.8 2 872.3 3 353.5 Real estate 414.9 1 037.0 1 381.0 1 473.9 1 865.5 2 278.2 2 678.4 2 936.0 3 329.5 Others 1 401.2 3 657.9 4 411.8 5 257.7 5 878.6 6 688.7 7 841.2 8 933.3 10 092.5 Components of GDP by expenditure approach (current prices/billion RMB) Total 9 874.9 22 271.3 26 659.9 31 597.5 34 877.5 40 281.6 47 261.9 52 939.9 58 667.3 Final consumption expenditure 6 151.6 11 310.4 13 223.3 15 342.2 16 927.5 19 411.5 23 211.2 26 199.4 29 216.6 Gross fixed capital formation 3 384.4 8 795.4 10 394.9 12 808.4 15 668.0 18 361.5 21 568.2 24 175.7 26 907.6 Change in inventories 99.8 500.0 699.5 1 024.1 778.3 998.9 1 266.2 1 101.6 1 128.1 Net exports of goods and services 239.0 1 665.5 2 342.3 2 422.7 1 503.7 1 509.8 1 216.3 1 463.2 1 415.1 Final consumption rate (%) 62.3 50.8 49.6 48.6 48.5 48.2 49.1 49.5 49.8 Capital formation rate (%) 35.3 41.7 41.6 43.8 47.2 48.1 48.3 47.7 47.8 Sources
National Bureau of Statistics of the People's Republic of China.Footnotes
(1) Preliminary data.
(2) GNI in US dollars are converted using the annual average exchange rates.
(3) The components of GDP by production approach are calculated at producers' prices.
Table 4.2.5 - Selected Data on National Accounts - South Africa - 2000/2013
2000 2006 2007 2008 2009 2010 2011 2012 2013 GDP (current prices/billion ZAR) 922.0 1 767.0 2 016.0 2 256.0 2 408.0 2 674.0 2 933.0 3 139.0 (1) 3 385.0 Indices of GDP (year 2005 = 100) (%) (2) 82.9 105.6 111.5 115.5 113.7 117.3 121.5 124.5 ... GDP deflator (year 2005 = 100) (%) (2) 70.8 106.5 115.1 124.4 134.8 145.1 153.6 160.4 ... Growth rate of per capita GDP (%) 2.1 4.2 4.3 2.4 -2.7 1.5 ... ... ... Indices of gross fixed capital formation (year 2005 = 100) (billion US$) 68.0 112.1 127.8 145.8 142.6 ... ... ... ... Components of GDP by production approach (billion ZAR) 922.0 1 767 2 016 2 256.0 2 408.0 2 674.0 2 933.0 3 139.0 3 385.0 Primary industry (3) 91.0 178.0 211.0 257.0 260.0 291.0 340.0 341.0 352.0 Secondary industry (4) 203.0 358.0 403.0 459.0 479.0 501.0 509.0 531.0 556.0 Tertiary industry (5) 544.0 1 037.0 1 178.0 1 312.0 1 441.0 1 632.0 1 786.0 1 948.0 2 122.0 Components of GDP by expenditures approach (billion ZAR) 922.0 1 767.0 2 016.0 2 263.0 2 398.0 2 661.0 ... ... ... Final consumption expenditures 752.0 1 464.0 1 645.0 1 827.0 1 962.0 ... ... ... ... Gross fixed capital formation 138.0 324.0 406.0 525.0 532.0 ... ... ... ... Inventory 7.0 24.0 22.0 -12.0 -62.0 ... ... ... ... Net exports of goods and services 27.0 -43.0 -55.0 -69.0 -21.0 ... ... ... ... Final consumption rate (%) 81.5 82.8 81.6 80.3 81.9 ... ... ... ... Gross capital formation rate (%) 15.7 19.7 21.2 22.5 19.6 ... ... ... ... Source
Statistics South Africa and South African Reserve Bank.Footnotes
(1) Data for 2013 is derived from quarterly GDP results.
(2) Base year 2005 = 100
(3) Primary industries = Agriculture, forestry and fishing and Mining and quarrying
(4) Secondary industries = Manufacturing; Electricity, gas and water and Construction
(5) Tertiary industries = Wholesale, retail and motor trade,catering and accommodation; Transport, storage and communication; Finance, real estate and business services. General government and Personal services.
Graph 4.1 (a) - Gros Domestic Product - GDP - 2007-2013
Click to enlargeSource: Summary Table of Chapter 4, BRICS Joint Statistical Publication 2014.
Graph 4.1 (b) - Per Capita GDP - 2000/2012
Click to enlargeSource: Summary Table of Chapter 4, BRICS Joint Statistical Publication 2014.
Graph 4.1 (c) - Share of GDP in Different Sectors - 2012
Click to enlargeSource: Summary Table of Chapter 4, BRICS Joint Statistical Publication 2014.
Explanatory Notes
General
National product by definition is a measure in monetary terms of the volume of all goods and services produced by an economy during a given period of time, accounted without duplication. The measure obviously has to be in value terms as the different units of production and different measures of services are not directly added. In the case of a closed economy the measure amounts to domestic product. (Gross Domestic Product)Gross National Income (GNI)
The economy of India is not closed as there are transactions with rest of the world in the form of exports, imports, loans etc. This gives rise to the concept of national or domestic. Gross Domestic Product refers to production of all resident units within the borders of a country, which is not exactly same as the production of all productive activities of residents. Some of the productive activities of residents may take place abroad. Conversely, some production taking place within a country may be attributed to temporary and seasonal foreign labour.
GNI = GDP + compensation of employees and property income receivable from the rest of the world - compensation of employees and property income payable to the rest of the world
The household consumption expenditure referred to as private final consumption expenditure (PFCE) in National Accounts Statistics (NAS), consists of expenditure by households (including non-profit institutions) on non-durable consumer goods and services and all durable goods except land and buildings.Government final consumption expenditure
Government final consumption expenditure comprises the compensation of employees and purchases of goods and services by the government including purchases abroad. Compensation of employees of general government consists of wages and salaries and social security contribution.Primary Industry Agriculture, Forestry, Animal Husbandry and Fishery and Mining. Secondary Industry Manufacturing, Electricity, gas and water and Construction. Tertiary Industry The other industries of national economy. Brazil
Expenditure measure of GDP
The expenditure measure of gross domestic product (GDP) is derived as the sum of expenditure on final consumption plus gross capital formation plus exports less imports.Gross fixed capital formation in a particular category of fixed asset consists of the value of producers' acquisitions of new and existing products of this type less the value of their disposals of fixed assets of the same type. Gross fixed capital formation is measured by the total value of a producer's acquisitions, less disposals, of fixed assets during the accounting period plus certain specified expenditure on services that adds to the value of non-produced assets. Gross capital formation shows the acquisition less disposal of produced assets for purposes of fixed capital formation, inventories or valuables. Expenditures on goods and services are defined as the values of the amounts that buyers pay, or agree to pay, to sellers in exchange for goods or services that sellers provide to them or to other institutional units designated by the buyers. Goods and services account The goods and services account shows the balance between the total goods and services supplied as resources to the economy as output and imports (including the value of taxes less subsidies on products not already included in the valuation of output) and the use of the same goods and services as intermediate consumption, final consumption, capital formation and exports. Final consumption expenditure is the amount of expenditure on consumption goods and services.
Household final consumption expenditure consists of the expenditure, including expenditure whose value must be estimated indirectly, incurred by resident households on individual consumption goods and services, including those sold at prices that are not economically significant and including consumption goods and services acquired abroad.
General government final consumption expenditure consists of expenditure, including expenditure whose value must be estimated indirectly, incurred by general government on both individual consumption goods and services and collective consumption services.
Final consumption expenditure of NPISHs consists of the expenditure, including expenditure whose value must be estimated indirectly, incurred by resident NPISHs on individual consumption goods and services and possibly on collective consumption services.Inventories are produced assets that consist of goods and services, which came into existence in the current period or in an earlier period, and that are held for sale, use in production or other use at a later date. Primary Industry: Agriculture, Forestry, Animal Husbandry and Fishery. Secondary Industry: Mining, Manufacturing, Electricity, Gas and Water and Construction. Tertiary Industry: The other industries of national economy. Russia
Primary Industry: Agriculture, Forestry, Animal Husbandry and Fishery. Secondary Industry: Mining, Manufacturing, Electricity, Gas and Water and Construction. Tertiary Industry: The other industries of national economy. Gross Domestic Product (GDP) at market prices is the final result of the production activity of all producer units within a country area. It may be estimated using three methods: production, use of incomes (or expenditure method) and GDP formation by income sources. GDP, measured by production method, is defined as a difference between total output of goods and services for the whole economy, on the one hand, and intermediate consumption, on the other, or otherwise as a sum of value added in the sectors of the economy. GDP, measured by the method of use of incomes, represents a sum of expenditures of all the institutional units - residents for final consumption, gross capital formation and net exports. GDP calculated on the basis of income sources reflects primary incomes accumulated in the process of production by all institutional units grouped by sectors of the economy. Final consumption expenditures comprise final consumption expenditures of households, final consumption expenditures of public administration on individual goods and services and collective services, final consumption expenditures of non-profit institutions serving of households. Gross Capital Formation indicates net acquisition by resident units of goods and services produced in the current period or imported, but not consumed in that period. Gross capital formation includes gross fixed capital formation, changes in inventories, as well as net acquisition of valuables. Net Exports of Goods and Services are calculated as a difference between exports and imports and include trade turnover of Russia with foreign countries. India
Central Statistics Office(CSO) in the Ministry of Statistics & PI compiles estimates of national accounts aggregates and publishes them in its annual publication called National Accounts Statistics. The estimates rae based on performance during the Financial year ( April- March (next year)). CSO brings out Quick Estimates in January for the preceding year along with revision of estimates for a few earlier financial years using detailed and more comprehensive data. CSO also compiles Advance Estimates for the current financial year and releases it two months before the close of the year. Various indices brought out by CSO include GDP, NDP, GNP, and NNP at factor cost and market prices, indirect taxes less subsidies, Consumption of Fixed Capital, Net National Disposable Income, Personal Disposable Income, Private Final Consumption Expenditure (PFCE) in the domestic market, Government Final Consumption Expenditure (GFCE), exports and imports, Gross Domestic Capital Formation, Net Domestic Capital Formation ,Savings etc.
The economy of India is not closed as there are transactions with rest of the world in the form of exports, imports, loans etc. This gives rise to the concept of national or domestic. Gross Domestic Product refers to production of all resident units within the borders of a country, which is not exactly same as the production of all productive activities of residents. Some of the productive activities of residents may take place abroad. Conversely, some production taking place within a country may be attributed to temporary and seasonal foreign labour.
GNI = GDP + compensation of employees and property income receivable from the rest of the world - compensation of employees and property income payable to the rest of the world
Final consumption Expenditure includes both Private Final Consumption Expenditure & Government Final Consumption Expenditure Private Final Consumption Expenditure: The household consumption expenditure referred to as private final consumption expenditure (PFCE) in National Accounts Statistics (NAS), consists of expenditure by households (including non-profit institutions) on non-durable consumer goods and services and all durable goods except land and buildings. Government final consumption expenditure Government final consumption expenditure comprises the compensation of employees and purchases of goods and services by the government including purchases abroad. Compensation of employees of general government consists of wages and salaries and social security contribution. Final Consumption Rate is total Final Consumption expenditure expressed as percent of Gross Domestic Product at Market Prices (Current Prices) Gross Capital Formation Rate is total Gross Capital Formation expressed as percent of Gross Domestic Product at Market Prices (Current Prices) Following categorization has been used for industrywise GDP estimates in case of India :
Primary Industry Agriculture, Forestry, Animal Husbandry and Fishery and Mining & Quarrying. Secondary Industry Manufacturing, Electricity, gas and water and Construction. Tertiary Industry The other industries of national economy. China
Gross Domestic Product (GDP) refers to the final products at market prices produced by all resident units in a country (or a region) during a certain period of time. In the practice of national accounting, GDP is calculated from three approaches, namely production approach, income approach and expenditure approach, which reflect GDP and its composition from different angles. Per Capita GDP = GDP / annual average population. Three Strata of Industry In China economic activities are categorized into the following three strata of industry: Primary industry refers to agriculture, forestry, animal husbandry and fishery and services in support of these industries. Secondary industry refers to mining and quarrying, manufacturing, production and supply of electricity, water and gas, and construction. Tertiary industry refers to all other economic activities not included in the primary or secondary industries. Indices of GDP measure the change of GDP at constant prices. GDP at constant prices converts GDP based on the current price into a value based on the price of the base period. When adjusted for price changes, the values of two different periods can be compared to reflect changes of both products and production activities. GDP by Expenditure Approach refers to the method of measuring the final results of production activities of a country (region) during a given period from the perspective of final uses. It includes final consumption expenditure, gross capital formation and net export of goods and services. The formula for computation is: GDP by expenditure approach = final consumption expenditure + gross capital formation + net export of goods and services. Final Consumption Expenditure refers to the total expenditure of resident units for purchases of goods and services from both the domestic economic territory and abroad to meet the needs of material, cultural and spiritual life. It does not include the expenditure of non-resident units on consumption in the economic territory of the country. The final consumption expenditure is broken down into household consumption expenditure and government consumption expenditure.
Gross Fixed Capital Formation refers to the value of acquisitions less those disposals of fixed assets during a given period. Fixed assets are the assets produced through production activities with unit value above a specified amount and which could be used for over one year. Natural assets are not included.Gross fixed capital formation can be categorized into total tangible fixed capital formation and total intangible fixed capital formation. Total tangible fixed capital formation includes the value of the construction projects and installation projects completed and the equipment, apparatus and instruments purchased (less those disposed) as well as the value of land improved, the value of draught animals, breeding stock and animals for milk, for wool and for recreational purposes and the newly increased forest with economic value. Total intangible fixed capital formation includes the prospecting of minerals and the acquisition of computer software minus the disposal of them. Changes in Inventories refer to the market value of the change in the physical volume of inventory of resident units during a given period, i.e. the difference between the values at the beginning and at the end of the period minus the gains due to the change in prices. The changes in inventories can have a positive or a negative value. A positive value indicates an increase in inventory while a negative value indicates a decrease in inventory. The inventory includes raw materials, fuels and reserve materials purchased by the production units as well as the inventory of finished products, semi-finished products and work-in-progress. Net Export of Goods and Services refers to the exports of goods and services subtracting the imports of goods and services. Exports include the value of various goods and services sold or gratuitously transferred by resident units to non-resident units. Imports include the value of various goods and services purchased or gratuitously acquired resident units from non-resident units. Because the provision of services and the use of them happen simultaneously, the acquisition of services by resident units from abroad is usually treated as import while the acquisition of services by non-resident units in this country is usually treated as export. The exports and imports of goods are calculated at FOB. Final Consumption Rate refers to final consumption expenditures as percentage of gross domestic product by expenditure approach. Gross Capital Formation Rate refers to gross capital formation as percentage of gross domestic product by expenditure approach. South Africa
Base year 2005=100 Primary industries = Agriculture, forestry and fishing and Mining and quarrying Secondary industries = Manufacturing; Electricity, gas and water and Construction Tertiary industries = Wholesale, retail and motor trade, catering and accommodation; Transport, storage and communication; Finance, real estate and business services. General government and Personal services.
Table 5.1 - Summary of Consumer Price Index from the Previous Year on BRICS Countries - 2000/2013
Consumer price indices (%)
2000 2003 2004 2005 2006 2007 2008 2009 2010 2011 2012 2013 Brazil 6.0 9.3 7.6 5.7 3.1 4.5 5.9 4.3 5.9 6.5 5.8 5.9 Russia 20.8 13.7 10.9 12.7 9.7 9.0 14.1 11.7 6.9 8.4 5.1 6.8 India(1) 4.0 3.7 3.6 4.3 6.0 6.5 8.4 10.6 12.1 9.1 8.9 11.1 China 0.4 1.2 3.9 1.8 1.5 4.8 5.9 -0.7 3.3 5.4 2.6 2.6 South Africa 5.3 5.8 1.4 3.4 4.7 7.1 11.5 7.1 4.3 5.0 5.6 5.7 Sources
Brazil
Brazilian Institute of Geography and Statistics - IBGE, National Consumer Price Indices 2000-2013.Russia
Federal State Statistics Service of the Russian Federation.India
Ministry of Labour and Employment, Labour Bureau.China
National Bureau of Statistics of the People's Republic of China.South Africa
Statistics South Africa.Footnotes
(1) The Consumer Prices pertain to Industrial Workers only and the information for 2000-2005 is based on base year 1982 whereas those for 2006 and after are based on base year 2001.
Table 5.2.1 - Selected Data on Price Indices - Brazil - 2000/2013 (preceding year = 100) (%)
2000 2006 2007 2008 2009 2010 2011 2012 2013 Consumer price indices (all items) 106.0 103.1 104.5 105.9 104.3 105.9 106.5 105.8 105.9 Food and beverages 103.2 101.2 110.8 111.1 103.2 110.4 107.2 109.9 108.5 Housing 104.5 103.1 101.8 105.1 105.7 105.0 106.8 106.8 103.4 Rent residential 97.7 103.2 104.5 106.9 106.6 107.4 111.0 109.0 112.0 Fuels (domestics) 102.9 107.3 100.5 103.3 113.0 102.1 102.6 105.2 106.6 Residential electricity 112.7 100.3 93.8 101.1 104.7 103.1 104.0 102.9 84.3 Household articles 105.2 97.3 97.5 102.0 103.0 103.5 100.0 100.8 107.1 Apparel 104.1 105.1 103.8 107.3 106.1 107.5 108.3 105.8 105.4 Transportation 112.1 103.0 102.1 102.3 102.4 102.4 106.1 100.5 103.3 Health and personal care 102.6 106.0 104.5 105.7 105.4 105.1 106.3 106.0 107. Personal expenditures 105.7 107.2 106.5 107.4 108.0 107.4 108.6 110.2 108.4 Education 104.8 106.3 104.2 104.6 106.1 106.2 108.1 107.8 107.9 Communication 112.9 99.8 100.7 101.8 101.1 100.9 101.5 100.8 101.5 Urban area 106.0 103.1 104.5 105.9 104.3 105.9 106.5 105.8 105.9 Source
Brazilian Institute of Geography and Statistics - IBGE, National Consumer Price Indices 2000-2013.
Table 5.2.2 - Selected Data on Price Indices - Russia - 2000/2013 (preceding year = 100) (%)
2000 2006 2007 2008 2009 2010 2011 2012 2013 Consumer price indices (all items) 120.8 109.7 109 114.1 111.7 106.9 108.4 105.1 106.8 Food stuffs (1) 117.5 109.3 109.0 119.0 111.6 106.9 110.3 104.4 107.7 Non-food goods 122.7 106.3 105.9 108.3 109.6 105.6 106.4 105.6 104.9 Services 131.8 115.3 113.5 114.6 114.5 108.3 108.6 105.4 108.1 Housing 133.8 120.1 113.0 113.9 114.6 108.3 109.5 104.7 106.9 Public utilities 137.4 119.8 115.3 116.6 122.3 116.0 113.1 104.7 11.5 Producer price indices Agricultural products 136.5 104.3 118.2 126.7 97.1 106.5 118.6 99.5 107.8 Industrial products(2) 147.1 112.4 112.2 121.7 95.7 114.9 117.3 106.8 103.4 Source
Federal State Statistics Service of the Russian Federation.Footnotes
(1) Including alcoholic beverages and catering.
(2) Aggregated index by kinds of economic activity "Mining and quarrying", "Manufacturing", "Electricity, gas and water production and supply".
Table 5.2.3 - Selected Data on Price Indices - India - 2000/2013 (preceding year = 100) (%)
2000 2006 2007 2008 2009 2010 2011 2012 2013 Consumer price index (industrial workers) (1) Food 101.8 107.0 109.8 111.2 113.4 112.4 107.4 109.3 113.9 Fuel and light 117.6 103.2 103.1 106.8 104.3 108.2 113.8 114.9 108.5 Housing 106.0 106.8 104.0 103.8 114.1 126.6 111.8 107.8 106.6 Clothing, bedding and footwear 104.3 103.7 103.5 103.4 104.1 105.6 113.5 109.9 107.7 Medical care 102.4 106.0 106.5 106.1 104.3 104.1 106.6 112.3 110.0 Education, recreation and amusement 107.4 102.5 103.3 105.5 106.7 103.5 101.4 98.7 104.1 Transport and communication 114.4 108.3 100.0 104.9 100.7 109.2 112.7 109.6 110.3 General index 104.0 106.0 106.5 108.4 110.6 112.1 109.1 108.9 111.1 Wholesale price indices, by commodity (2) All commodities 106.3 106.0 104.9 108.7 102.4 109.6 109.5 107.5 106.3 Primary articles 102.7 108.8 109.4 110.7 109.5 119.1 112.1 109.1 110.6 Electricity 115.9 102.5 101.6 100.2 100.3 105.1 101.5 110.6 119.5 Manufactured products 102.7 104.6 104.9 106.9 101.6 105.4 107.4 105.7 103.3 Sources
a) Ministry of Labour and Employment, Labour Bureau.
b) Ministry of Commerce and Industry, Office of the Economic Adviser.Footnotes
(1) The information for 2000-2005 is based on base year 1982 whereas those for 2006 and after are based on base year 2001.
(2) Figure for the year 2000 relates to base year 1993-1994 and that for the year 2005-2006 and onwards relates to base year 2004-2005.
Table 5.2.4 - Selected Data on Price Indicies - China - 2000/2013 (preceding year = 100) (%)
2000 2001 2006 2007 2008 2009 2010 2011 2012 2013 Consumer price indices (all items) 100.4 100.7 101.5 104.8 105.9 99.3 103.3 105.4 102.6 102.6 Urban area 100.8 100.7 101.5 104.5 105.6 99.1 103.2 105.3 102.7 102.6 Rural area 99.9 100.8 101.5 105.4 106.5 99.7 103.6 105.8 102.5 102.8 Components (1) Food ... 100.0 102.3 112.3 114.3 100.7 107.2 111.8 104.8 104.7 Tobacco, liquor and articles ... 99.7 100.6 101.7 102.9 101.5 101.6 102.8 102.9 100.3 Clothing ... 98.1 99.4 99.4 98.5 98.0 99.0 102.1 103.1 102.3 Garments ... 97.6 99.0 99.4 98.3 97.8 99.1 102.4 103.3 102.4 Household facilities, articles and services ... 97.7 101.2 101.9 102.8 100.2 100.0 102.4 101.9 101.5 Health care and personal articles ... 100.0 101.1 102.1 102.9 101.2 103.2 103.4 102.0 101.3 Transportation and communication ... 99.0 99.9 99.1 99.1 97.6 99.6 100.5 99.9 99.6 Recreation, education, culture articles and services ... 106.6 99.5 99.0 99.3 99.3 100.6 100.4 100.5 101.8 Housing ... 101.2 104.6 104.5 105.5 96.4 104.5 105.3 102.1 102.8 Rent ... 108.6 102.7 104.2 103.5 101.6 104.9 105.3 102.7 104.1 Electricity ... 100.5 101.7 102.1 100.0 100.0 100.0 99.9 101.7 101.6 Gas ... 103.1 104.5 102.4 101.6 102.8 102.8 104.2 101.7 102.1 Producer price indices Components of supply Industrial products (2) 102.8 98.7 103.0 103.1 106.9 94.6 105.5 106.0 98.3 98.1 Agricultural products (3) ... ... 100.1 113.3 114.4 96.0 105.5 110.6 102.2 101.2 Stage of processing Raw materials (4) 105.1 99.8 106.0 104.4 110.5 92.1 109.6 109.1 98.2 98.0 Source
National Bureau of Statistics of the People's Republic of China.Footnotes
(1) Data on components of CPI of 2000 are not available since the classification of CPI was revised in 2001.
(2) Producer price indices of industrial products refer to the prices of industrial products when they leave factories.
(3) Price indices for agricultural products refer to that for food processing industry of agricultural products.
(4) Price indices for raw materials refer to the purchasing price indices for raw materials, fuels, and power.
Table 5.2.5 - Selected Data on Price Indicies - South Africa - 2000/2013
2000 2004 2005 2006 2007 2008 2009 2010 2011 2012 2013 Consumer price indices (all items) (1) 49.6 61.4 63.4 66.4 71.1 79.3 84.6 88.2 92.6 97.8 103.4 Urban area 49.6 61.4 63.4 66.4 71.1 79.3 84.6 88.2 92.6 97.8 103.4 Rural area (2) ... 59.9 61.3 64.3 69.3 78.2 84.3 86.8 91.5 97.3 102.7 Component (1) Housing indices (3) 53.7 63.2 64.3 67.1 73.6 74.6 80.5 85.9 91.6 97.2 102.7 Food indices (4) 39.1 55.6 56.7 60.5 66.8 75.5 82.4 83.1 89.2 95.8 101.4 Electricity (5) 42.2 57 60 62.6 67.5 46.3 58.8 71.2 84.1 95.2 103.6 Gas and other fuels indices (6) Clothing indices 82.1 83.7 81.5 76.4 71 85.9 90.4 92.1 94.6 98.5 101.7 Rent indices 45.4 69.5 72.7 74 76.7 79.6 84.5 88.6 93.5 97.7 102.4 Producer price indices (7) Components of supply Domestic supply (8) 100.0 127.7 132.4 142.6 158.2 180.9 180.8 191.7 207.6 220.5 ... Agricultural products (8) 100.0 128.6 120.4 142.6 176.5 188.0 189.7 187.0 199.7 208.5 ... Final manufactured goods (9) ... ... ... ... ... ... ... ... ... 100.0 106.0 Agriculture (9) ... ... ... ... ... ... ... ... ... 100.0 102.3 Source
Statistics South Africa.Footnotes
1. Break in series, all indices prior to 2008 not official indices. Linking factors used to calculate continuous time series. Linking factors: All items; Urban Area; Rural Area; Housing Indices; Food Indices; Electricity; Clothing Indices; Rent Indices.
(1) Base year = December 2012 = 100.
(2) All items headline measure from 2000 to 2008 based on primary areas, currently based on primary and secondary areas.
(3) Includes all housing, i.e. rental, owners equivalent rent, utilities and maintenance. Electricity excluded (2000-2007). Change in method of calculation in owner-occupied housing from 2008.
(4) Food only (does not include non-alcoholic beverages).
(5) Includes electricity and other solid and liquid fuels.
(6) Included under electricity and other fuels.
(7) Year 2000 = 100.
(8) Discontinued in December 2012
(9) Introduced in January 2013, history starts from January 2012. Base year 2012=100
General
The retail price is defined as money cost to the consumer of a specified unit of sale which is inclusive of all rebates, discount etc. Consumer Price Indices (CPI), the retail price indicates time fluctuations of prices on goods and services purchased by the consumers for non production consumption within a specified period of time. It measures a ratio of value of a fixed basket of main goods and services at the prices of the current period as related to its value at ht prices of the base period. CPI is calculated monthly on the basis of statistical data collected while observing price changes in retail trade and service establishments and also in commodity, mixed and food market and as well as on data of actual structure of consumer expenditures of households for the previous year. Producer Price Indices: It represent bulk transaction generally at the early stage of trading. The price pertaining to bulk transactions may have divergent nomenclatures e.g. farm harvest prices, wholesale prices, procurement prices, support prices, administered prices, import prices, forward prices etc. Wholesale price index relates to the transactions at the primary stage which broadly correspond to producer prices. Brazil
The Brazilian Institute of Geography and Statistics (IBGE) is the government organisation responsible for the computation of the Extended National Consumer Price Index (IPCA), which is the official and main inflation indicator of the country. IPCA is used by the Central Bank to monitor objectives set in the inflation goals system. The index is computed on a monthly basis and refers to families inhabiting in urban localities, with monthly income, from any source, ranging from 1 (one) to 40 (forty) minimum wages. The geographical coverage of the index encompasses 9 metropolitan regions, Goiania city and Brasilia (Brazil's capital), which represents 37% of the Brazilian's urban population, according to the 2010 census. Russia
Consumer Price Indices (CPI) indicates time fluctuations of prices on goods and services purchased by the consumers for non production consumption within a specified period of time. It measures a ratio of value of a fixed basket of main goods and services at the prices of the current period as related to its value at the prices of the base period. CPI is calculated monthly on the basis of statistical data collected while observing price changes in retail trade and service establishments and also in commodity, mixed and food market and as well as on data of actual structure of consumer expenditures of households for the previous year (before 2013 year), since 2013 year - for 2 previous years.
CPI is computed for the urban population and it is diffused for the whole population.Producer Price Indices (PPI) for Industrial Goods are complied on the basis of recording prices for representative goods produced by 8 thousand basic (key) organisations covered by the survey. Average prices and price indices are calculated for more than 800 (since 2010 year-1000) representative goods. Producer prices are actual prices for produced goods provided for selling on the domestic market (except indirect taxes). PPI calculated for representative goods shall be gradually aggregated into indices of corresponding types, kinds, classes, divisions of economics activities. Data on the volume of production in value terms of the base period are being used as the weight factors. India
Consumer Price Index Numbers for Industrial workers measure a change over time in prices of fixed basket of goods and services consumed by Industrial Workers. These index numbers are utilized for regulation of wages and dearness allowances of millions of employees and workers in the organised sector. It also serves as an indicator of retail prices in the country and is used for formulation of wages and interest policies The Labour Bureau, an attached office of the M/o Labour& Employment, has been compiling and disseminating Consumer Price Index for industrial worker since its inception in the year 1946.
This index series till 2005 was based on 1982=100. A new series on base: 2001=100 has been released w.e.f January, 2006 The data on Consumer Expenditure have been obtained from an ad-hoc survey "family Income and Expenditure Survey"conducted during September 1999 to August 2000 in respect of 78 selected centers by the NSSO on behalf of Labour Bureau. These 78 centre were selected on the basis of their industrial importance in the country and distributed among different states in proportion to the Industrial employment in the State subject to a maximum allotment of 5 centers per state per sector. On the basis of the results thrown up by the survey, the weighing diagrams have been derived in respect of 78 constituent's centers All-India. The indices are compiled by using price data collected on monthly basis and house rent survey data on half yearly basis. The CPI (IW), centrewise and at all India levels is released monthly with time lag of one month (on the last working day of the following month).Index Number of Wholesale Prices in India is compiled by Office of Economic Adviser, Ministry of Commerce & Industry. The present series has 2004-05 as the base year and the data is released weekly. It is the most commonly used meausre of Inflation in India Item Basket and the weighting digram is based on Gross Value of Output as obtained from National Accounts Statistics 2007. Seasonal Items have also been included and when they disappear their weight is distributed over remaining items in the sub group on a pro rata basis. Unlike 1993-94 series , in the new seires, instead of Public Distribution System prices of Paddy and wheat their procurement prices have been included to correctly represent the first point of sale.
The existing series is based on ex-factory/ex-mine prices in respect of the manufactured items. In the case Agricultural commodities, however the prices as quoted in primary wholesale markets are used. The collection of price data is through correspondence & self filing of information.Varous units submit the prices electronically through online forms.
Index is compiled on the principle of weighted arithmetic mean according to the Laspeyre's formula, which has fixed base year weights operating through the entire life span of the series.China
Consumer Price Indices reflect the trend and degree of changes in prices of consumer goods and services purchased by urban and rural households during a given period. They are obtained by combining consumer price indices of urban household and consumer price indices of rural household. The indices enable the observation and analysis of the degree of impact of the changes in the prices of retail goods and services on the actual living expenses of urban and rural residents. Producer Price Indices for Industrial Products reflect the trend and degree of changes in general exfactory prices of all industrial goods during a given period, including sales of industrial goods by an industrial enterprise to all units outside the enterprise, as well as sales of consumer goods to residents. It can be used to analyze the impact of ex-factory prices on gross output value and value-added of the industrial sector. South Africa
Break in series, all indices prior to 2008 not official indices. Linking factors used to calculate continuous time series. Linking factors: All items; Urban Area; Rural Area; Housing Indices; Food Indices; Electricity; Clothing Indices; Rent Indices.
Table 6.1 - Summary of People's Living Standard on BRICS Countries - 2000/2013
2000 2005 2006 2007 2008 2009 2010 2011 2012 2013 Ownership of colour TV sets (per 100 persons) Brazil ... ... ... ... ... ... ... ... ... ... Russia (1) 124 138 144 149 154 160 164 170 174 ... India (2) 31.6 ... 44.2 ... ... ... ... 47.2 ... (3)61.4 China (4) ... ... ... ... ... ... ... ... ... 38.0 Urban 37.3 45.5 46.6 47.4 45.7 46.9 47.7 47.1 47.6 ... Rural 11.6 20.6 22.1 23.4 24.7 27.4 28.3 29.6 30.1 ... South Africa ... 60.0 61.0 65.0 67.0 71.0 ... ... ... ... Ownership of cars (per 100 persons) Brazil (5) 8.8 8.0 7.9 7.4 6.9 ... ... ... ... ... Russia (6) 13 17 18 19 21 22 22.8 24.2 26 India (7) 0.5 0.7 0.8 0.9 1 1.1 1.2 1.3 1.5 ... China (4) ... ... ... ... ... ... ... ... ... 5.52 Urban 0.2 1.1 1.5 2.1 3.0 3.8 4.5 6.5 7.5 ... Rural (8) 0.1 0.2 0.3 0.3 0.3 0.5 0.7 1.4 1.7 ... South Africa ... ... ... 16.8 16.9 17.1 17.5 ... ... ... Growth rate of average annual real wage (%) Brazil (9) (10) ... 4.5 7.1 3.1 1.6 2.2 ... 4.0 5.8 ... Russia 20.9 12.6 13.3 17.2 11.5 -3.5 5.2 2.8 8.4 5.3 India ... ... ... ... ... ... ... ... ... ... China 11.3 12.5 12.9 13.4 10.7 12.6 9.8 8.6 9.0 ... South Africa Share of public expenditure on education to GDP (%) Brazil 4.8 4.1 4.3 4.6 4.8 5.2 5.1 5.2 5.3 ... Russia (12) 2.9 3.7 3.8 4.0 4.0 4.6 4.1 4 4.1 (3)4.3 India (14) 3.2 2.6 2.7 2.6 2.9 3.0 3.1 3.3 (14)3.1 ... China (16) 2.9 2.8 3.0 3.2 3.3 3.6 3.7 3.9 4.3 ... South Africa 4.5 6.1 6.4 6.8 7.9 9.3 10.1 Share of public expenditure on health to GDP (%) Brazil 3.9 4.3 4.5 4.7 4.7 5.1 4.9 4.8 5.0 ... Russia (12) (17) 2.1 3.7 3.6 4.2 3.7 4.3 3.7 3.5 3.7 (18)3.5 India (14) ... 1.2 1.2 1.3 1.3 1.4 1.3 1.3 (14)1.4 ... China (18) 4.62 4.68 4.55 4.35 4.63 5.15 4.98 5.15 5.4 ... South Africa Gini coefficient Brazil (19) ... 0.532 0.528 0.521 0.513 0.509 ... 0.501 0.500 ... Russia (20) 0.395 0.409 0.415 0.422 0.421 0.421 0.421 0.417 0.420 ... India (21) Urban 0.342 0.348 ... ... ... ... 0.371 ... ... ... Rural 0.260 0.266 ... ... ... ... 0.276 ... ... ... China (22) .. 0.485 0.487 0.484 0.491 0.490 0.481 0.477 0.474 0.473 South Africa (23) 0.650 ... 0.670 ... ... 0.640 ... ... ... ... Sources
Brazil
a) Brazilian Institute of Geography and Statistics - IBGE,National Household Sample Survey 2001/2012 .
b) Ministry of Education, Anfsio Teixeira National Institute for Educational Research and Studies - INEP.
c) National Association of Automobile Manufacturers, Brazilian Automotive Industry Yearbook 2010.Russia
a) Federal State Statistics Service of the Russian Federation.
b) Ministry of the Interior of the Russian Federation.India
a) Telecom Regulatory Authority of India, Annual Report 2012-2013.
b) Ministry of Health & Family Welfare, National Family Health Survey 2007 .
c) Ministry of Road Transport & Highways, Road Transport Year Book.
d) Ministry of Finance, Economic Survey.
e) Planning Commission of India.China
a) National Bureau of Statistics of the People's Republic of China, Integrated Household Survey in Urban and Rural Areas of China 2013 ; Urban Household Survey in China 2000-2012; and Rural Household Survey in China 2000-2012.
b) Ministry of Education of the People's Republic of China, Annual Statistical Reports 2000-2013.
c) National Health and Family Planning Commission of the People's Republic of China, Annual Statistical Reports 2000-2013.South Africa
a) Statistics South Africa.Footnotes
Brazil
(5) The data for Brazil refer to vehicles per 100 persons.
(9) Revised data, according the last population estimate.
(10) Employed population 15 years and older with work income.
(19) Gini Index of Household Income.Russia
(1) All type TV sets. Per 100 households. By data of sample household budget survey.
(6) Personal passenger cars.
(12) Estimates on the base of the data of the Federal Treasury. Since 2005 year including budgets of the state non-budget funds.
(13) Provisional data.
(17) Before 2011 year data include expenditures on physical culture and sport.
(20) Data on Gini Index are based on per capita income data.India
(2) Figure for 2000 , 2011(Census) & 2013(estimates) are as on March of the year & that for 2006 is based on National Family Health Survey 3, December 2005 to August 2006. All information is per 100 households
(3) Estimated data.
(7) Figures have been derived by dividing No. of registered vehicles as on 31st March of the year indicated in the table (Except for 2000 where the data is as on 31st March 2001) by mid year population.
(14) Information pertains to Financial Year (i.e. April of Year indicated in the table to March next year) and it relates to Expenditure of general government (i. Centre and State Combined)
(21) Gini coefficient of household consumption has been calculated on the basis of National Sample Survey Periods (i.e. July 1999-June 2000, July 2004-June 2005 & July 2009-June 2010) and is based on Mixed Recall Period.China
(4) In the fourth quarter of 2012, the National Bureau of Statistics of the People's Republic of China conducted the integrated survey of urban and rural households, unifying the names, classification and statistical standards of urban and rural households. On its basis, we got the ownership data of resident in China, including the number of colour TV sets, cars and personal computers etc.
(8) In rural household survey of China, cars refer to the automobiles for living use, including vans.
(11) Average annual wage of staff and workers refers to the average wage level in monetary terms per staff and worker during a year of time.
(16) Government appropriation for education to GDP.
(18) Total expenditure on health as percentage of GDP.
(22) Data of Gini Coefficient are based on per capita annual disposable income.South Africa
(23) Gini is per capita expenditure excluding taxes.
Table 6.2.1 - Selected Data on People's Living Standard - Brazil - 2000/2012
2000 2004 2005 2006 2007 2008 2009 2010 2011 2012 Income and expenditure Household's per capita disposible income (R$) 4 625 6 655 7 239 7 906 ... ... ... ... ... ... Household's per capita living consumption expenditure (R$) 4 337 6 268 6 899 7 523 ... ... ... ... ... ... Household's per capita savings balance (R$) 361 563 529 603 ... ... ... ... ... ... Living quality Composition of household's Consumption expenditure (%) ... ... ... ... ... ... 87.3 ... ... ... Food expenditure as percentage of total consumption expenditure (%) ... ... ... ... ... ... 24.1 ... ... ... Gini index of household income (1) ... 0.535 0.532 0.528 0.521 0.513 0.509 ... 0.501 0.500 Illiteracy rate (%) (1) (2) ... 11.5 11.1 10.5 10.1 10.0 9.7 ... 8.6 8.7 Scholarity level of the population (years)(1) (2) ... 6.8 7.0 7.1 7.3 7.4 7.5 ... 7.7 7.9 Classification of dwellings by number of rooms (%) (1) ... 100.0 100.0 100.0 100.0 100.0 100.0 ... 100.0 100.0 1 or 2 rooms ... 3.3 3.0 3.0 3.0 2.5 2.3 ... 2.3 1.9 3 rooms ... 7.7 7.8 7.3 7.3 6.8 6.7 ... 6.6 6.4 4 rooms ... 15.4 15.1 14.9 15.1 14.4 14.3 ... 14.9 14.6 5 rooms ... 26.3 26.1 26.2 27.1 26.9 28.0 ... 28.8 29.2 6 rooms ... 19.2 19.6 19.7 20.1 19.8 20.2 ... 20.0 20.3 7 rooms ... 11.6 11.9 12.1 12.2 12.5 12.1 ... 11.9 12.2 8 rooms or more ... 16.5 16.5 16.9 15.2 17.1 16.3 ... 15.5 15.5 Classification of dwellings by number of bedrooms (%) (1) ... 100.0 100.0 100.0 100.0 100.0 100.0 ... 100.0 100.0 1 bedroom ... 34.1 34.3 34.4 34.2 34.9 35.2 ... 34.8 35.9 2 bedrooms ... 43.6 43.5 43.5 43.8 43.5 43.9 ... 44.6 44.0 3 bedrooms ... 19.2 19.2 19.0 19.0 18.7 18.3 ... 18.0 17.6 4 bedrooms or more ... 3.1 3.1 3.1 3.1 2.9 2.7 ... 2.7 2.5 Average number of residents by dwelling (person) (1) ... 3.5 3.5 3.4 3.4 3.3 3.3 ... 3.2 3.1 Average number of residents by bedroom (person)(1) ... 1.8 1.8 1.8 1.8 1.7 1.7 ... 1.7 1.7 Classification of dwellings tenure (%) (1) ... 100.0 100.0 100.0 100.0 100.0 100.0 ... 100.0 100.0 Owner occupied ... 73.7 73.5 73.4 74.0 74.4 73.6 ... 74.8 74.8 Renter occupied ... 15.4 16.0 16.2 16.6 16.5 17.0 ... 17.3 17.7 Granted free of rent ... 10.4 10.0 9.8 8.9 8.5 8.9 ... 7.4 7.1 Other ... 0.5 0.5 0.6 0.5 0.6 0.5 ... 0.5 0.4 Classification of dwellings by equipment (%) (1) Television ... 90.2 91.2 92.9 94.3 95.0 95.6 ... 96.9 97.2 Radio ... 87.7 87.9 87.8 88.0 88.9 87.8 ... 83.5 80.9 Computer ... 16.3 18.5 22.0 26.5 31.2 34.7 ... 42.9 46.4 With Internet access ... 12.2 13.6 16.8 20.0 23..8 27.4 ... 36.6 40.3 Refrigerator ... 87.3 87.8 89.0 90.6 92.0 93.3 ... 95.8 96.7 Dwellings with piped water within at least one room (%) (1) ... 89.3 89.9 91.0 91.7 92.5 93.1 ... 94.2 94.7 Dwellings whose fuel used for cooking is gas (%) (1) ... 90.3 90.2 91.0 91.9 92.7 93.1 ... 94.7 94.9 Average number of proteins per capita per day (gram) (4) ... ... ... ... ... ... 48.7 ... ... ... Average number of calories per capita per day (kilo calories)(4) ... ... ... ... ... ... 1 610.5 ... ... ... Average number of fats per capita per day (gram) (4) ... ... ... ... ... ... 51.4 ... ... ... Culture, education and health Household expenditure on education, culture and entertainment (%) ... ... ... ... ... ... 4.1 ... ... ... Enrolment by level of education (1 000 persons) (3) 56 115 59 590 61 044 61 019 58 302 59 191 58 696 58 102 57 902 57 786 Pre-primary (ISC 0) 6 012 6 603 7 298 7 104 6 574 6 785 6 810 6 792 7 003 7 314 Primary (ISC 1) 21 225 20 533 20 693 20 079 19 435 18 979 18 524 16 893 17 455 17 056 Lower secondary (ISC 2) 16 935 17 124 16 976 17 306 16 327 16 648 16 478 14 255 15 753 15 386 Upper secondary (ISC 3) 9 162 11 055 11 504 11 453 10 693 10 821 10 768 8 359 10 760 10 788 First stage of tertiary education (ISC 5) 2 694 4 164 4 453 5 031 5 223 5 905 6 057 6 488 6 857 7 162 Advanced research programmes (ISC 6) 87 111 119 47 50 53 58 65 72 79 Hospital beds (per 1 000 inhabitants) 2.9 ... 2.5 2.5 2.5 2.5 2.5 2.4 2.4 2.4 Sources
a) Brazilian Institute of Geography and Statistics - IBGE, Household Budget Survey 2008-2009 ; National Household Sample Survey 2001/2012 ; Medical Health Assistance Survey ; and National Account System 2000-2010.
b) Ministry of Education, An�sio Teixeira National Institute for Education Research and Studies - INEP, Basic Education Census and Higher Education Census; and Coordination for the Improvement of Higher Education Personnel - CAPES.
Ministry of HealthFootnotes
(1) Revised data, according the last population estimate.
(2) Persons 15 years old and over.
(3) For education:
a) Special education are included in their respective ISCEDs.
b) Youth and adult education are included in their respective ISCEDs.
c) Includes special education.
d) Includes youth and adult education.
e) Includes professional education programmes.
f) Includes teacher education in ISCED 3 vocational programmes.
g) Until 2005 master degree programmes are classified as ISCED 6, from 2006 master degree programmes are classified as ISCED 5A (second or further degrees).
(4) Average available in the household, from HBS 2008-2009.
Table 6.2.2 - Selected Data on People's Living Standard - Russia - 2000/2012
2000 2005 2006 2007 2008 2009 2010 2011 2012 Income and expenditure Household's per capita per month disposable income (Rub) (1) ... ... ... ... ... ... ... 15 938 ... Rural (Rub) ... ... ... ... ... ... ... 10 705 ... Urban (Rub) ... ... ... ... ... ... ... 17 786 ... Household's per capita per month living Consumption expenditure (Rub) 1 157 4 239 5 083 6 541 8 217 8 687 10 122 11 286 12 624 Rural (Rub) 732 2 420 2 974 3 819 4 955 5 326 6 446 7 292 8 415 Urban (Rub) 1 313 4 905 5 854 7 533 9 399 9 905 11 453 12 680 14 082 Living Quality Consumption expenditure (%) (2) Food products ... 33.2 31.6 28.4 29.1 30.5 29.6 29.5 28.1 Alcoholic beverages and tobacco ... 2.7 2.7 2.4 2.3 2.4 2.4 2.5 2.5 Apparel and footwear ... 10.7 10.9 10.4 10.4 10.4 10.8 10.1 10.1 Housing and communal service, fuel ... 11.3 12.1 11.6 10.4 10.8 11.3 11.4 10.9 Domestic articles, durables, housing support ... 7.2 7.3 7.3 7.5 7.0 6.2 6.5 6.3 Health care ... 2.5 3.0 3.1 2.9 3.1 3.3 3.5 3.4 Transport, communication ... 15.8 16.4 20.4 19.2 17.2 18.7 19.5 20.8 Recreation and cultural arrangements ... 7.1 6.4 6.4 7.7 7.3 6.8 6.8 6.9 Education ... 1.8 2.0 1.8 1.6 1.5 1.3 1.2 1.3 Other goods and services ... 7.7 7.6 8.2 8.9 9.8 9.6 9.0 9.7 Food expenditure (including catering) as a percentage of total (%) 49.0 36.1 34.1 31.2 31.9 33.8 32.9 32.6 31.4 Gini index 0.395 0.409 0.415 0.422 0.421 0.421 0.421 0.417 0.420 Illiteracy rate (%) (3) 0.55 ... ... ... ... ... ... ... ... Classification of dwellings by number of rooms (%) 100.0 100.0 100.0 100.0 100.0 100.0 100.0 100.0 100.0 1 room 23.3 23.1 23.1 23.2 23.3 23.3 23.5 23.6 24.4 2 rooms 41.0 40.5 40.4 40.2 40.0 39.9 39.7 39.6 42.2 3 rooms 29.4 29.3 29.2 29.2 29.1 29.1 29.0 28.9 28.5 4 or more rooms 6.3 7.1 7.3 7.4 7.6 7.7 7.8 7.9 4.9 Classification of dwellings tenure (%) 100.0 100.0 100.0 100.0 100.0 100.0 100.0 100.0 100.0 Private property 65.3 77.1 79.8 81.1 82.4 84.3 85.6 86.3 87.1 State-owned 6.3 6.4 5.5 5.3 4.9 4.5 4.3 4.0 3.7 Municipal property 26.5 16.5 14.6 13.5 12.5 11.0 9.9 9.5 9.0 Other 1.9 ... 0.1 0.1 0.2 0.2 0.2 0.2 0.2 Classification of dwellings by equipment (%) Piped water within the dwelling 73.4 75.6 75.9 76.3 76.9 77.3 77.7 78.1 78.5 Sewerage 69.0 71.5 71.8 72.2 72.8 73.3 73.7 74.1 74.4 Heating 73.4 79.8 80.5 81.1 81.9 82.6 83.1 83.4 83.7 Hot water supply 59.4 62.9 63.4 63.8 64.2 64.6 64.9 65.3 65.5 Bath (shower) 63.8 65.4 65.6 65.9 66.2 66.5 66.7 66.9 67.1 Gas (network, liquefied) 70.0 70.1 70.0 69.7 69.4 69.2 69.0 68.6 68.0 City coverage rate of population with access to tap water (%)(2) 95.0 96.5 96.3 96.5 96.6 97.1 96.6 96.5 97.2 City coverage rate of population with access to gas (%)(2) 74.0 73.7 71.4 72.8 73.7 73.9 75.4 75.8 75.9 Per capita area of parks and green Land (sq.m) (4) 169.4 190.5 197.6 199.0 201.2 202.3 203.7 207.0 213.6 Average number of proteins per capita per day (gram) (2) 73.0 71.0 71.0 72.0 73.0 73.0 77.0 77 78.0 Average number of calories per capita per day (kilo calories) (2) 2 551.0 2 630.0 2 554.0 2 564.0 2 550.0 2 551.0 2 652.0 2 624.0 2 633.0 Average number of fats per capita per day (gram) (2) 99.0 69.0 95.0 97.0 98.0 99.0 105.0 105 105.0 Culture, education and health Percentage of household expenditure on education, culture and entertainment (%) (2) 8.9 8.4 8.2 9.3 8.8 8.1 8.0 8.2 Enrollment by level of education (1 000 persons) Primary education (1 level of ISCED97) 5 920 5 332 5 170 5 123 5 165 5 266 5 457 5 654 5 793 Secondary education (2 and 3 levels of ISCED97) 16 332 12 058 11 275 10 546 10 049 9 772 9 582 9 504 9 428 Tertiary education (5 and 6 levels of ISCED97) 7 224 9 803 9 974 10 021 9 909 9 720 9 337 8 733 8 314 Physicians (per 1 000 inhabitants) 4.7 4.9 4.9 5.0 5.0 5.0 5.0 5.1 4.9 Hospital beds (per 1 000 inhabitants) 11.5 11.1 10.9 10.7 9.9 9.7 9.4 9.4 9.3 Age-standardized death rate by cause, per 10 000 of the standard population(5) From diseases of circulatory system 51.2 52.5 48.5 45.5 44.9 42.4 42.1 38.5 36.6 From neoplasms 13.7 12.7 12.5 12.4 12.3 12.4 12.3 12.2 11.9 From external causes of death 18.6 17.8 15.9 14..6 13.6 12.5 12.0 11.0 10.7 From diseases of digestive system 3.2 4.6 4.3 4.2 4.3 4.2 4.3 4.1 4.0 From diseases of respiratory system 5.1 4.5 3.9 3.6 3.6 3.6 3.3 3.3 3.0 From infectious and parasitic diseases 2.2 2.3 2.1 2.0 2.0 1.9 1.9 1.9 1.8 Girls enrolment per 100 boys (for primary education) 95.0 96.0 95.0 96.0 96.0 96.0 96.0 96.0 96.0 Sources
Federal State Statistics Services of the Russian Federation.Footnotes
(1) According to the Sample Monitoring of Population Income and Participation in Social Programs.
(2) According to the Sample Household Budget Survey.
(3) According to the Census of Population 2002.
(4) Per capita of urban population.
(5) World Standard of WHO by all causes.
Table 6.2.3 - Selected Data on People's Living Standard - India - 2000/2012
2000 2001 2005 2006 2007 2008 2009 2010 2011 2012 Income and expenditure Per capita monthly living consumption expenditure (1) Urban area Total (₹) 855.0 ... 1 052.4 1 170.6 1 312.5 1 471.7 ... 1 984.5 ... 2 629.7 Food (%) 48.1 ... 42.5 40.0 39.4 39.6 ... 44.4 ... 42.6 Fuel and light (%) 7.8 ... 9.9 9.4 8.9 8.5 ... 6.9 ... 6.7 Clothing (%) 6.1 ... 4.0 5.4 5.4 5.4 ... 4.8 ... 5.4 Education (%) 4.3 ... 5.0 6.2 7.0 7.1 ... 8.1 ... 6.9 Medical care (%) 5.1 ... 5.2 6.0 6.3 5.2 ... 5.0 ... 5.5 Rural area Total (₹) 486.1 ... 558.8 624.5 695.2 772.4 ... 1 053.6 ... 1 430.0 Food (%) 59.4 ... 55.0 53.3 52.3 52.3 ... 57.0 ... 52.9 Fuel and light (%) 7.5 ... 10.2 9.7 9.5 9.7 ... 8.0 ... 8.0 Clothing (%) 6.8 ... 4.5 6.3 6.1 6.3 ... 5.3 ... 6.0 Education (%) 1.9 ... 2.7 2.7 3.2 3.7 ... 3.6 ... 3.5 Medical care (%) 6.1 ... 6.6 7.0 7.5 6.3 ... 5.4 ... 6.7 Culture, education and health Public expenditure on education (%) (2) 11.3 ... 10.0 10.3 9.8 10.1 10.6 11.4 11.6 (3) 11.7 Enrollment by level of education (million persons)(2) Primary level (class I-V) 114.0 ... 132.0 134.0 135.0 135.0 136.0 135.0 ... ... Secondary level (class IX-XII) 28.0 ... 38.0 40.0 45.0 46.0 48.0 51.0 ... ... Higher education level (graduation or above) 8.6 ... 14.3 15.6 17.2 18.5 20.7 27.5 (4)28.6 ... Public expenditure on health (%) (2) 4.7 ... 4.7 4.7 4.8 4.6 4.8 4.7 4.6 (3)4.8 Doctors (1000 numbers) (5) 556 ... 675 701 731 761 794 827 861 884 Hospital beds (1000 numbers) (5) 506 ... 470 493 483 495 540 577 785 1376 Deaths by accident (un natural causes) (1000 numbers) (6) 238 ... 272 293 316 318 335 360 367 372 Cholera 18 ... 6 3 3 1 12 3 10 1 Malaria 1 005 ... 963 1 707 1 311 1 055 1 144 1 018 463 446 Dengue 7 ... 157 184 69 80 96 110 169 242 Kala-Azar 150 ... 157 157 203 151 93 105 80 23 Tuberculosis 10 463 ... 56 471 64 539 64 824 66 204 66 345 63 781 63 265 ... Dwellings by type of occupation Owned (per 1000 households) Urban ... (7) 668 ... ... ... ... (1) 615 ... (7) 692 ... Rural ... (7) 943 ... ... ... ... (1) 950 ... (7) 947 ... Hired (per 1000 households) Urban ... (7) 285 ... ... ... ... (1) 351 ... (7) 275 ... Rural ... (7) 36 ... ... ... ... (1) 33 ... (7) 34 ... Others (per 1000 households) Urban ... (7) 47 ... ... ... ... (1) 34 ... (7) 33 ... Rural ... (7) 21 ... ... ... ... (1) 17 ... (7) 19 ... Living quality Composition of household's Housing amenities Tap water facilities (per 1000 households) 243 687 301 743 ... ... ... 308 706 ... Electricity facilities (per 1000 households) 435 876 660 961 ... ... ... 553 927 ... Toilet facilities (per 1000 households) 219 737 348 887 ... ... ... 307 814 ... Gini coefficient (1) (8) Urban (%) 0.342 ... 0.348 ... ... ... ... 0.371 ... ... Rural (%) 0.260 ... 0.266 ... ... ... ... 0.276 ... ... Illiteracy rate (1) (9) Urban (%) 20.2 ... 17.4 16.7 16.5 15.7 ... 14.6 ... 14 Rural (%) 44.2 ... 38.1 36.5 34.9 33 ... 31.2 ... 30 Classification of dwellings by equipment (%) (7) Radio, transister ... 35.1 ... ... ... ... ... ... 19.9 ... Television ... 31.6 ... ... ... ... ... ... 47.2 ... Telephone ... 9.1 ... ... ... ... ... ... 63.2 ... Bicycle ... 43.7 ... ... ... ... ... ... 44.8 ... Scooter, motorcycle, moped ... 11.7 ... ... ... ... ... ... 21 ... Car, jeep, van ... 2.5 ... ... ... ... ... ... 4.7 ... None of the above assets ... 34.5 ... ... ... ... ... ... 17.8 ... Population with access to tap water (%) ... 36.7 ... ... ... ... ... ... 43.5 ... Population with access to gas (%) ... 17.5 ... ... ... ... ... ... 28.5 ... Average number of calories per capita (kilo calories per day) (1) Urban ... ... 2 020 ... ... ... ... ... ... ... Rural ... ... 2 047 ... ... ... ... ... ... ... Average number of proteins per capita (gram per day) (1) Urban ... ... 57 ... ... ... ... ... ... ... Rural ... ... 57 ... ... ... ... ... ... ... Average number of fats per capita (gram per day) (1) Urban ... ... 48 ... ... ... ... ... ... ... Rural ... ... 36 ... ... ... ... ... ... ... Sources
a) Ministry of Statistics & Programme Implementation, National Sample Survey Office, NSS Reports on Consumer Expenditure & Employment & Unemployment.
b) Planning Commission of India.
c) Ministry of Human Resource Development, Educational Statistics at a Glance 2011-2012; and Key Results of All India Survey on Higher Education 2011-
d) Ministry of Health & Family Welfare, National Health Profile.
e) Ministry of Finance, Economic Survey.
f) Ministry of Home Affairs, National Crime Records Bureau, Accidental Deaths & Suicides in India (various issues).
g) Ministry of Home Affairs, Office of the Registrar General of India, Census 2001/2011 Reports.Footnotes
(1) Pertains to National Sample Survey Rounds (i.e Period July of the previous year to June of the year mentioned in the table).
(2) Information pertains to Financial Year (i.e. April of Year indicated in the table to March next year) . Expenditure on health & educatiuon relates to Expenditure of general government (i.e. centra & state combined).
(3) Preliminary data.
(4) Estimated data.
(5) As on end of December of the year indicated in the table . The data relates to number of doctors registered with State Medical Council/Medical Council
(6) Includes deaths due to traffic accidents, air crash, fire, poisoning, electrocution etc.
(7) Information is based on Census and is as on 31st March.
(8) Information on expenditure pertains to mixed reference period.
(9) Illiteracy Rate pertains to age 7 years and above.
Table 6.2.4 - Selected Data on People's Living Standard - China - 2000-2013
2000 2001 2002 2003 2004 2005 2006 2007 2008 2009 2010 2011 2012 2013 Income and expenditure Per capita income of households (RMB) Disposable income of urban households 6 280.0 6 859.6 7 702.8 8 472.2 9 421.6 10 493.0 11 759.5 13 785.8 15 780.8 17 174.7 19 109.4 21 809.8 24 564.7 26 955.1 Net income of rural households 2 253.4 2 366.4 2 475.6 2 622.2 2 936.4 3 254.9 3 587.0 4 140.4 4 760.6 5 153.2 5 919.0 6 977.3 7 916.6 8 895.9 Per capita consumption expenditure (RMB) Urban households (in cash) 4 998.0 5 309.0 6 029.9 6 510.9 7 182.1 7 942.9 8 696.6 9 997.5 11 242.9 12 264.6 13 471.5 15 160.9 16 674.3 18 022.6 Rural households 1 670.1 1 741.1 1 834.3 1 943.3 2 184.7 2 555.4 2 829.0 3 223.9 3 660.7 3 993.5 4 381.8 5 221.1 5 908.0 6 625.5 Per capita savings balance (RMB) 5 075.8 5 779.5 6 766.0 8 018.2 9 197.4 10 787.3 12 292.9 13 058.0 16 406.8 19 540.8 22 619.2 25 504.6 29 508.1 32 894.5 Living quality Composition of consumption expenditure of households Urban (in cash) (%) 100.0 100.0 100.0 100.0 100.0 100.0 100.0 100.0 100.0 100.0 100.0 100.0 100.0 100.0 Food 39.4 38.2 37.7 37.1 37.7 36.7 35.8 36.3 37.9 36.5 35.7 36.3 36.2 35.0 Clothing 10.0 10.1 9.8 9.8 9.6 10.1 10.4 10.4 10.4 10.5 10.7 11.0 10.9 10.6 Residence 11.3 11.5 10.4 10.7 10.2 10.2 10.4 9.8 10.2 10.0 9.9 9.3 8.9 9.7 Household facilities, articles and services 7.5 7.1 6.4 6.3 5.7 5.6 5.7 6.0 6.2 6.4 6.7 6.7 6.7 6.7 Transport and communication 8.5 9.3 10.4 11.1 11.7 12.5 13.2 13.6 12.6 13.7 14.7 14.2 14.7 15.2 Education, cultural and recreation and services 13.4 13.9 15.0 14.4 14.4 13.8 13.8 13.3 12.1 12.0 12.1 12.2 12.2 12.7 Health care and medical services 6.4 6.5 7.1 7.3 7.4 7.6 7.1 7.0 7.0 7.0 6.5 6.4 6.4 6.2 Miscellaneous goods and services 3.4 3.5 3.2 3.3 3.3 3.5 3.6 3.6 3.7 3.9 3.7 3.8 3.9 3.9 Rural (%) 100.0 100.0 100.0 100.0 100.0 100.0 100.0 100.0 100.0 100.0 100.0 100.0 100.0 100.0 Food 49.1 47.7 46.2 45.6 47.2 45.5 43.0 43.1 43.7 41.0 41.1 40.4 39.3 37.7 Clothing 5.7 5.7 5.7 5.7 5.5 5.8 5.9 6.0 5.8 5.8 6.0 6.5 6.7 6.6 Residence 15.5 16.0 16.4 15.9 14.8 14.5 16.6 17.8 18.5 20.2 19.1 18.4 18.4 18.6 Household facilities, articles and services 4.5 4.4 4.4 4.2 4.1 4.4 4.5 4.6 4.8 5.1 5.3 5.9 5.8 5.8 Transport and communication 5.6 6.3 7.0 8.4 8.8 9.6 10.2 10.2 9.8 10.1 10.5 10.5 11.1 12.0 Education, cultural and recreation and services 11.2 11.1 11.5 12.1 11.3 11.6 10.8 9.5 8.6 8.5 8.4 7.6 7.5 7.3 Health care and medical services 5.2 5.5 5.7 6.0 6.0 6.6 6.8 6.5 6.7 7.2 7.4 8.4 8.7 9.3 Miscellaneous goods and services 3.1 3.2 3.1 2.2 2.2 2.1 2.2 2.3 2.1 2.1 2.1 2.3 2.5 2.6 Gini coefficient (1) ... ... ... 0.479 0.473 0.485 0.487 0.484 0.491 0.490 0.481 0.477 0.474 0.473 Rural areas coverage rate of population with access to tap water (%) 55.2 55.1 56.6 58.2 60.0 61.3 61.1 62.7 65.5 68.4 71.2 72.1 74.6 ... City coverage rate of population with access to gas (%) 45.4 60.4 67.2 76.7 81.5 82.1 79.1 87.4 89.6 91.4 92.0 92.4 93.2 ... Per capita area of parks and green land (sq.m) 3.7 4.6 5.4 6.5 7.4 7.9 8.3 9.0 9.7 10.7 11.2 11.8 12.3 ... Share of public expenditure on health (%) (2) 4.6 4.6 4.8 4.9 4.8 4.7 4.6 4.4 4.6 5.2 5.0 5.2 5.4 ... Culture, education and health Share of consumption expenditure of education, cultural and recreation and services (%) Urban households 13.4 13.9 15.0 14.4 14.4 13.8 13.8 13.3 12.1 12.0 12.1 12.2 12.2 12.7 Rural households 11.2 11.1 11.5 121.1 11.3 11.6 10.8 9.5 8.6 8.5 8.4 7.6 7.5 7.3 Enrollment by level of education (1 000 persons) Higher education 5 560.9 7 190.7 9 033.6 11 086.0 13 335.0 15 617.8 17 388.4 18 849.0 20 210.2 21 446.6 22 317.9 23 085.1 23 913.2 24 680.7 Regular secondary schools 73 689.1 78 360.2 82 878.7 85 832.0 86 954.0 85 809.0 84 519.0 82 433.0 80 505.0 78 679.2 77 032.5 75 190.0 12 283.5 68 749.5 Vocational secondary schools 5 032.1 4 664.3 5 115.0 5 281.7 5 694.0 6 255.7 6 762.0 7 405.4 7 611.3 7 857.2 7 297.5 6 835.7 6 249.3 5 335.5 Primary schools 130 132.5 125 434.7 121 567.1 116 897.4 112 462.0 108 640.7 107 115.3 105 640.0 103 315.1 100 714.7 99 407.0 99 263.7 96 959.0 93 605.5 Special schools 378.0 386.4 374.5 364.7 372.0 364.4 362.9 419.3 417.4 428.1 425.6 398.7 378.8 368.1 Pre-primary education 22 441.8 20 218.4 20 360.2 20 039.0 20 894.0 21 790.3 22 639.0 23 488.3 24 749.6 26 578.1 29 766.7 34 244.5 36 857.6 38 946.9 Licensed (assistant) doctors (per 1 000 inhabitants) 1.7 1.7 1.5 1.5 1.6 1.6 1.6 1.6 1.7 1.8 1.8 1.8 1.9 2.1 Hospital beds (per 1 000 inhabitants) 2.4 2.4 2.3 2.3 2.4 2.5 2.5 2.6 2.8 3.1 3.3 3.5 3.9 4.5 Sources
a) Ministry of Education of the People's Republic of China, Annual Statistical Report 2000-2013.
b) National Health and Family Planning Commission of the People's Republic of China, Annual Statistical Reports 2000-2013.
c) Ministry of Housing and Urban-Rural Development of the People's Republic of China, Annual Statistical Reports 2000-2013.
d) National Bureau of Statistics of the People's Republic of China, Integrated Household Survey in Urban and Rural Areas of China 2013; Urban Household Survey in China 2000-2012; and Rural Household Survey in China 2000-2012.
e) The People's Bank of China, Almanac of China's Finance and Banking 2000-2013.
f) National Bureau of Statistics of the People's Republic of China, Statistical Communique of the People's Republic of China on the 2013 National Economic and Social Development.Footnotes
(1) Data of Gini coefficient are based on per capita annual disposable income.
(2) Total expenditure on health as percentage of GDP.
(3) Refers to beds of hospitals and health care centers per 1 000 inhabitants.
Table 6.2.5 - Selected Data on People's Living Standards - South Africa - 2000/2011
2000 2005 2006 2007 2008 2009 2010 2011 Income and expenditure Household per capita disposable income (ZAR) 6 364 ... 28 819 ... ... 31 856 ... 42 905 Household's per capita living Consumption expenditure (1) 7 546 ... 21 613 ... ... 26 149 ... 34 897 Living quality Composition of household's consumption expenditure (%) 100.0 ... 100.0 ... ... 100.0 ... 100.0 Food and non-alcoholic beverages (2) 27.7 ... 14.4 ... ... 19.3 ... 12.8 Alcoholic beverages and tobacco 2.6 ... 1.2 ... ... 1.0 ... 1.1 Clothing and footwear 5.4 ... 5.0 ... ... 4.8 ... 4.5 Housing, water, electricity, gas and other fuels 13.6 ... 23.6 ... ... 24.9 ... 32.0 Furnishings and household equipment 8.7 ... 6.9 ... ... 5.4 ... 5.1 Health 1.5 ... 1.7 ... ... 1.3 ... 1.4 Transport 13.3 ... 19.9 ... ... 15.3 ... 17.1 Communication 3.4 ... 3.5 ... ... 3.4 ... 2.8 Recreation and culture 3.7 ... 4.6 ... ... 4.3 ... 3.0 Education 2.4 ... 2.4 ... ... 2.8 ... 2.7 Restaurants and hotels 3.6 ... 2.2 ... ... 2.4 ... 2.4 Miscellaneous goods and services 14.2 ... 14.4 ... ... 14.9 ... 14.7 Other unclassified expenses 0.0 ... 0.3 ... ... 0.3 ... 0.1 Gini Index (per capita expenditure excluding taxes) 0.650 ... 0.670 ... ... 0.640 ... 0.650 Literacy rate (%) (3) ... 24.9 24.3 23.3 22.8 19.9 19.3 18.2 Classification of dwellings by number of rooms (%) (4) 1 room ... 22.8 21.4 23.1 19.1 18.1 18.4 18.0 2 rooms ... 13.6 14.1 13.8 13.3 12.4 10.9 10.5 3 rooms ... 12.2 12.6 12.4 13.6 12.5 12.0 12.2 4 rooms or more ... 51.4 51.9 50.7 54.0 57.1 58.7 59.3 Classification of dwellings tenure (5) ... 70.2 70.0 67.7 73.8 65.1 67.3 61.4 Private property ... 57.2 59.8 57.8 61.9 56.0 58.1 ... State-owned ... 12.0 10.3 9.7 12.1 11.0 10.9 ... Municipal property ... 20.6 19.9 22.5 19.3 20.9 20.6 ... Other ... 10.2 10.1 9.9 7.7 12.2 10.4 ... Classification of dwellings by equipment (%) Piped water within the dwelling (1) ... 40.1 41.1 41.5 43.4 42.1 41.6 43.3 Sewerage within the dwelling (1) ... 37.7 34.2 37.9 38.5 38.4 39.0 39.6 City coverage rate of population with access to tap water (%)(6) ... 69.8 71.1 71.6 70.2 69.9 70.6 71.9 Culture, education and health Household expenditure on education, culture and entertainment (%) 6.1 ... 6.6 ... ... ... ... ... Expenditure on education as percentage of total budget (%) 26.0 19.6 19.1 18.5 18.8 18.9 19.5 20.3 Expenditure for medical and health care (%) 14.3 11.2 11.3 11.3 10.9 11.1 11.5 11.8 Physicians (per 1 000 inhabitants) (7) ... 0.3 0.3 0.4 0.4 0.4 0.4 ... Hospital beds (per 1 000 inhabitants) (7) ... 2.2 ... 2.2 2.2 2.2 2.0 ... Sources
a) Statistics South Africa, General Household Survey 2002-2009; Income and Expenditure Survey 2000; Income and Expenditure Survey2005-2006; District Health Information System 2010; and South African Health Review (various issues).
b) National Treasury, Budget Reviews (various issues).Footnotes
(1) Excludes rental estimations for owner occupied dwelling units.
(2) Adjusted for CPI.
(3) Individuals over the age of 20 years who have not completed primary education (equivalent to grade 7 education).
(4) 1-4 rooms. Note: although data is available for 2002 to 2008, the question by which information regarding the number of rooms is gathered changed in 2009, making comparison unwise.
(5) Fully or partially owned.
(6) Piped or tap water in the house or yard, for total population, not only cities.
(7) Per 1 000 uninsured population.
Graph 6.1 (a) - Percentage Share of Public Expenditure on Education to GDP - 2000/2012

Click to enlargeSource: Summary Table of Chapter 6, BRICS Joint Statistical Publication 2014.
Graph 6.1 (b) - Percentage Share of Public Expenditure on Health to GDP - 2005/2012
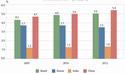
Click to enlargeSource: Summary Table of Chapter 6, BRICS Joint Statistical Publication 2014.
Brazil
Wage - it was considered the monthly wage usually received in the reference month (September of each year) a) Employees: the wage was the gross monthly income that would normally be entitled to the whole working month and, when the income was variable, it was the average monthly income for the month of reference of the survey year. It were not included 13th salary (14th salary and 15th salary etc.) and profit-sharing paid by the enterprise to their employees. Also the amount received in benefits (housing, food, clothing, transport, meal or food stamps etc.) was not included in the calculation of the income of the employees. b) Employers and own account: the income was the withdrawal usually made monthly or, when the gains was variable, the average monthly withdrawal for the month of reference of the survey year. The withdrawal was the gain (gross income less expense incurred with the enterprise, such as paying employees, raw material, electricity, telephones etc.). It was not included the value of the production of the enterprise used for own consumption. Russia
Growth Rate (Index) of Real Wages - relative indicator which is calculated by dividing the indices of accrued wage by consumer price indices for respective period of time. Average nominal accrued wage are compiled by dividing accrued wages fund of employees by average annual payroll number of employees. The accrued wages fund of employees includes sums of payments added to employed in the monetary and not monetary forms for fulfilled and unfinished time, the compensatory payments connected with working conditions, surcharges and extra charges, bonuses, occasional incentive payments and also payments of meal and residing, having regular character. Benefits granted to the employees from the state social extra-budget funds are not included in the wages fund. Number of Physicians include all doctors with the higher medical education engaged in the treatment and sanitary organizations, social security establishments, research institutes, personnel training establishments, in public health management bodies and others. Hospital Beds are the beds equipped with the required appliances and ready to receive patients. Area of Parks and Green Land includes area of the common using green plantations (parks, gardens, squares and parkways) forest parks and city gardens. Gini Index characterizes the level of deviation of the actual distribution of the income of population from the line of the even distribution. India
Gini Coefficient: Gini Coefficient in case of India is calculated by Planning Commision of India on the basis of Consumer Expenditure data ( exependiture is used as proxy for income to meausre inequality) compiled by National Sample Survey Office. The Gini Coefficient is produced both for uniform reference period and mixed reference period. The information included is based on mixed reference period i.e. different recall periods for different items. China
Government Appropriation for Education refers to state budgetary fund for education, taxes and fees collected by governments at all levels that are used for education purpose, education fund for enterprise-run schools, income from school-run enterprises, work-study programme and social services that are used for education purpose. Percentage of Urban Population with Access to Gas refers to the ratio of the urban population with access to gas to the total urban population at the end of the reference period. Urban Green Areas per Capita refers to the ratio of the urban green areas to the total urban population. Area of Urban Green Areas refers to the total area occupied for green projects at the end of the reference period, including park green land, protection green land, green land attached to institutions and other green land. Regular Institutions of Higher Education refer to educational establishments set up according to the government evaluation and approval procedures, recruiting graduates from senior secondary schools as the main target by National Matriculation TEST. They include full-time universities, colleges, institutions of higher professional education, institutions of higher vocational education, institutions of higher vocational education and others (non-university tertiary, branch schools and undergraduate classes), including total enrollment in full undergraduate courses and in specialized courses. Regular Secondary Schools are classified into regular senior secondary schools and junior secondary schools, including: Regular Senior Secondary School referring to education establishment providing senior secondary education service to graduates of junior secondary school; Regular Junior Secondary School referring to education establishment providing fundamental secondary education service to graduates of primary school; Vocational Secondary Schools include vocational junior secondary school and vocational senior secondary school, referring to education establishment ratified by education authority at county level or above to enroll graduates of primary school and junior secondary school and provide junior or senior vocational education service. Regular Primary Schools refer to education establishments ratified by education authority at county level or above to children of school age and provide primary education service. Special Schools refer to regular or vocational primary or secondary education institutions enrolling children with physical or intellectual disabilities and other special children and teenagers that have demand for special education. Pre-Primary Education Institutions include kindergarten and preschool class. Kindergarten enrolls three-year-old (and above) preschool children and provides care and education service. Establishment of kindergarten shall be approved by education authority at county level or above or town government, and shall be registered in file. In those regions without the resources of providing three year preschool education to preschool children, one-year preschool class can be set up to provide one-year preschool education service to preschool children. Physicians refer to licensed (assistant) doctors. Licensed assistant doctors refer to the medical workers who have obtained the licenses of qualified (assistant) doctors and are employed in medical treatment, disease prevention or healthcare institutions, excluding the licensed (assistant) doctors engaged in management job. The classification of licensed (assistant) doctors is clinician, Chinese medicine, dentist and public health. Number of Licensed (Assistant) Doctors per 1000 Population The formula is: Number of Licensed (Assistant) Doctors per 1000 Population = (Number of Licensed Doctors + Number of Licensed Assistant Doctors) / Population *1000. The population is the figure of household registration from the Ministry of Public Security. Number of Beds of Hospitals and Health Care per 1000 Population = (Number of Beds of Hospitals + Number of Beds of Health Care) / Population *1000. The population is the figure of household registration from the Ministry of Public Security.
Table 7.1 - Summary of Resources and Environment on BRICS Countries - 2000/2012
2000 2005 2006 2007 2008 2009 2010 2011 2012 Utilization of forest area (1 000 hectares) Brazil 545 943 530 494 ... ... ... ... 519 522 ... ... Russia 871 539 870 567 870 755 870 761 870 786 870 807 870 981 871 176 871 814 India(1) 69 843 69 994 70 025 69 965 69 978 69 988 70 006 69 203 ... China 174 909 195 452 195 452 195 452 195 452 207 687 207 687 207 687 207 687 South Africa 1 331 1 334 1 282 1 266 1 257 1 275 1 271 1 273 ... Utilization of perennial crop area (1 000 hectares) Brazil 6245 6355 6 494 6451 6496 6 290 6 315 6 319 ... Russia 1 864 1 800 1 798 1 794 1 793 1 795 1 800 1 802 1 804 India ... ... ... ... ... ... ... ... ... China 11 230 12 530 12 730 13 230 13 930 14 320 ... ... ... South Africa 959 851 832 810 798 792 787 781 ... Carbon dioxide emissions per capita Brazil (kg) 9 409 8 893 ... ... ... ... ... ... ... Russia (kg)(2) 10 840 11 066 11 715 11 550 11 622 10 329 10 967 11 835 ... India (MT)(3) 1.0 1.1 ... 1.2 1.3 1.4 ... ... 1.4 China (kg) 11 230 12 531 12 731 13 231 13 926 14 321 14 616 14 716 ... South Africa (kg) 8.1 8.5 8.6 8.8 ... ... ... ... ... Sulfur dioxides emissions per capita Brazil (g/m3)(4) 82 68 66 80 56 39 48 ... ... Russia (kg)(5) 37 33 33 32 32 31 31 30 30 India (kg) ... ... ... ... ... ... ... ... ... China (kg)(6) 16 20 20 19 18 17 16 17 16 South Africa (kg) ... ... ... ... ... ... ... ... ... Sources
Brazil
a) Global forests resources assessment - FRA 2010.
b) Brazilian Institute of Geography and Statistics - IBGE, Agricultural Municipal Production Survey.
c) Second National Communication of Brazil to the United Nations Framework Convention on Climate Change, v. 1, part II.
d) National inventory of anthropogenic emissions by sources and removals by sinks of Greenhouse gases. Annex-Estimation of Emissions of Greenhouse Gases by Gas and Sector, 1990 to 2005. Brasilia, 2010.
e) IBGE, Directorate of Surveys, Population Projection of Brazil by sex and age: 1980-2050. Brasilia, 2010.
f) IBGE, Sustainable Development Indicators - Brazil.Russia
a) Federal State Statistics Service of the Russian Federation.
b) Federal Service of State Registration,Cadastre and Cartography.
c) Federal Service for Hydrometeorology and Environmental Monitoring of the Russian Federation (Rosgidromet).India
a) Ministry of Agriculture, Directorate of Economics & Statistics, Land Use Statistics At a (
b) Ministry of Environment & Forests, Forest Survey of India, India State of Forest Report 2011.
c) Ministry of Statistics & Programme Implementation, Towards Achieving Millennium Development goals India 2013.
d) Ministry of Environment & Forests, India Second National Communication to the United Nations Framework Convention on Climate Change.China
a) National Bureau of Statistics of China, China Statistical Yearbook 2010.
b) Ministry of Environmental Protection of China.
c) World Bank WDI Database.South Africa
Millennium indicators, UN.Footnotes
Brazil
(4) Data in concentration (g/m3) for some metropolitan areas (Recife, Salvador-Camacari, Belo Horizonte, Vitoria, Rio de Janeiro, Sao Paulo, Curitiba, Porto Alegre and Distrito Federal) no weighting by population.Russia
(2) By data of Rosgidromet. Data on carbon dioxide emissions,with the account of land use, changing in land use and forestry are taken from the Russian national inventory of antropogenic emissions by sources and absorption by absorbents of greenhouse gases not regulated by Montreal Protocol for 1990-
(5) Emissions from stationary sources.India
(1) Data (except 2011) relates to agricultural year (i.e. July of the year indicated in the table to June next year). Information since 2006-07 is provisional and that for 2011 is based on Estimation by Forest Survey of India.
(3) Per Capita Carbon Di Oxide Emission pertains to emission by fuel combustion using sectoral approach. The figure including Land Use Change & Forestry was 0.7 MT in 2000 and 1.08 in 2007 as per 'India Second National Communication to the United Nations Framework Convention on Climate Change', Ministry of Environment & Forests.China
(6) Data of sulfur dioxide emissions per capita refer to the ratio of the volume of sulphur dioxide emission to the average population of the year.
Table 7.2.1 - Selected Data on Resources and Environment - Brazil - 2000/2012
2000 2005 2006 2007 2008 2009 2010 2011 2012(3) Natural resources Fresh water resources - Total (m3s-1)(1) 247 889 224 185 228 460 228 221 215 991 216 473 220 294 246 432 231 916 Number of protected areas ... ... ... ... ... 304 ... ... 313 Area of protected areas (1 000 hectares) ... ... ... ... ... 73 987 ... ... 75 058 Main mineral reserves Crude oil (million barrels) 12 961 16 132 18 175 20 380 20 854 21 134 28 467 30 082 28 555 National gas (million m3) 360 782 454 453 588 617 584 472 589 207 601 518 824 723 906 531 918 569 Limestone (million) 45 459 758 49 410 979 46 030 563 48 820 639 50 324 342 53 006 699 ... ... ... Ornamental stone (million) ... 17 801 431 17 997 028 15 785 616 26 671 132 27 192 276 ... ... ... Iron (million) 11 275 749 26 474 000 26 130 000 19 632 244 40 000 000 20 000 000 20 359 000 29 604 000 19 948 000 Magnesia and dolomite (million) 3 474 339 345 000 345 000 345 000 558 071 300 859 298 626 240 777 239 342 Coal (million) 7 378 006 10 113 000 9 300 000 9 300 000 9 300 000 2 488 000 2 484 000 2 392 000 2 154 000 Clays (million) 1 805 011 6 011 254 4 808 392 5 549 421 5 857 767 6 224 376 ... ... ... Mica (million) 104 1 235 1 235 (2) 0 0 4 000 <4 000 <4 000 Kaolin (million) 2 467 966 5 000 000 7 251 000 7 300 000 7 300 000 7 300 000 7 300 000 7 200 000 7 353 000 Industrial sands (million) 1 608 2 440 2 578 2 693 2 737 2 662 ... ... ... Aluminum (bauxite) (million) 1 784301 3 540 000 3 540 000 3 600 000 2 607 000 1 645 000 2 600 000 5 670 000 5 900 000 Feldspar, leucite and nepheline ... 302 444 ... 425 163 317 317 317 Syenite (million) 498 278 1 027 299 1 113196 1 160169 1 185 622 1 241877 ... ... ... Gypsum (million) 888 639 1 233 485 1 301467 1 299 843 1 302 474 228 411 228 411 230 000 288 490 Talc (million) 57 031 125 800 186 143 106 911 180 000 180 000 227 000 46 243 44 834 Salt (million) ... 30 319 30 319 30 319 0 21 637 21 653 21 633 21 632 Other ornamental stone (million) ... 421 448 250 107 381 931 400 828 391 648 ... ... ... Sources
a) Instituto Chico Mendes de Conservacao da Biodiversidade - ICMbio. Available in: <http://www.icmbio.gov.br/portal/images/ stories/servicos/geoprocessamento/DCOL/dados_tabulares/Dados_Gerais_das_UC_jan_2014.pdf> Accessed January 2014.
b) Water National Agency - ANA, Conjuncture of Water Resources in Brazil - Report 2013. Available in: http://www2.ana.gov.br/Paginas/default.aspx
c) Ministry of Mines and Energy, National Department of Mineral Production - DNPM and the National Petroleum Agency. Available in: http://www.dnpm.gov.br/conteudo.asp?IDSecao=68&IDPagina=64. Accessed January 2014.
d) Ministry of Environment, National Register of Protected Areas. Available in <www.mma.gov.br/cadastro_ucFootnotes
(1) Historical average 214 361 is the best information available until 2012.
(2) In 2007 the data of main mineral reserve of mica was qualitative and was classified as plentiful.
(3) Data updated in 03/11/2011.
Table 7.2.2 - Selected Data on Resources and Environment - Russia - 2000/2012
2000 2005 2010 2011 2012 Natural resources Fresh water resources (million.cu.m) (1) 4 523 000 4 556 600 4 331 700 4 398 700 4 217 900 Annual flows (million.cu.m) (2) 61 771 56 229 53 457 53 473 51 594 Number of protected areas (3) 135 135 141 143 144 Area of protected areas (1 000 hectares) (3) 40 057 40 690 41 528 43 007 43 257 Main mineral reserves (4) Coal (billion tons) 277 270 273 273 274 Iron ore (billion tons) 102 99 99 99 101 Manganese ore (million tons) 155 188 232 232 232 Copper (million tons) 85 85 90 93 91 Lead (million tons) 20 20 20 20 19 Zinc (million tons) 61 61 61 61 60 Bauxite (million tons) 1 540 1 474 1 437 1 431 1 427 Tungsten (1 000 tons) 1 717 1 690 1 481 1 470 1568 Tin (1 000 tons) 2 302 2 278 2 262 2 222 2168 Antimony (1 000 tons) 296 265 315 317 318 Gold (1 000 tons) 9 8 12 13 15 Silver (1 000 tons) 110 112 112 114 116 Graphite mineral (million tons) 88 88 88 88 88 Emissions per capita of nitrogen oxides (kg) (5) 12 12 13 13 14 Emissions per capita of carbon monoxide (kg) (6) 34 45 39 40 42 Expenditure on environment protection as % of GDP (%) 1.5 1.1 0.8 0.8 0.7 Source
a) Federal States Statistics Service of the Russian Federation.
b) Federal Agency for Water Resources.
c) Federal Agency for Subsoil Usage (Rosnedra) of the Russian Federation.
d) Federal Service for Hydrometeorology and Environmental Monitoring of the Russian Federation (Rosgidromet).
e) Ministry of Natural Resources and Environment of the Russian Federation.Footnotes
(1) By the data of Rosgidromet. The data on total volume of a river drain (flows).
(2) The data are produced and disseminated by the Federal Agency for Water Resources.
(3) Data on state strict nature reserves and national parks.
(4) By the data of Ministry of Natural Resources and Environment of the Russian Federation.
(5) The data on emissions of nitrogen oxide converted to NO2 from stationary sources.
(6) Emissions from stationary sources.
Table 7.2.3 - Selected Data on Resources and Environment - India - 2000/2013
2000 2006 2007 2008 2009 2010 2011 2012 2013 Natural resources Fresh water resources (1) Total (billion cu.m) 1 123 1 123 1 123 1 123 1 123 1 123 ... ... ... Surface (billion cu.m) 690 690 690 690 690 690 ... ... ... Ground (billion cu.m) 433 433 433 433 433 433 ... ... ... Number of protected areas (2) National parks 89 96 98 99 99 102 102 102 102 Wildlife sanctuaries 489 506 510 513 513 516 517 524 526 All protected areas (2) (3) 578 606 619 661 661 669 675 686 689 Area of protected areas (2) National parks (sq. kms.) 37 594 38 183 38 220 39 233 39 233 40 074 40 074 40 074 40 074 Wildlife sanctuaries (sq. kms.) 117 882 120 244 120 544 122 138 122 138 122 586 122 616 123 548 124 235 All protected areas (sq. kms.)(2) (3) 155 476 158 470 158 879 162 651 162 651 164 063 164 512 165 642 166 348 Main mineral reserves (4) Crude oil (million tons) 703 756 725 770 773 775 757 760 758 Natural gas (billion cubic metres) 760 1 075 1 055 1 090 1 115 1 149 1 278 1 330 1 355 Coal (billion tons) (5) ... ... ... ... ... 267 ... ... ... Iron ore (million tons) 7 063 ... ... ... ... 8 116 ... ... ... Manganese ore (1 000 tons) 138 152 ... ... ... ... 141 977 ... ... ... Copper (1 000 tons) ... ... ... ... ... 399 140 ... ... ... Ore (1 000 tons) 125 754 ... ... ... ... 108 980 ... ... ... Lead metal (1 000 tons) 2 591 ... ... ... ... 2 245 ... ... ... Zinc metal (1 000 tons) 11 093 ... ... ... ... 12 453 ... ... ... Lead and zinc metal (1 000 tons) - ... ... ... ... 118 ... ... ... Bauxite (1 000 tons) 899 384 ... ... ... ... 592 938 ... ... ... Nickel (1 000 tons) ... ... ... ... ... 188 710 ... ... ... Tungsten (1 000 tons) ... ... ... ... ... 87 387 ... ... ... Tin (1 000 tons) 250 ... ... ... ... 1 139 ... ... ... Antimony (1 000 tons) - ... ... ... ... 174 ... ... ... Gold (1 000 tons) 19 254 ... ... ... ... 24 125 ... ... ... Silver (1 000 tons) 115 913 ... ... ... ... 187 567 ... ... ... Graphite mineral (1 000 tons) 10 750 ... ... ... ... 8 032 ... ... ... Expenditure on environment (million ₹) (5) 1 061 ... 2 242 2 404 2 530 4 656 5 049 ... ... Expenditure on environment as % of GDP (%) 0 ... 0 0 0 0 0 ... ... Sources
a) Ministry of Water Resources, Central Water Commission, Water & Related Statistics December 2010.
b) Ministry of Environment & Forests, Wildlife Institute of India, National Wildlife Database.
c) Ministry of Petroleum & Natural Gas, Indian Petroleum & Natural Gas Statistics.
d) Ministry of Mines, Indian Bureau of Mines.Footnotes
(1) The data are constant estimates based on studies conducted by Central Water Commission on Reassessment of water resources.
(2) Includes both terrestrial and marine protected ares. The information is as on 31st December except for 2011 where it is as on September 2011 and 2012 where it is as on February 2013.
(3) Includes National Parks, Wild Life Sanctuaries, Conservation Reserves & Community Reserves.
(4) As on 31st March/1st April.
(5) Expenditure on environment is as per financial year (i.e. April of the year indicated in the table to March next year) and GDP estimate is based on current market price.
Table 7.2.4 - Selected Data of Resources and Environment - China - 2000/2012
2000 2009 2010 2011 2012 Natural resources Fresh water resources (million cu.m) 2 770 080 2 418 020 3 090 641 2 325 670 2 952 879 Number of protected areas 1 227 2 541 2 588 2 640 2 669 Area of protected areas (1 000 hectares) 98 210 147 747 149 441 149 711 149 787 Main mineral reserves Crude oil (1 000 tons) ... 2 949 198 3 174 353 3 239 679 3 332 583 Natural gas (million cu.m) ... 3 707 420 3 779 320 4 020 640 4 378 988 Coal (million tons) ... 318 960 279 390 215 790 229 886 Iron ore (million tons) ... 21 300 22 200 19 280 19 477 Manganese ore (1 000 tons) ... 185 766 195 156 182 409 209 382 Copper (1 000 tons) ... 29 510 28 707 28 124 27 344 Lead (1 000 tons) ... 13 401 12 720 12 917 14 547 Zinc (1 000 tons) ... 38 385 32 514 31 244 34 907 Bauxite (1 000 tons) ... 839 239 897 327 1 050 643 905 900 Nickel (1 000 tons) ... 2 818 3 121 2 720 2 609 Tungsten (1 000 tons) ... 2 287 2 208 1 567 2 338 Tin (1 000 tons) ... 1 435 1 382 1 388 1 175 Antimony (1 000 tons) ... 765 710 558 450 Gold (1 000 tons) ... 2 2 2 2 Silver (1 000 tons) ... 38 36 36 37 Graphite mineral (1 000 tons) ... 54 320 54 123 62 299 48 794 Investment in the treatment of environment pollution as % of GDP (%) 1.02 1.54 1.90 1.50 1.59 Sources
a) Ministry of Environmental Protection of the People's Republic of China, Annual Statistical Reports 2000-2012.
b) The Ministry of Water Resources of the People's Republic of China, Annual Statistical Reports 2000-2012.
c) National Bureau of Statistics of the People's Republic of China, China Statistical Yearbook, 2009-2013.
Table 7.2.5 - Selected Data of Resources and Environment - South Africa - 2000/2010
2000 2005 2008 2010 Natural resources Number of protected areas ... ... ... 488 Area of protected areas (1 000 hectares) ... ... ... 76 054 Main mineral reserves Iron ore (million tons) ... ... 1 500 ... Manganese ore (1 000 tons) ... ... 4 000 000 ... Copper (1 000 tons) ... ... 13 000 ... Lead (1 000 tons) ... ... 3 000 ... Zinc (1 000 tons) ... ... 15 000 ... Nickel (1 000 tons) ... ... 12 000 ... Antimony (1 000 tons) ... ... 200 ... Gold (1 000 tons) ... ... 31 ... Expenditure on environment protection as % of GDP (%) 0.01 ... 0.01 0.01 Sources
a) Department of Water Affairs, 2010.
b) Department of Environmental Affairs, 2010.
Graph 7.1 - Utilization of Forest Area - 2010
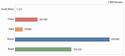
Click to enlargeSource: Summary Table of Chapter 7, BRICS Joint Statistical Publication 2014.
Footnote: It was established 2010 as the last year of data update, because only this year shows the data for all BRICS countries.
Brasil
Fresh Water Resources - Historical Average 214 361 is the best information available until 2012.
Sulfur Dioxides Emissions per Capita - Data in concentration (g/m3) for some metropolitan areas (Recife, Salvador-Camacari, Belo Horizonte, Vitoria, Rio de Janeiro, Sao Paulo, Curitiba, Porto Alegre and Distrito Federal) no weighting by population.India
Per Capita Carbon Di Oxide Emission: This has been derived by dividing total carbon di oxide emission by mid year population. Figures indicating net carbon di oxide emission (including removal) with land use change and forestry are occasionaly communicated to United Nations Framework Convention on Climate Changeby Ministry of Environment & Forests. Time series information included however relates only to emission by fuel combustion using sectoral approach as provided by International Energy Agency.China
Total Water Resources refer to total volume of water resources measured as run-off for surface water from rainfall and recharge for groundwater in a given area, excluding transit water.
Natural Reserves refer to certain areas of land, waters or sea that are representative in natural ecological systems, or are naturalhabitats for rare or endangered wild animals or plants, or water conservation zones, or the location of important natural or historicrelics, which are demarked by law and put under special protection and management. Natural reserves are designated by the formalapproval of governments at and above county level. Scenic spots and cultural preservation zones are not included.
Investment in the Treatment of Environment Pollution refers to the proportion of investment in fixed assets in the total investment in harnessing industrial pollution and in the construction of urban environment infrastructure facilities. It includes investment in harnessing sources of industrial pollution, investment in environment protection facilities designed concurrently with construction projects, and investment in urban environment infrastructure facilities.Russia
Freshwater Resources include internal renewable freshwater resources (river flows and groundwater from rainfall in the country).
Annual Fresher Water Withdrawals are water withdrawals, not counting losses from storage basins.
Table 8.1 - Summary of Industry on BRICS Countries - 2000/2013
2000 2007 2008 2009 2010 2011 2012 2013 Indices of industrial production (preceding year = 100) Brazil 106.6 106.0 103.1 92.9 110.2 100.4 97.7 102.2 Russia 108.7 106.8 100.6 89.3 107.3 105.0 103.4 (1) 100.4 India (2) 105.0 115.6 102.5 105.3 108.2 102.9 101.1 100.0 China (3) 111.4 118.5 112.9 111.0 115.7 113.9 110.0 109.7 South Africa 103.7 104.6 100.7 87.1 104.9 102.6 102. ... Production of petroleum Brazil (million tons) 62.0 88.0 92.0 99.0 104.0 106.5 104.6 (4)102,4 Russia (million tons) (5) 324.0 491.0 488.0 494.5 506.0 512.4 519.0 (1) 523.0 India (million tons) (2) 32.4 34.1 33.5 33.7 37.7 38.1 37.9 ... China (million tons) 160.3 186.3 190.4 189.5 202.4 202.9 205.7 209.0 South Africa million (kl) (6) 21.0 26.0 ... ... ... ... ... ... Electricity production (billion kilowatt/hours) Brazil 349.0 449.0 463.0 463.0 516.0 533.0 552.5 (7) 527.0 Russia 877.8 1 015.3 1 040.4 992.0 1 038.0 1 054.9 1 069.0 (1) 1 051.0 India (2) (8) 561.0 813.0 841.0 906.0 966.0 1 057.0 1 113.0 ... China 1 355.6 3 281.6 3 495.8 3 714.7 4 207.2 4 713.0 5 021.0 5 397.6 South Africa 211.0 263.0 258.0 250.0 260.0 263.0 258.0 ... Sources
Brazil
a) Brazilian Institute of Geography and Statistics - IBGE, Indices of Industrial Production 2000-2013.
b) National Agency of Petroleum, Natural Gas and Biofuels - ANP.
c) Electric System National Operator - ONS.
d) Energy Research Company - EPE.Russia
Federal State Statistics Service of the Russian Federation.India
a) Ministry of Statistics and Programme Implementation, Press Release of Quick Estimates of Index of Industrial Production.
b) Ministry of Petroleum & Natural Gas, Indian Petroleum & Natural Gas Statistics (various issues).China
National Bureau of Statistics of the People's Republic of China, Annual Industrial Statistical Report2000-2012; Monthly Industrial Production Survey 20002013; and Statistical Communique of the People's Republic of China on the 2013 National Economic and Social Development.South Africa
South African Petroleum Industry Association.Footnotes
Brazil
(4) Refers January to November and the source is the National Petroleum Agency.
(7) Electricity Production data is from Energy Research Company - EPE.Russia
(1) 2013 - Preliminary data.
(5) Including natural gas liquids.India
(2) The data of India pertains to fiscal year i.e. April (of the year mentioned in the table) to March (next year). However the information for 2013 pertains to April- Dec 2013.
(8) Gross Electricity production in utilities (including thermal, hydro & nuclear) and non-utilities.China
(3) Coverage of industrial enterprises above designed size had been adjusted since 2011, i.e., enterprises with annual revenue from principal business over 20 million yuan from 2011 on and over 5 million yuan prior to 2011.South Africa
(6) Includes: Petrol, Jet Fuel, Illum Paraffin, Fuel Oil, Bitumen, LPG.
Table 8.2.1 - Selected Data on Output of Main Industrial Product - Brazil - 2000/2012
Products
2000 2003 2004 2005 2006 2007 2008 2009 2010 2011 2012 Coal (million tons) 6.0 5.0 5.0 6.0 7.0 7.0 7.0 6.8 6.0 7.5 ... Natural gas (million cu.m) (1) 13 328.0 15 199.0 16 345.0 17 880.0 19 781.0 18 094.0 21 608.0 21 141.5 22 938.4 24 073.7 25 832.2 Iron ore (million tons) 218.0 256.0 285.0 357.0 458.0 517.0 409.0 342.9 433.8 468.0 ... Steel (1000 tons) 30 208.0 37 756.0 44 992.0 44 331.0 44 137.0 51 102.0 54 935.0 40 676.8 46 889.1 49 993.5 ... Passenger cars (1 000 sets) 1 320.0 1 473.0 1 874.0 2 176.0 2 215.0 2 463.0 2 706.0 2 679.6 2 915.1 2 849.9 ... Household refrigerators (1 000 sets) 4 350.0 4 876.0 5 335.0 5 294.0 6 105.0 6 414.0 7 022.0 7 599.3 7 861.2 7 970.8 ... TV (1 000 sets) 6 022.0 5 801.0 8 296.0 10 624.0 12 891.0 11 393.0 10 872.0 8 641.5 12 293.2 14 177.1 ... Mobile cellular subscriptions (1 000 sets) (2) 10 921.0 29 330.0 43 020.0 64 285.0 61 720.0 69 265.0 69 523.0 55 845.6 57 617.9 60 842.3 ... Washing machines (1 000 sets) 3 212.0 3 099.0 3 708.0 3 794.0 4 402.0 5 937.0 6 098.0 7 390.6 7 531.6 8 673.5 ... Fertilizers (1000 tons) 19 066.0 21 617.0 31 439.0 20 878.0 21 211.0 27 031.0 28 593.0 23 205.0 24 095.1 28 681.1 ... Sawnwood (1000 cu.m) 13 497.0 15 651.0 20 011.0 23 182.0 29 054.0 22 674.0 26 832.0 18 229.9 19 330.2 21 158.9 ... Paper and paperboard (million tons) 14.0 15.0 16.0 16.0 17.0 19.0 18.9 19.9 20.5 ... Cement (1 000 tons) 36 431.0 34 653.0 34 159.0 39 649.0 41 555.0 44 341.0 52 508.0 52 191.6 69 782.3 73 961.9 ... Cotton woven fabrics (million tons) 0.5 0.5 0.6 0.8 1.0 1.0 1.0 0.6 0.7 0.7 ... Woolen woven fabrics (1 000 sets) 182.0 1 328.0 2 531.0 2 102.0 1 970.0 2 314.0 1 835.0 1 043.3 2 041.8 2 935.5 ... Footwear (ton) (3) 8 865.0 12 073.0 44 227.0 55 351.0 22 364.0 21 091.0 32 396.0 62 977.7 52 425.7 32 483.5 ... Source
Brazilian Institute of Geography and Statisitics - IBGE, Annual Survey of Industry 2000-2011.Footnotes
Since 2005, the Annual Survey of Industry - Product shall investigate all companies with more than 30 employees.
(1) National Petroleum Agency.
(2) Reflects the national production of mobile celular.
(3) This industrial product is partially collected at the unit of measure kg and partially collected at the unit of measure Pair Full information would be: 2011 => 32.483,5 (ton) + 1.494.923,2 (000pairs).
Table 8.2.2 - Selected Data on Output of Main Industrial Products - Russia - 2000/2013
Products
2000 2006 2007 2008 2009 2010 2011 2012 2013(1) Coal (million tons) 258 310 314 329 301 322 336 356 347 Natural gas (billion cu.m) 584 656 653 666 583 651 671 655 668 Iron ore (million tons) (2) 87 102 105 100 87 96 104 104 102 Steel (1 000 tons) 59 150 70 816 72 370 68 711 59 362 66 844 68 114 70 392 68 792 Passenger cars (1 000 sets) 969 1 178 1 294 1 470 600 1 210 1 740 1 964 1 916 Household refrigerators (1 000 sets) (3) 1 327 2 995 3 539 3 728 2 811 3 557 4 100 4 302 4 114 TV (1 000 sets) 1 116 4 601 6 823 7 028 4 878 11 973 14 714 16 170 14 231 Telephone (1 000 sets) 847 308 196 192 171 ... ... ... ... Household washing machines (1 000 sets) 954 2 016 2 713 2 694 2 305 2 761 3 031 3 355 3 830 Mineral fertilizers (1 000 tons) (4) (5) 12 213 16 207 17 300 16 211 14 640 17 957 18 828 17 833 18 327 Sawnwood (1 000 cu.m) (6) 20 583 22 359 24 417 21 783 19 089 22 065 22 636 21 185 20 950 Paper and paperboard (million tons) 5.3 7.4 7.6 7.7 7.4 7.7 7.6 7.8 7.7 Cement (1 000 tons) (7) 32 389 54 731 59 933 53 548 44 266 50 392 56 153 61 691 66 449 Cotton woven fabrics (million sq.m) 1 822 2 222 2 108 1 915 1 477 1 542 1 237 1 389 1 309 Woolen woven fabrics (million sq.m) 54.6 29.0 28.7 23.9 18.1 20.7 19.3 14.1 12.8 Footwear (1 000 pairs) 56 506 78 671 79 237 81 918 81 174 102 533 110 193 103 182 114 048 Source
Federal State Statistics Service of the Russian Federation.Footnotes
(1) Preliminary data.
(2) Since 2010 - concentrate of iron ore.
(3) Household refrigerators and freezers.
(4) In terms of 100% content of nutrients.
(5) Since 2010 - mineral and chemical fertilizers.
(6) Including sleepers. Since 2009 - wood, sawn or chipped lengthwise, sliced or peeled, of a thickness exceeding 6 mm; railway or tramway sleepers of wood, not impregnated.
(7) Since 2010 - portland cement, aluminous cement, slag cement and similar hydraulic cements.
Table 8.2.3 - Selected Data on Output of Main Industrial Products - India - 2000/2012
Products 2000 2005 2006 2007 2008 2009 2010 2011 2012 Coal (million tons) 309.6 407.0 430.8 457.1 492.8 532.0 532.7 533.0 557.5 Natural gas (million cu.m) 29 480.0 32 202.0 31 747.0 32 417.0 32 845.0 47 496.0 52 219.0 47 559.0 40 679.0 Iron ore (pig iron + sponge iron) (million tons) 80.6 154.4 18.7 213.2 213.0 218.6 208.0 168.6 136.0 Crude steel (million tons) 31.0 47.0 51.0 54.0 58.0 66.0 71.0 73.8 78.3 Passenger cars (1 000 sets) 524.0 1 046.0 1 238.0 1 426.0 1 517.0 1 933.0 2 453.0 2 775.0 2 669.0 Household refrigerators (1000 sets) 2 126.0 4 178.0 5 035.0 6 140.0 6 715.0 8 002.0 8 716.0 ... ... TV (picture tubes) (1 000 sets) 4 364.0 6 800.0 7 518.0 6 490.0 6 783.0 9 206.0 ... ... ... Household washing machines (1 000 sets) 733.0 1 711.0 1 806.0 2 191.0 2 564.0 3 049.0 3 080.0 ... ... Fertilizers (1000 tons) (1) 14 752.0 15 575.0 16 095.0 14 707.0 14 334.0 16 221.0 16 378.0 16 360.0 16 275.0 Paper and paperboard (million tons) 5.0 6.0 6.0 6.0 7.0 7.0 ... ... ... Cement (all kinds) (million tons) 104.0 141.0 155.0 168.0 181.0 201.0 210.0 224.0 245.0 Cotton cloth (excluding hosiery) (m.sq.mtrs) 19 718.0 23 873.0 26 238.0 27 196.0 26 898.0 28 914.0 31 718.0 30 570.0 34 152.0 Footwear (million pairs) (2) 173.0 197.0 210.0 220.0 229.0 239.0 ... ... ... Source
a) Ministry of Finance, Economic Survey.
b) Ministry of Petroleum & Natural Gas, Indian Petroleum & Natural Gas Statistics (various issues).
c) Ministry of Road Transport & Highways, Road Transport Year Book.
d) Ministry of Textiles, Office of the Textile Commissioner.
e) Ministry of Mines, Indian Bureau of Mines.
f) Ministry of Steel, Joint Plant Committee.
g) Ministry of Chemicals & Fertilizers, Department of Fertilizers Annual Reports.Footnotes
The data of India pertains to fiscal year i.e. April (of the year mentioned in the table) to March (next year) and the same for 2012 is provisional.
(1) Information relates to production of potassium,nitrogenous and phosphatic nutrient content (i.e. N, P & K) only .
(2) Includes leather footwear - Indian and western type.
Table 8.2.4 - Selected Data on Output of Main Industrial Products - China - 2000-2013
Products
2000 2001 2002 2003 2004 2005 2006 2007 2008 2009 2010 2011 2012 2013(1) Coal (million tons) 1 384.2 1 471.5 1 550.4 1 834.9 2 122.6 2 349.5 2 528.6 2 691.6 2 802.2 2 973.0 3 235.0 3 520.0 3 650.0 3 680.0 Natural gas (million cu.m) 27 200.0 30 329.0 32 661.0 35 015.0 41 460.0 49 320.0 58 553.0 69 240.0 80 299.0 85 269.0 94 848.0 102 689.0 107 040.0 117 050.0 Iron ore (million tons) 222.6 217.0 231.4 261.4 346.3 420.5 588.9 706.7 826.7 881.2 1 077.7 1 307.5 1 309.6 1 451.0 Crude steel (million tons) 128.5 151.6 182.4 222.3 282.9 353.2 419.1 489.3 503.1 572.2 637.2 685.3 723.9 779.0 Cars (1000 sets) 607.0 703.6 1 092.0 2 070.8 2 276.3 2 770.1 3 869.4 4 797.8 5 038.1 7 484.8 9 575.9 10 126.7 10 770.0 12 104.2 Home refrigerators (1 000 sets) 12 790.0 13 512.6 15 988.7 22 425.6 30 075.9 29 870.6 35 308.9 43 971.3 47 999.5 59 304.5 72 957.2 86 992.0 84 270.0 92 610.2 Color TV (1 000 sets) 39 360.0 40 937.0 51 550.0 65 414.0 74 318.3 82 832.2 83 754.0 84 780.1 91 871.4 98 987.9 118 300.3 122 313.4 128 235.2 127 760.5 Mobile telephones (1 000 sets) 52 478.8 80 316.6 121 463.5 182 313.7 237 515.8 303 542.1 480 137.9 548 578.6 559 451.0 681 933.7 998 273.6 1 132 577.1 1 181 545.7 1 455 609.9 Home washing machines (1000 sets) 14 429.8 13 416.1 15 957.6 19 644.6 25 334.1 30 355.2 35 605.0 40 051.0 44 470.0 49 736.3 62 477.3 67 159.4 67 911.2 72 019.0 Chemical fertilizers (1 000 tons) 31 860.0 33 830.1 37 910.0 38 813.1 48 048.2 51 778.6 53 450.5 58 249.8 60 280.5 63 850.1 63 378.6 64 193.9 68 321.0 70 369.6 Sawnwood (1000 cu.m) 6 344.4 7 638.3 8 516.1 11 268.7 15 325.4 17 902.9 24 864.6 28 291.0 28 409.5 32 297.7 37 226.3 44 602.5 55 681.9 62 840.0 Machine-made paper and paperboard (million tons) 24.9 37.8 46.7 48.5 54.1 62.1 68.6 77.9 84.0 89.7 98.3 110.1 109.6 113.7 Cement (million tons) 597.0 661.0 725.0 862.1 966.8 1 068.8 1 236.8 1 361.2 1 423.6 1 644.0 1 881.9 2 099.3 2 209.8 2 416.1 Cotton woven fabrics (million m) 13 922.0 15 398.0 17 254.0 20 086.0 24 200.0 19 658.0 23 549.0 27 112.0 42 364.0 31 962.0 38 330.0 36 526.0 36 959.0 39 270.0 Woolen woven fabrics (million m) 278.3 343.0 326.9 442.9 816.9 329.6 444.8 545.5 850.4 495.1 566.3 518.4 478.7 491.1 Leather footwear (million pairs) 1 468.4 1 335.9 1 522.8 1 816.5 2 743.9 2 525.5 3 003.0 3 229.0 3 315.0 3 546.2 4 193.1 4 266.4 4 496.6 4 925.2 Sources
a) National Bureau of Statistics of the People's Republic of China, Annual Industrial Statistical Report2000-2012; Monthly Industrial Production Survey 2000-2013; and Statistical Communique of the People's Republic of China on the 2013 National Economic and Social Development.
b) State Forestry Administration of the People's Republic of China, Annual Reports 2000-2013.Footnotes
(1) Preliminary data.
Table 8.2.5 - Value of Sales by Product - South Africa - 2000/2013
Value of sales, by product (million ZAR)
2000 2005 2006 2007 2008 2009 2010 2011 2012 2013 Basic iron and steel 35 966 67 627 81 247 101 383 136 229 80 390 95 250 98 755 96 706 103 509 Motor vehicles 48 984 79 387 93 587 97 114 105 610 74 998 88 567 92 886 93 886 105 665 Household appliance 5 923 8 652 9 906 10 090 9 884 9 363 9 611 9 868 10 599 11 252 Basic chemicals (1) 25 753 40 074 46 026 55 139 79 908 57 256 61 968 70 685 76 439 85 927 Sawmilling and planing of wood 3 662 6 548 7 442 8 017 8 165 6 599 7 372 7 860 8 463 9 103 Paper and paper products 25 879 33 434 36 966 39 584 47 488 44 269 48 623 50 190 53 173 56 744 Non-metallic mineral (2) 14 965 27 135 29 946 33 860 36 471 34 677 35 310 37 395 39 059 42 583 Textiles (3) 6 018 6 057 6 051 6 409 6 422 5 702 5 221 5 211 5 236 5 764 Footwear 2 534 2 457 2 588 2 784 3 101 3 159 3 276 3 390 3 609 3 804 Source
Statistics South Africa.Footnotes
(1) Including fertilizers.
(2) Including cement.
(3) Including cotton fabrics.
Graph 8.1 - Index of Industrial Production - 2007-2013
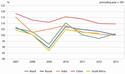
Click to enlargeSource: Summary Table of Chapter 8, BRICS Joint Statistical Publication 2014.
Brazil
The reported data on Output of Main Industrial Product reflect production by manufacturing units with more than 30 employees. Production of Mobile Cellular Subscriptions reflects the national production of mobile celular. Russia
Index of industrial production - the aggregate index by kinds of economic activities "Mining and quarryng ", "Manufacturing", "Electricity, gas and water production and supply". Data are given with the account of adjustment for informal activity. India
Index of Industrial Production is a simple weighted arithmetic mean of production relatives, the weights being proportional to gross value of output as available from ASI factory sector. At the industry indicator levels, the weights were allocated in proportion to their gross value of output.
The new series of All India Index of Industrial Production (IIP) with base 2004-05 has a broader coverage of 682 items (clubbed in 399 item groups: Mining-1, Manufacturing - 397, Electricity - 1) comprising 61 from Mining & Quarrying, 620 from Manufacturing and 1 from Electricity Sector having the weight age of 14.16%, 75.53% and 10.32% respectively in the all-India IIP. National Industrial Classification (NIC)-2004 is being followed.China
Industrial Production Index in China refer to the indices of the PPI-deflated value added of industry (% to the previous year) covering industrial enterprises above the designated size. Industrial enterprises above the designated size refer to those with annual revenue from principal business over 20 million yuan from 2011 on and over 5 million yuan prior to 2011. Sawnwood refers to manufactured woods using wood sawing machine or manual tools to process log into formation of wood of certain width and thickness of sectional dimensions along longitudinal direction.
Table 9.1 - Summary of Energy on BRICS Countries - 2000/2012
2000 2006 2007 2008 2009 2010 2011 2012 Total primary energy production (mtoe) Brazil(1) 153 212 223 237 241 253 257 257 Russia (2) 2 166 2 566 2 601 2 619 2 554 2 675 2 716 2 740 India(3) 204 355 371 389 403 426 448 ... China(4) 945 1 626 1 731 1 824 1 922 2 078 2 226 2 323 South Africa 153 154 154 157 157 ... ... ... Total consumption of energy (mtoe) Brazil(5) 191 226 239 253 244 269 272 284 Russia (2) 1 616 1 754 1 770 1 800 1 738 1 822 1 868 1 893 India(6) 530 745 813 876 987 1 062 1 129 ... China (4) 1 019 1 811 1 964 2 040 2 147 2 275 2 436 2 532 South Africa 91 86 85 92 83 ... ... ... Energy consumption per capita Brazil (kgoe)(7) 1 113 1 238 1 289 1 349 1 288 1 403 1 410 1 456 Russia (tons of standard equivalent)(8) 11.1 12.3 12.4 12.6 12.2 12.8 13.1 13.2 India (kgoe) 531 670 720 765 850 901 946 ... China (kgoe) (9) 807 1 381 1 490 1 540 1 612 1 700 1 812 1 875 South Africa (kgoe) 1 799 1 700 1 680 1 819 1 641 ... ... ... Share of net imports of energy to total consumption (%) Brazil 22.2 8.0 8.0 8.3 3.8 7.5 7.9 11.0 Russia 2.9 1.8 1.9 2.1 1.9 1.7 2.0 1.7 India ... ... ... ... ... 17.1 18.2 ... China 3.2 2.8 8.9 9.2 12.7 14.4 15.5 16.4 South Africa 21.0 25.0 24.0 27.0 26.0 ... ... ... Electricity export Brazil (million kilowatt hours) 7.0 283.0 2 034.2 689.2 1 080.3 1 257.5 2 544.0 467.2 Russia (billion kilowatt hours) 22.9 20.9 18.5 20.7 17.9 19.3 23.7 14.3 India (million kilowatt hours) ... ... 290 58 62 62 128 ... China (million kilowatt hours) 9 880 12 270 14 570 16 640 17 390 19 060 19 310 17 650 South Africa (million kilowatt hours) (10) 4 007 13 766 14 496 14 168 14 052 14 645 Electricity import Brazil (million kilowatt hours) 44 345 41 447 40 866 42 901 41 064 35 906 38 430 40 722 Russia (billion kilowatt hours) 8.8 5.1 5.7 3.1 3.1 1.9 10.0 8.3 India (million kilowatt hours) ... ... 5 230 5 359 5 610 5 610 5 610 ... China (million kilowatt hours) 1 550 5 390 4 250 3 840 6 010 5 550 6 560 6 870 South Africa (million kilowatt hours)(11) 4 719 9 782 11 348 10 572 12 295 12 193 ... ... Electricity consumption Brazil (million kilowatt hours) 321 159 375 378 394 861 409 855 407 273 437 863 456 748 472 048 Russia (billion kilowatt hours) 863.7 980.0 1 002.5 1 022.7 977.1 1 020.6 1 041.1 1 063.3 India (million kilowatt hours) 316 600 455 749 501 977 553 995 612 645 694 392 772 603 ... China (million kilowatt hours) 1 347 240 2 858 800 3 271 180 3 454 140 3 703 220 4 193 450 4 700 090 4 976 260 South Africa (million kilowatt hours) 195 660 231 323 241 170 235 924 229 599 238 272 ... ... Electricity consumption per capita Brazil (million per capita) (12) 1 875 2 052 2 134 2 190 2 151 2 286 2 364 2 424 Russia (kilowatt hours) 5 931 6 851 7 020 7 165 6 843 7 145 7 283 7 425 India (kilowatt hours) (13) (14) 512 672 717 734 779 819 884 917 China (kilowatt hours) 1 067 2 181 2 482 2 608 2 782 3 135 3 497 3 684 South Africa (kilowatt hours) ... ... ... ... ... ... ... ... Sources
Brazil
Ministry of Mines and Energy.Russia
Federal State Statistics Service of the Russian Federation, Short Energy Balance.India
a) Ministry of Statistics & Programme Implementation, Central Statistics Office, Energy Statistics 2013.
b) Ministry of Power, Central Electricity Authority, Executive Summary: Power Sector 2014 (various issues).China
National Bureau of Statistics of the People's Republic of China, China Energy Statistical Yearbook 2000-2013; Statistical Communique of the People's Republic of China on the 2013 National Economic and Social Development; and Annual Industrial Statistical Report 2000-2013.South Africa
Statistcs South Africa, Energy Accounts and Electricity Generated and Available for Distribution: January 2011 (Statistical Release P4141).Footnotes
Brasil
(1) Primary Energy Production: includes natural gas rejected and non-utilized.
(5) Total Consumption: includes sectorial final energy consumption; losses in transformation, distribution and storage; and energy sector final consumption.
(7) Energy Consumption per capita = total consumption/population.
(12) Electricity consumption per capita not includes energy consumption in energy sector and losses.Russia
(2) In million tons of standard fuel (the volumes of natural fuels - oil, coal, gas, oil products etc., which have been recalculated for their own corresponding calorific coal equivalent into the volume of standard fuel).
(8) Tons of standard fuel.India
Information pertains to Financial Year (i.e. April of the year indicated in the table to March next year). Conversion factors have been used for providing data in Oil Equivalents.
(3) Primary Energy does not include thermal electricity.
(6) Includes Energy from coal, crude petroleum & natural gas & electricity (hydro, nucler & thermal).
(13) (Gross Generation + Net Imports) / Mid Year Population. Figure for 2012 is provisional.
(14) Estimated from per capita consumption at the end of 8th and 9th Plan i.e. March 1997 & March 2002.China
(4) Electric power in total primary energy production and total consumption of energy are converted on the basis of equal caloric value.
(9) Energy consumption per capita is calculated by annual average population.South Africa
(10) Physical energy flowing out of South Africa as measured by the metering system at the South African borders.
(11) Physical energy flowing into South Africa as measured by the metering system at the South African borders.
Table 9.2 - Energy Balance - Brazil, Russia, China - 2012
Primary energy production (mtoe) Changes in stocks Imports Exports Total Solids Liquids Gas Electricity Brazil(1) 257 85 107 26 (2)40 -8 80 (3)41 Russia(4) 2 740 (5)240 (6)1 177 761 (7)562 -5 32 848 China(8) 2 323 1 777 207 100 239 -87 (9)466 (9)52 Bunkers Balance Consumption
per capita (kg)Consumption (mtoe) Air Sea Total Solids Liquids Gas Electricity Brazil 2 4 (10)5 (11)1 456 (12)284 98 110 33 44 Russia(4) ... ... ... (13)13 1 893 (5)145 (6)637 555 (7)557 China ... ... 119 1 875 2 532 1 686 476 132 238 Sources
Brazil
Ministry of Mines and Energy of Brazil. Brazillian Energy Balance 2012.Russia
Federal State Statistics Service of the Russian Federation. Short Energy Balance.China
National Bureau of Statistics of the People's Republic of China.Footnotes
Brazil
(1) Primary Energy Production includes natural gas rejected and non-utilized.
(2) Electricity includes hydro, uranium and wind.
(3) Exports include bunkers.
(10) Balance includes only natural gas rejected and non-utilized. It is calculated from other data in the table.
(11) Consumption per capita = total consumption / population.
(12) Total Consumption includes sectorial final energy consumption; losses in transformation, distribution and storage; and energy sector final consumption.Russia
(4) In million tons of standard fuel (the volumes of the natural fuels - oil, coal, gas, oil products etc. which have been recalculated for their own corresponding calorific coal equivalent).
(5) Coal, fuel peat ( conditional humidity), fuel wood.
(6) Oil extracted including natural gas liquids (NGL), products of fuel processing, combustible (fuel) supplementary energy resources.
(7) Electricity and heat.
(13) Tons of standard fuel.China
(8) Primary Energy Production - Solids refer to coal. Liquids refer to petroleum. Gas refers to natural gas. Electricity refers to hydro power, nuclear power and electricity generated by other means such as wind power and geothermal power.
(9) Data on imports and exports are from Customs statistics. The refueling by Chinese ships and airplanes abroad is included in imports. The refueling by foreign ships and airplanes in China is included in exports.
Table 9.2.1 - Summary of Energy - Brazil - 2000/2012
2000 2005 2006 2007 2008 2009 2010 2011 2012 Consumption of crude petroleum (1 000 tons) (1) 80 698 85 980 86 225 88 426 89 627 90 451 90 645 91 958 96 088 Consumption of petrol (1 000 tons) (2) 12 690 13 702 13 884 13 737 13 979 14 110 16 851 20 036 23 513 Electricity consumption (million kWh) (3) 321 159 361 659 375 378 394 861 409 855 407 273 437 863 456 748 472 048 Energy production (million kWh) Thermal (4) 38 459 55 626 56 540 58 320 78 179 60 767 95 738 84 532 115 193 Hydro 304 403 337 457 348 805 374 015 369 556 390 988 403 290 428 333 415 342 Nuclear 6 046 9 855 13 754 12 350 13 969 12 957 14 523 15 659 16 038 Wind 1 93 237 608 1 183 1 146 2 248 2 971 5 925 Source
Ministry of Mines and Energy of Brazil. Brazilian Energy Balance 2013.Footnotes
(1) Consumption of crude petroleum - refinery oil in put.
(2) Consumption of petrol - only motor gasoline (not includes alcohol and biodiesel).
(3) Electricity Consumption - not include energy consumption in energy sector and losses.
(4) Energy production from thermal - includes oil procucts, natural gas, industrial gas, coal and biomass.
Table 9.2.2 - Summary of Energy - Russia - 2000/2012
2000 2005 2006 2007 2008 2009 2010 2011 2012 Consumption of crude petroleum (1 000 tons) (1) 182935 215 831 227 563 232 489 242 041 244 081 255 883 264 900 278 019 Consumption of petrol (1 000 tons) 23 259 26 261 27 893 28 757 31 573 31 280 33 358 33 796 35 061 Electricity consumption (billion kwh) 864 941 980 1 003 1 023 977 1 021 1 041 1 063 Electricity production (billion kwh) 878 953 996 1 015 1 040 992 1 038 1 055 1 069 Thermal 582 629 664 676 710 652 699 717 726 Hydro 165 175 176 179 167 176 168 165 165 Nuclear 131 149 156 160 163 164 170 173 178 Source
Federal State Statistics Service of the Russian Federation.Footnote
(1) Including natural gas liquids.
Table 9.2.3 - Energy Commodity Balance - India - 2007-2011
Coal (1 000 tonnes)
Lignite (1 000 tonnes)
2007 2008 2009 2010 2011(1) 2007 2008 2009 2010 2011(1) Supply and consumption Production 457 082 492 757 532 042 532 694 539 940 33 980 32 421 32 421 37 733 43 105 From other sources - - - - - - - - - - Imports 49 794 59 003 73 255 68 918 98 929 - - - - - Exports 1 627 1 655 2 454 4 409 1 852 - - - - - Stock changes 2 431 -538 -17 547 7 329 1 923 -674 -575 -575 43 2 666 Domestic supply 502 818 549 567 586 068 589 874 635 094 34 654 32 996 32 996 37 690 40 439 Transformation 400 731 381 060 436 562 395 836 403 905 26 985 27 542 27 542 29 899 33 090 Final consumption 503 168 547 370 587 810 523 528 535 731 34 657 32 420 32 420 37 685 42 500 Industry sector 100 283 165 465 147 859 127 692 131 826 7 672 4 878 4 878 7 786 9 410 Iron and steel 20 196 38 850 49 074 40 055 37 327 - - - - - Chemical and petroleum 2 942 3 085 578 409 579 916 700 700 793 850 Non-ferrous metals 656 - 742 1 166 2 145 - - - - - Non-metallic minerals 21 351 21 351 - - - 956 956 956 - - Machinery - - - - - - - - - - Mining and quarrying Paper, pulp and print 2 642 2 158 2 335 2 432 2 779 346 365 365 1 766 1 789 Cement - 19 851 21 613 15 079 13 398 13 116 342 342 361 971 Textile and leather 366 2 534 272 275 280 768 2 068 2 068 1 175 1 123 Non-specified 52 130 77 636 73 245 68 113 75 318 4 686 447 447 3 691 4 677 Other sectors 1 646 845 2 954 - - - - - - - Residential 418 377 29 - - - - - - - Non-specified 1 228 468 2 626 - - - - - - - LPG and ethane (1 000 tons) Naphtha (1 000 tons) 2007 2008 2009 2010 2011(1) 2007 2008 2009 2010 2011(1) Supply and consumption Production 6 732 6 996 8 091 7 541 7 335 16 440 14 826 17 105 17 535 17 176 From other sources 2 060 2 162 2 249 2 189 2 213 - - - - - Imports 2 832 2 360 2 718 4 502 5 084 5 983 5 023 1 734 2 074 1 974 Exports 99 109 131 154 174 9 297 7 601 9 911 10 655 10 139 Stock changes - 1 487 1 484 2 442 3 113 - - 981 1 722 2 094 Domestic supply 11 723 10 734 12 162 14 331 15 358 13 126 12 248 9 909 10 676 11 105 Transformation - - - - - - - - - - Final consumption 11 581 12 193 13 121 14 331 15 358 13 294 9 874 10 239 10 676 11 105 Industry sector 92 1 323 988 985 1 045 7 791 3 202 4 255 3 391 3 754 Iron and steel - 79 83 54 71 109 121 197 Chemical and petroleum 6 6 8 8 20 6 048 1 328 1 495 1 681 1 416 Non-ferrous metals - - - - - - - - - - Non-metallic minerals - - - - - - - - - - Machinery - 21 - 31 32 - - 22 - - Mining and quarrying Paper, pulp and print - - - - - - - - - - Cement 342 - - - - - - - - - Textile and leather - 7 3 3 2 - - - - - Non-specified 86 1 210 872 343 991 1 689 1 803 2 651 1 589 2 141 Other sectors 11 489 10 870 11 908 12 593 13 543 4 750 5 255 4 939 6 866 7 164 Residential 11 173 10 637 11 364 11 682 12 365 - - - - - Non-specified 316 233 544 687 951 4 750 5 255 4 939 6 866 7 164 Kerosene (1 000 tons) Gas/diesel (1 000 tons) 2007 2008 2009 2010 2011(1) 2007 2008 2009 2010 2011(1) Supply and consumption Production 7 794 8 223 7 702 7 702 7 475 59 032 63 495 78 631 78 840 81 901 From other sources - - - - - - - - - - Imports 2 489 1 423 1 381 1 381 544 2 951 2 788 1 996 2 073 1 051 Exports 137 3 701 33 33 34 14 308 77 20 335 20 433 20 491 Intl. marine bunkers - - - - - - - - - - Stock changes - - - 261 -244 - -9 600 -800 409 -2 281 Domestic supply 10 146 9 569 9 050 8 789 8 229 47 660 61 193 61 092 60 071 64 742 Transformation 3 097 3 513 3 857 166 168 Final consumption 9 365 9 303 8 928 8 789 8 229 48 224 63 477 60 445 60 071 64 742 Industry sector 185 43 56 67 61 2 171 14 421 14 631 2 801 2 830 Iron and steel - - - - - 193 217 582 255 311 Chemical and petroleum - - - - - 75 133 465 143 163 Transport equipment - - - - - - 11 947 11 475 106 200 Mining and quarrying - - - - - 369 1 030 1 085 1 366 1 181 Textile and leather - - - - - - 94 113 183 156 Non-specified 185 43 56 67 61 1 534 1 000 911 180 174 Transport sector - - - - - 24 076 30 681 26 246 5 416 5 528 Domestic aviation - - - - - 1 2 - - - Road - - - - - 23 547 27 553 23 530 2 483 2 558 Rail - - - - - 353 2 168 1 987 2 371 2 429 Domestic navigation - - - - - 175 758 729 561 540 Non-specified - - - - - - - - - - Other sectors 9 180 9 260 8 872 8 722 8 045 18 509 13 909 15 009 51 385 55 913 Residential 9 163 9 131 8 804 8 583 7 922 - - - - - Comm. and public services - - - - - - - - - - Agriculture/forestry - - - - - 9 014 10 144 12 507 616 684 Non-specified 17 129 68 139 123 9 495 3 765 2 507 50 769 55 229 Heavy fuel oil (1000 tons) Electricity (GWH)=106 Kwh 2007 2008 2009 2010 2011(1) 2007 2008 2009 2010 2011(1) Supply and consumption Production 15 804 17 684 20 519 20 519 19 456 722 626 746 626 844 846 845 435 923 203 From other sources - - - - - 90 476 95 905 114 224 114 224 128 172 Imports 1 187 1 637 1 013 - 1 128 5 230 5 899 5 610 5 610 5 610 Exports 4 718 6 118 6 734 6 734 7 895 290 37 577 62 62 128 Intl. marine bunkers - 34 - - - - - - - - Stock changes - - -8 415 5 903 5 216 - - - - - Domestic supply 12 239 13 203 23 213 8 807 7 473 818 042 810 853 964 618 965 207 1 056 857 Transformation 625 4 535 4 572 823 647 45 531 47 573 47 407 52 380 57 238 Final consumption 11 878 24 349 26 751 8 807 7 473 623 490 553 272 663 392 663 667 772 603 Industry sector 2 939 9 377 11 065 3 225 3 043 265 406 209 474 237 539 225 019 346 469 Iron and steel 885 2 316 2 473 - - - - - 15 579 29 947 Chemical and petroleum 1 989 3 175 3 759 790 746 - - - 22 990 33 465 Transport equipment - - - 1 237 1 049 - - - 1 458 1 993 Mining and quarrying - 998 1 745 7 45 - - - - - Textile and leather - 176 102 85 52 - - - 2 845 2 371 Non-specified 65 2 712 2 986 666 562 265 406 209 474 237 539 142 029 232 187 Transport sector 315 2 360 2 341 780 371 11 108 60 356 60 543 179 571 149 582 Domestic aviation - - - - - - - - - - Road 55 500 783 - - - - - - - Rail 27 143 - - 11 108 11 425 17 217 17 217 14 327 Domestic navigation 260 847 986 - - - - - - - Non-specified - 986 429 780 371 48 931 43 326 162 354 135 255 Other sectors 7 999 8 077 7 970 3 979 3 412 301 445 399 011 431 405 349 334 409 807 Residential - - - - - 120 918 131 720 156 894 156 894 170 034 Comm. and public services - - - - - 6 131 54 189 59 614 65 168 67 266 Agriculture/forestry - 529 1 047 - - 104 182 109 610 117536 107 536 133 660 Non-specified 7 999 7 548 6 923 3 979 3 412 70 214 103 492 97 361 19 736 38 847 Source
Ministry of Statistics & Programme Implementation, Central Statistics Office, Energy Statistics 2010-2013.Footnotes
Information pertains to Financial Year (i.e. April of the year indicated in the table to March next year) .
(1) Preliminary data.
Table 9.2.4 - Summary of Energy - China - 2000/2013
2000 2005 2006 2007 2008 2009 2010 2011 2012 2013(1) Consumption of crude petroleum, by sector (1 000 tons) Total 212 320 300 862 322 452 340 316 354 982 381 286 428 746 439 658 466 789 ... Agriculture, forestry, animal husbandry, fishery and water conservancy ... ... ... ... ... ... ... ... ... ... Industry 210 521 299 594 320 815 338 679 353 326 379 752 427 166 438 604 465 595 ... Construction 33 ... ... ... ... ... ... ... ... ... Transport, storage and post 1 751 1 269 1 637 1 637 1 657 1 534 1 580 1 054 1 194 ... Wholesale, retail trade and hotel, restaurants 2 ... ... ... ... ... ... ... ... ... Others 14 ... ... ... ... ... ... ... ... ... Residential consumption ... ... ... ... ... ... ... ... ... ... Consumption of petrol, by sector (1 000 tons) Total 35 046 48 549 52 425 55 191 61 455 61 727 68 862 73 960 81 409 ... Agriculture, forestry, animal husbandry, fishery and water conservancy 892 1 596 1 677 1 728 1 604 1 681 1 691 1 860 1 929 ... Industry 6 820 4 417 4 985 5 245 5 861 6 711 6 895 6 048 5 811 ... Construction 1 156 1 721 1 807 1 788 1 962 2 354 2 747 2 828 2 869 ... Transport, storage and post 15 278 24 301 25 924 26 132 30 904 28 816 32 049 33 735 37 530 ... Wholesale, retail trade and hotel, restaurants 698 1 294 1 233 1 317 1 353 1 472 1 682 1 771 2 001 ... Others 7 927 9 982 10 641 11 197 11 219 10 699 11 662 13 132 14 605 ... Residential consumption 2 276 5 238 6 157 7 784 8 551 9 991 12 137 14 586 16 665 ... Electricity consumption (million kwh) Total 1 347 240 2 494 030 2 858 800 3 271 180 3454 140 3 703 220 4 193 450 4 700 090 4 976 260 ... Agriculture, forestry, animal husbandry, fishery and water conservancy 53 296 77 633 82 704 87 896 88 705 93 990 97 649 101 290 101 257 ... Industry 1 000 462 1 852 169 2 126 774 2 429 081 2 538 863 2 685 449 3 087 177 3 469 155 3 623 221 ... Construction 15 977 23 393 27 105 30 900 36 734 42 190 48 324 57 182 60 840 ... Transport, storage and post 28 120 43 034 46 737 53 191 57 182 61 701 73 453 84 842 91 537 ... Wholesale, retail trade and hotel, restaurants 41 868 75 231 84 725 92 982 101 744 113 677 129 200 150 308 169 149 ... Others 62 320 134 091 155 594 170 860 191 297 218 992 245 183 275 305 308 364 ... Residential consumption 145 195 288 481 335 158 406 271 439 610 487 216 512 463 562 006 621 896 ... Electricity production (million kwh) Thermal 1 114 190 2 047 336 2 369 603 2 722 933 2 790 080 2 982 776 3 331 928 3 833 702 3 959 210 4 235 870 Hydro 222 414 397 017 435 786 485 264 585 190 615 644 722 172 698 945 863 430 911 640 Nuclear 16 737 53 088 54 843 62 130 68 402 70 134 73 880 86 350 97 394 110 630 Sources
National Bureau of Statistics of the People's Republic of China, China Energy Statistical Yearbook 2000-2013; Statistical Communique of the People's Republic of China on the 2013 National Economic and Social Development; and Annual Industrial Statistical Report 2000-2013.Footnotes
(1) Preliminary data.
Table 9.2.5 - - Summary of Energy - South Africa - 2009
Coal Crude Oil Electricity Gas to users Hydro Nuclear Petroleum products Renewables and waste Total energy supply or use Energy supply (trillion joules) a. Domestic production 5 900 290 6 603 865 335 92 451 15 097 .. 26 993 428 6 907 197 b. Imports 4 797 1 068 203 38 246 45 383 ... ... 9 296 ... 1 165 926 c. Total supply (a+b) 5 905 087 1 074 806 903 581 137 834 15 097 ... 36 289 428 8 073 123 Energy use (trillion joules) a. Intermediate consumption by industries 2 196 784 1 074 806 475 522 177 998 9 895 ... 29 233 ... 3 964 238 Agriculture and fishing 679 ... 21 029 ... ... ... 1 247 ... 22 956 Commercial sector 102 451 ... 103 798 864 ... ... 1 299 ... 208 412 Construction ... ... 325 ... ... ... 721 ... 1 046 Electricity, gas and steam production 636 515 ... 14 766 72 314 9 895 139 702 ... ... 776 217 Manufacturing 1 405 978 1 074 806 335 491 101 920 ... ... ... ... 1 074 806 Mining and wuarrying 51 161 112 ... ... ... 906 ... 55 079 Transport, storage and communication ... ... 610 ... ... ... 25 060 ... 25 670 b. Inventory changes ... ... 0 ... ... ... ... ... 0 c. Private consumption, total 204 902 ... 142 815 ... ... ... 835 190 348 742 Heating, use of electricity etc. 204 902 ... 142 815 ... ... ... 2 658 ... 350 375 d. Exports 1 457 203 657 48 920 0 ... ... 3 505 ... 1 510 285 e. Losses in distribution ... ... 33 646 ... ... 33 646 f. Total use (a+b+c+d+e) 3 858 889 1 075 463 700 903 177 998 9 895 139 702 36 231 428 25 517 517 Energy flow diagrams Total (%) 100.0 100.0 100.0 100.0 100.0 100.0 100.0 100.0 ... Agriculture and fishing ... ... ... ... ... ... 3.0 ... ... Commercial sector 3.0 0.0 15.0 0.0 0.0 ... 4.0 ... ... Construction ... ... ... ... ... ... 9.0 ... ... Electricity, gas and steam production 16.0 ... 2.0 41.0 100.0 100.0 ... 56.0 ... Manufacturing 36.0 100.0 48.0 57.0 ... ... ... ... ... Mining and quarrying 1.0 0.0 0.0 2.0 0.0 ... 3.0 ... ... Transport, storage and communication ... ... ... ... ... ... 69.0 44.0 ... Domestic 5.0 0.0 20.0 0.0 0.0 ... 2.0 ... ... Exports 38.0 0.0 7.0 0.0 0.0 ... 10.0 ... ... Stock changes ... ... ... ... ... ... ... ... ... Imports (%) 0.0 99.0 5.0 25.0 0.0 ... 26.0 ... ... Source
Department of Energy, 2009.Footnote
(1) Nuclear figure is equivalent to electricity produced from nuclear plants.
Graph 9.1 (a) - Total Primary Energy Production - 2009/2012
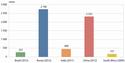
Click to enlargeSource: Summary Table of Chapter 9, BRICS Joint Statistical Publication 2014.
Graph 9.1 (b) - Total Consumption of Energy - 2009/2012
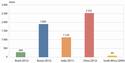
Click to enlargeSource: Summary Table of Chapter 9, BRICS Joint Statistical Publication 2014.
Brazil
Consumption of crude petroleum: refinery oil in put. Consumption of petrol not includes alcohol and biodiesel, only motor gasoline. Electricity Consumption not include energy consumption in energy sector and losses. Energy production from thermal includes oil procucts, natural gas, industrial gas, coal and biomass. Primary Energy Production includes natural gas rejected and non-utilized. Electricity includes hydro, uranium and wind. Exports include bunkers. Balance includes only natural gas rejected and non-utilized. It is calculated from other data in the table. Energy Consumption per capita = total consumption / population Total Consumption includes sectorial final energy consumption; losses in transformation, distribution and storage; and energy sector final consumption. Russia
The mean of computation standard (conventional) fuel: the volumes of natural fuels (oil, coal, gas, oil products etc.) are recalculated for their own corresponding calorific coal equivalent into the volumes of standard fuel. India
Total Primary Energy Production: Primary Energy does not include thermal electricity. Electricity Consumption Per Capita = (Gross Generation + Net Imports) / Mid Year Population China
Total Primary Energy Production refers to the total production of primary energy by all energy producing enterprises in the country in a given period of time. It is a comprehensive indicator to show the level, scale, composition and pace of development of energy production of the country. The production of primary energy includes that of coal, crude oil, natural gas, hydro-power and electricity generated by nuclear energy and other means such as wind power and geothermal power. However, it does not include the production of fuels of low calorific value, bio-energy, solar energy and secondary energy converted from primary energy. Total Primary Energy Production 2013 figure is also avaiable 2380 mtoe. Total Consumption of Energy refers to the total consumption of energy of various kinds by the production sectors and the households in the country in a given period of time. It is a comprehensive indicator to show the scale, composition and pace of increase of energy consumption. Total energy consumption includes that of coal, crude oil and their products, natural gas and electricity. However, it does not include the consumption of fuel of low calorific value, bio-energy and solar energy. Total energy consumption can be divided into three parts: end-use energy consumption; loss during the process of energy conversion; and energy loss.
Total Consumption of Energy 2013 figure is also avaiable 2625 mtoe.
10 Agriculture, Forestry, Animal Husbandry and Fishery
Table 10.1 - Summary of Agriculture, Forestry, Animal Husbandry and Fishery on BRICS Countries - 2000/2013
2000 2005 2006 2007 2008 2009 2010 2011 2012 2013 Area of cultivated land (million hectares) Brazil(1) 50 63 61 62 65 64 65 67 69 (2)67.8 Russia(3) 124 122 122 122 122 122 121 121 122 ... India(4) 156 155 155 156 156 155 156 ... ... ... China(5) 130 130 130 130 122 135 ... ... ... ... South Africa ... ... ... ... ... ... ... 12 ... ... Production of cereal (million tons) Brazil(6) 45 53 57 67 77 68 73 75 87 98 Russia 65 78 78 82 108 97 61 94 71 92 India(4) 186 195 203 216 220 203 226 242 239 (7)243 China 405 428 451 456 478 482 496 519 539 553 South Africa(8) 14 ... 9 9 15 15 15 13 14 14 Production of meat (1 000 tons) Brazil(9) 10 326 16 368 17 349 18 517 19 472 19 532 20 749 21 575 22 036 (2) 23.632 Russia(10) 4 446 4 990 5 278 5 790 6 268 6 719 7 167 7 519 8 090 (11)8 542 India (12) (13) 1 851 2 312 2 302 4 009 4 280 4 566 4 869 5 514 ... ... China 60 139 69 389 70 890 68 657 72 787 76 497 79 258 79 651 83 872 85 350 South Africa(14) 1 554 ... 2 097 2 167 2 236 2 305 2 460 2 442 2 477 2 556 Catch of fish (1 000 tons) Brazil(15) 667 751 779 783 791 825 785 ... ... ... Russia 3 776 3 212 3 264 3 417 3 333 3 728 ... ... ... ... India(12) 5 655 6 572 6 869 7 127 7 616 7 998 8 231 8 666 ... ... China 9 377 9 070 9 240 9 200 9 511 9 567 9 870 10 222 11 618 11 730 South Africa ... ... ... ... ... ... ... ... ... ... Sources
Brazil
a) Brazilian Institute of Geography and Statistics - IBGE, Agricultural Municipal Production Survey; and Quarterly Animal Slaughter Survey.
b) Ministry of Fishery and Aquaculture, Fishery Data 2008-2010.
c) Brazilian Institute of Environment and Renewable Natural Resources - IBAMA, Fishery Data 2000-2007.Russia
a) Federal State Statistics Service of the Russian Federation.
b) Federal Service of State Registration, Cadastre and Cartography.India
a) Ministry of Agriculture, Directorate of Economics & Statistics, Area Production Yield Statistics Database; Land Use Statistics at a Glance; and Advance Estimates.
b) Ministry of Agriculture, Annual Reports of Department of Animal Husbandary, Dairying & Fisheries (2004-2005 & 2012-2013).China
a) National Bureau of Statistics of the People's Republic of China, China Statistical Yearbook 2000-2013, and Statistical Communique of the People's Republic of China on the 2013 National Economic and Social Development.
b) Ministry of Land and Resources of the People's Republic of China.South Africa
a) Statistics South Africa.
b) Department of Agriculture, Forestry and Fisheries.Footnotes
Brazil
(1) Harvested area.
(2) Provisional data.
(6) Major cereals (corn, rice and wheat).
(9) Major meat (beef, chicken and pork).
(15) Fishery data refers only to the marine and continental extractive fisheries.Russia
(3) The data are produced and disseminated by the Federal Service of State Registration, Cadastre and Cartography. At the end of the year.
(10) Production of livestock and poultry for slaughter.
(11) Provisional data.India
(4) The period of agricultural year is from July (of the year indicated in the table) to June (next year).
(7) As per Second Advance Estimates.
(12) The data pertains to Financial Year i.e. April (of the year indicated in the table) to March (next year).
(13) Meat production from commercial poultry farm is included from 2007-08.China
(5) Data of area of cultivated land of China between 2000 to 2007 is calculated according to the "Communique of Main Data on Land Use Survey" from the First National Agricultural Census of China in 1996. Data of 2008 is from the " Survey of change of land". Data of 2009 is from the "Communique of Main Data from the Second National Land Survey" (Released on 30 December 2013 by the Leading Group Office of the Second National Land Survey of the State Council).
(14) Preliminary data.South Africa
(8) Major cereals (maize/corn, wheat, malting barley, sorghum).
(14) Major meat (beef and veal, mutton, goats, poultry)
Table 10.2.1 - Selected Data on Agriculture, Forestry, Animal Husbandry and Fishery - Brazil - 2000/2013
2000 2006 2007 2008 2009 2010 2011 2012 2013(1) Harvested areas of farm crops (million hectares) Total 50.2 61.3 61.7 64.6 64.5 65.3 67.3 67.4 67.8 Structure of farm products area by main species (%) Soybean 27.2 35.9 33.3 32.9 33.7 35.7 35.6 37.1 41.1 Corn 23.7 20.6 22.3 22.4 21.2 19.8 19.6 21.1 22.6 Sugarcane 9.6 10.4 11.5 12.6 13.2 14.0 14.3 14.4 14.5 Beans 8.6 6.6 6.1 5.9 6.4 5.6 5.5 4.0 4.2 Rice 7.3 4.8 4.7 4.4 4.5 4.3 4.1 3.6 3.5 Coffee 2.3 2.5 3.0 3.7 3.8 3.3 3.2 3.1 3.0 Wheat 4.5 3.8 3.7 3.4 3.3 3.3 3.2 2.8 3.3 Cassava 3.4 3.1 3.1 2.9 2.7 2.8 2.6 2.5 2.2 Cotton 1.6 1.5 1.8 1.6 1.3 1.3 2.0 2.1 1.4 Orange 1.1 1.2 1.1 1.3 1.2 1.3 1.2 1.1 1.0 Cashew nuts 1.7 1.3 1.3 1.3 1.2 1.2 1.1 1.1 ... Sorghum 1.3 1.2 1.2 1.2 1.2 1.0 1.1 1.0 1.2 Cocoa 1.4 1.1 1.0 1.0 1.0 1.0 1.0 1.0 1.0 Banana 1.0 0.8 0.8 0.8 0.7 0.8 0.7 0.7 ... Tobacco 0.6 0.8 0.7 0.7 0.7 0.7 0.7 0.6 ... Coconut 0.5 0.5 0.5 0.4 0.4 0.4 0.4 0.4 ... Oats 0.4 0.5 0.5 0.4 0.4 0.3 0.2 0.3 0.3 Sisal 0.4 0.2 0.3 0.2 0.2 0.4 0.4 0.4 ... Castor beans 0.3 0.2 0.2 0.2 0.2 0.2 0.3 0.1 0.1 Production of major farm products (1 000 tons) Soybean 32 821 52 465 57 857 59 833 57 345 68 756 74 815 65 849 81 700 Corn 32 321 42 662 52 112 58 933 50 746 55 395 55 660 71 073 80 736 Sugarcane 326 121 477 411 549 707 645 300 672 157 717 462 734 006 721 077 738 195 Beans 3 056 3 458 3 169 3 461 3 487 3 159 3 435 2 795 2 944 Rice 11 135 11 527 11 061 12 061 12 651 11 236 13 477 11 550 11 759 Coffee 3 807 2 573 2 249 2 797 2 440 2 906 2 700 3 038 2 919 Wheat 1 726 2 485 4 114 6 027 5 056 6 171 5 690 4 418 5 712 Cassava 23 044 26 639 26 541 26 703 24 404 24 524 25 349 23 045 21 199 Cotton 2 007 2 899 4 111 3 983 2 898 2 950 5 071 4 969 3 404 Orange 17 064 18 032 18 685 18 538 17 618 18 102 19 811 18 013 16 311 Yield of major farm crops (kg/hectare) Soybean 2 403 2 380 2 813 2 816 2 637 2 947 3 121 2 637 2 932 Corn 2 718 3 382 3 785 4 080 3 715 4 367 4 210 5 006 5 257 Sugarcane 67 878 75 118 77 632 79 274 78 860 79 044 76 448 74 297 75 102 Beans 705 857 837 915 850 923 935 1 032 1 037 Rice 3 038 3 880 3 826 4 231 4 405 4 127 4 895 4 786 5 006 Coffee 1 679 1 113 993 1 259 1 143 1 346 1 256 1 433 1 432 Wheat 1 516 1 593 2 220 2 550 2 080 2 829 2 660 2 310 2 585 Cassava 13 482 14 046 14 010 14 137 13 861 13 720 14 622 13 612 13 909 Cotton 2 504 3 228 3 653 3 744 3 570 3 555 3 608 3 596 3 625 Orange 19 925 22 375 22 752 22 159 22 380 23 331 24 239 24 689 22 996 Fruits production (1 000 tons) (2) 35 098 41 698 42 795 42 540 41 412 42 399 45 369 42 573 ... Number of livestock (1 000 heads) Bovines 169 876 205 886 199 752 202 307 205 308 209 541 212 815 211 279 ... Chickens 659 246 819 894 930 041 990 993 1 021 215 1 028 151 1 051 990 1 032 039 ... Laying hens 183 495 191 622 197 618 207 712 208 871 210 761 216 220 213 230 ... Ovines 14 785 16 019 16 239 16 630 16 812 17 381 17 668 16 789 ... Swines 31 562 35 174 35 945 36 819 38 045 39 957 39 307 38 796 ... Production of meat (1 000 tons) Beef 3 900 6 887 7 049 6 621 6 662 6 977 6 784 7 351 8 167 Chicken 5 082 8 164 9 899 10 216 9 940 10 693 11 422 11 533 12 346 Pork 1 344 2 298 2 480 2 636 2 930 3 079 3 370 3 150 3 120 Milk (1 000 tons) (3) Cow milk 19 191 24 658 25 376 26 782 28 238 29 820 31 161 31 364 ... Source
Brazilian Institute of Geography and Statistics - IBGE, Agricultural Municipal Production Survey; Municipal Cattle Breeding Survey; Quarterly Animal Slaughter Survey and Vegetal Extractive and Forestry Survey, 2000-2013.Footnotes
(1) Provisional data.
(2) Fruits Production consideres the folllowing fruits: orange, banana, grape, pineapple, papaya, watermelon, apple, coconuts, passion fruit, mango, tangerine, lemon, melon, guava, peach, persimmon, avocado, cashew nuts, fig, pear, nut, quince.
(3) 1 kg corresponds to 1,03 litre.
Table 10.2.2 - Selected Data on Agriculture, Forestry, Animal Husbandry and Fishery - Russia - 2000/2013
2000 2006 2007 2008 2009 2010 2011 2012 2013 Indices of agricultural production and its components (%) (1) 106.2 103.0 103.3 110.8 101.4 88.7 123.0 95.2 (2) 106.2 Volume indices of crops production at farms of all types (%) 110.9 100.3 102.3 118.0 98.6 76.2 146.9 88.3 112.3 Volume indices of animal husbandry at farms of all types (%) 101.1 105.6 104.3 103.0 104.6 100.9 102.3 102.8 (2)100.5 Total sown or harvested areas of farm crops (million hectares) (3) 84.7 75.3 74.8 76.9 77.8 75.2 76.7 76.3 78.1 Structure of crops area by main species (%) Cereals and pulses 53.9 57.4 59.2 60.8 61.1 57.5 56.8 58.2 58.7 Including wheat 27.4 31.3 32.6 34.6 36.9 35.4 33.3 32.3 32.1 Tubers 0.2 0.1 0.1 0.1 0.1 0.1 0.1 0.1 0.1 Oil-bearing crops 6.5 10.2 9.3 10.1 10.3 12.8 13.6 13.2 14.2 Including Rapeseeds 0.3 0.7 0.9 0.9 0.9 1.1 1.2 1.6 1.7 Sunflower seeds 5.5 8.2 7.1 8.0 8.0 9.5 9.9 8.6 9.3 Soybeans 0.5 1.1 1.0 1.0 1.1 1.6 1.6 1.9 2.0 Fiber crops 0.1 0.1 0.1 0.1 0.1 0.1 0.1 0.1 0.1 Beetroots 1.0 1.3 1.4 1.1 1.1 1.5 1.7 1.5 1.2 Tobacco 0.0 0.0 0.0 0.0 0.0 0.0 0.0 0.0 0.0 Potatoes 3.3 2.8 2.8 2.8 2.8 2.9 2.9 2.9 2.7 Vegetable other 0.9 0.8 0.8 0.8 0.8 0.9 0.9 0.9 0.9 Fodder crops 34.1 27.1 26.1 24.1 23.5 24.0 23.7 23.0 22.1 Production of major farm products (1 000 tons) Cereal and pulses Total 65 420 78 227 81 472 108 179 97 111 60 960 94 213 70 908 92 385 Wheat 34 460 44 927 49 368 63 765 61 740 41 508 56 240 37 720 52 091 Nuts 7.9 5.0 7.3 7.9 9.5 9.4 10.1 10.8 12.8 Oil-bearing crops 4 473 8 218 7 037 8 972 8 186 7 457 13 115 11 313 14 151 Rapeseeds 149 522 630 752 667 670 1 056 1 035 1 393 Sunflower seeds 3 919 6 743 5 671 7 350 6 454 5 345 9 697 7 993 10 554 Soybeans 342 805 650 746 944 1 222 1 756 1 806 1 636 Potatoes 29 465 28 260 27 195 28 846 31 134 21 141 32 681 29 533 30 199 Beetroots 14 051 30 673 28 836 28 995 24 892 22 256 47 643 45 057 39 321 Vegetable other 10 822 11 370 11 509 12 960 13 402 12 125 14 696 14 626 14 689 Tobacco 1.4 0.0 0.0 0.0 0.0 0.0 0.0 0.0 0.0 Fruits (4) 2 961 2 169 2 811 2 661 3 057 2 464 2 917 2 920 3 368 Yield of major farm crops (kg/hectare) Cereal and pulses Total 1 560 1 890 1 980 2 380 2 270 1 830 2 240 1 830 2 200 Wheat 1 610 1 950 2 100 2 450 2 320 1 910 2 260 1 770 2 230 Nuts (5) 800 660 910 1 220 1 490 1 470 1 550 2 030 2 340 Oil-bearing crops 890 1 120 1 100 1 200 1 150 990 1 330 1 220 1 430 Rapeseeds 860 1 160 1 180 1 200 1 200 1 100 1 260 1 060 1 250 Sunflower seeds 900 1 140 1 130 1 230 1 150 960 1 340 1 300 1 550 Soybeans 1 010 990 920 1 050 1 190 1 180 1 480 1 310 1 360 Potatoes 10 470 13 330 13 200 13 750 14 270 10 020 14 840 13 440 14 460 Beetroots 18 830 32 540 29 200 36 240 32 320 24 070 39 170 40 890 44 210 Vegetables other 14 330 17 260 17 880 19 620 19 920 18 030 20 810 21 090 21 390 Tobacco 750 660 3 020 2 450 2 800 1 070 1 290 3 000 ... Fruits (4) (5) 4 280 4 395 5 840 5 510 6 380 5 195 6 200 6 840 7 970 Fruits production, by species (1 000 tons) Seedlings 1 519 987 1 341 1 178 1 509 1 036 1 258 1 470 1 647 Stone fruits 466 223 415 480 496 461 496 472 515 Subtropical cultures 0.7 2.2 1.6 1.8 1.9 2.3 2.1 0.9 1.2 Citrus cultures 0.2 0.1 0.1 0.1 0.1 0.1 0.1 0.1 0.1 Berrying grounds 696 723 739 733 752 670 749 710 765 Vineyards 279 234 315 268 299 324 412 267 439 Number of livestock by species (year-end) Cattle (1 000 heads) 27 520 21 562 21 546 21 038 20 671 19 968 20 134 19 981 514 Pigs (1 000 heads) 15 824 16 185 16 340 16 162 17 231 17 218 17 258 18 816 186 Muttons and goats (1 000 heads) 14 962 20 194 21 503 21 770 21 986 21 820 22 858 24 180 (2) 23 849 Production of meat (1 000 tons) (6) 4 446 5 278 5 790 6 268 6 719 7 167 7 519 8 090 (2) 8 542 Production of milk (1 000 tons) 32 259 31 339 31 988 32 363 32 570 31 847 31 646 31 831 (2) 30 661 Cow milk 32 000 31 186 31 915 32 117 32 326 31 585 31 386 31 576 ... Poultry eggs (mln. pieces) 34 085 38 216 38 208 38 058 39 429 40 599 41 113 42 033 278 Catch of fish (1 000 tons) 3 776 3 264 3 417 3 333 3 728 ... ... ... ... Ownership of tractors in agriculture at year-end (1000 unit) (7) 747 440 406 364 330 310 293 276 ... Ownership of harvester in agriculture at year-end (1000 unit) (8) 288 161 146 130 116 109 103 97 ... Consumption of chemical fertilizers (kg/hectare) (9) 19 27 32 36 36 38 39 38 38 Removals of round wood (mln. dense cu.m) 94.8 118 134 108 97.1 118 123 120 114 Total production of fruits and vegetables (mln. tons) 14 14 14 16 17 15 18 18 18 Source
Federal State Statistics Service of the Russian Federation.Footnotes
(1) Preceding year = 100
(2) Provisional data.
(3) Total Sown Area.
(4) Fruits (excluding nuts), berries and grapes.
(5) Before 2012 yield is given per 1 hectare of plants in fruit-bearing age; for 2012 - 2013 - per 1 ha harvested area.
(6) Livestock and poultry for slaughter.
(7) Availability of tractors in agricultural organizations(excluding tractors with mounted digging, ameliorative and other machines), since 2008 excluding micro enterprises.
(8) Availability of harvesters and beet harvesting machines (excluding plant top gathering machines), since 2008 excluding micro enterprises.
(9) Mineral fertilizers used per 1 ha of crops in agricultural organisations, since 2008-excluding data on micro enterprises.
Table 10.2.3 - Selected Data on Agriculture, Forestry, Animal Husbandry and Fishery - India - 2000/2013
2000 2003 2006 2007 2008 2009 2010 2011 2012 2013(1) All index numbers of production of principal crops (%) (2) (3) 97.6 ... 101.7 102.5 93.6 98.7 116.1 105.1 96.3 ... Cereals 97.9 ... 113.6 106.4 101.8 92.5 111.2 107.1 97.8 ... Total food grains 97.3 ... 60.8 106.2 101.6 93.0 112.1 106.1 98.5 ... Non-food grains 98.4 ... 114.3 100.9 90.0 101.5 117.9 104.7 95.3 ... Fruits and vegetables 100.5 ... 126.4 113.8 101.8 103.9 107.9 105.1 104.6 ... Planting structure of farm crops by main species (3) Total cropped area (million hectares) 185 ... 192 195 195 189 199 ... ... ... Total cereals (%) 54.3 ... 52.2 51.5 51.6 51.9 50.4 ... ... ... Rice 24.1 ... 22.8 22.5 23.3 22.2 21.5 ... ... ... Wheat 13.9 ... 14.5 14.4 14.2 15.1 14.6 ... ... ... Corn (maize) 3.6 ... 4.1 4.2 4.2 4.4 4.3 ... ... ... Soybeans 3.5 ... 4.3 4.6 4.9 5.2 4.8 ... ... .. Oil-bearing crops 12.6 ... 13.8 13.7 14.1 13.7 13.7 ... ... ... Peanuts (groundnut) 3.6 ... 2.9 3.2 3.2 2.9 2.9 ... ... ... Rapeseeds and mustard 2.4 ... 3.5 3 3.2 3.0 3.5 ... ... ... Sesame 0.9 ... 0.9 0.9 0.9 1.0 1.0 ... ... ... Cotton 4.6 ... 4.7 4.8 4.8 5.4 5.6 ... ... ... Other fiber crops 0.5 ... 0.5 0.5 0.5 0.5 0.4 ... ... ... Sugarcane 2.3 ... 2.7 2.6 2.3 2.2 2.5 ... ... ... Sweet potato 0.1 ... 0.1 0.1 0.1 0.1 0.1 ... ... ... Tobacco 0.2 ... 0.2 0.2 0.2 0.2 0.2 ... ... ... Tea 0.3 ... 0.3 0.3 0.3 0.3 0.3 ... ... ... Vegetables 3.4 ... 3.9 4 4.1 4.2 4.5 ... ... ... Fruits 2.1 ... 2.9 3 3.1 3.3 3.4 ... ... ... Production of major farm products (3) Cereal (1 000 tons) 185 738 ... 203 085 216 014 219 900 203 446 226 251 242 234 238 790 243 430 Cotton (1000 bales) 9 520 ... 22 632 25 884 22 276 24 022 33 000 35 200 34 220 35 602 Peanuts (groundnut) (1 000 tons) 6 410 ... 4 864 9 183 7 168 5 429 8 265 6 964 4 695 9 140 Rapeseeds and mustard (1 000 tons) 4 190 ... 7 438 5 834 7 201 6 608 8 179 6 604 8 029 8 251 Sesame (1 000 tons) 520 ... 618 757 640 588 893 810 658 672 Potatoes (1 000 tons) 22 143 ... 22 181 34 658 34 391 36 577 42 339 41 483 45 344 Sugarcane (1 000 tons) 295 960 ... 355 520 348 188 285 029 292 302 342 382 361 037 341 200 345 923 Tobacco (1 000 tons) 488 ... 469 437 569 688 884 823 ... ... Fruits (1 000 tons) 43 138 ... 59 563 65 587 68 466 71 516 74 878 76 424 81 285 ... Yield of major farm crops (100 kg/hectare)(3) Cereal 18.4 ... 20.2 21.5 21.8 20.8 22.6 24.2 24.5 ... Cotton 1.9 ... 4.2 4.7 4.0 4.0 5.0 4.9 4.9 ... Peanuts (groundnut) 9.8 ... 8.7 14.6 11.6 9.9 14.1 13.2 10.0 ... Rapeseeds and mustard 9.4 ... 11.0 10.0 11.4 11.8 11.9 11.2 12.6 ... Sesame 3 ... 3.6 4.2 3.5 3.0 4.3 4.3 4.0 ... Potatoes 182.8 ... 149 193 188 199 227 218 228 ... Sugarcane 685.8 ... 690.2 688.8 645.5 700.2 700.9 716.7 682.5 ... Tobacco 17 ... 14.1 14.2 14.6 15.6 17.9 17.7 ... ... Livestock products (4) Production of meat (1 000 tons) (5) 1 900 ... 2 302 4 009 4 280 4 566 4 869 5 514 ... ... Milk (1 000 tons) (6) 79 651 ... 99 348 107 933 112 183 116 425 121 847 127 904 ... ... Cow milk (1 000 tons) 32 957 ... 41 148 46 822 49 810 52 200 54 903 57 770 ... ... Poultry eggs (million) (7) 36 632 ... 50 663 53 565 55 562 60 244 63 024 66 450 ... ... Fish production (1 000 tons) 5 655 ... 6 869 7 127 7 616 7 998 8 231 8 666 ... ... Consumption of chemical fertilizers (3) Total (N+P+K) (1 000 tons) 16 702 ... 21 651 22 570 24 909 26 486 28 122 27 740 25 536 ... Nitrogenous (N) (1 000 tons) 10 920 ... 13 773 14 419 15 090 15 580 16 558 17 300 16 821 ... Phosphatic (P) (1 000 tons) 4 215 ... 5 543 5 515 6 506 7 274 8 050 7 914 6 653 ... Potassic (K) (1 000 tons) 1 567 ... 2 335 2 636 3 313 3 632 3 514 2 526 2 062 ... Per hectare (kg) 90 ... 112 117 129 140 146 144 128 ... Number of livestock (8) Cattle (1 000 heads) ... 185 181 ... 199 075 ... ... ... ... ... ... Buffaloes (1 000 heads) ... 97 922 ... 105 343 ... ... ... ... ... ... Sheep and goats (1 000 heads) ... 185 827 ... 212 095 ... ... ... ... ... ... Total livestock (1 000 heads) ... 485 002 ... 529 698 ... ... ... ... ... ... Total poultry (1 000 heads) ... 489 012 ... 648 830 ... ... ... ... ... ... Sources
a) Ministry of Agriculture, Directorate of Economics & Statistics Publications - (Agricultural Statistics at a Glance 2013, Pocket Book of Agricultural Statistics; Land Use Statistics at a Glance; Area Production Yield Statistics Database; and Advance Estimates).
b) Ministry of Agriculture, Annual Reports of Department of Animal Husbandary, Dairying & Fisheries (2004-2005,2009-2010 & 2012-2013).
c) Ministry of Agriculture, Indian Horticulture Database.Footnotes
(1) Information for 2013 is as per second advance estimate.
(2) Precending year = 100.
(3) The period of agricultural year is from July (of the year indicated in the table) to June (next year).
(4) Data in livestock products pertains to Financial Year i.e. April (of the year indicated in the table) to March (next year).
(5) Meat production from commercial poultry farm is included from 2007-08 onwards.
(6) Milk Includes cow, buffalo and goat milk.
(7) Poultry eggs include eggs from fowls & ducks.
(8) Number of livestock is produced from Livestock Census which is conducted at a gap of five years. Information from Last two census (2003 & 2007, Reference Date 15th October) has been included.
Table 10.2.4 - Selected Data on Agriculture, Forestry, Animal Husbandry and Fishery - China - 2000/2013
2000 2006 2007 2008 2009 2010 2011 2012 2013 Indices of agricultural gross output and its components (1) (2) All (%) 103.6 105.4 103.9 105.7 104.6 104.4 104.5 104.9 104.0 Crop Products (%) 101.4 105.4 104.0 104.8 103.8 104.1 105.6 104.4 104.4 Forestry Products (%) 105.4 105.6 106.9 108.1 107.1 106.5 107.6 106.7 107.3 Livestock Products (%) 106.3 105.0 102.3 106.8 105.8 104.1 101.7 105.2 102.0 Fishery Products (%) 106.5 106.0 104.8 106.0 105.8 105.5 104.5 105.1 105.2 Sown or harvested areas of farm crops (million hectares) Total 156.3 152.1 153.5 156.3 158.6 160.7 162.3 163.7 164.6 Planting structure of farm crops by main species (%) Rice 19.2 19.0 18.8 18.7 18.7 18.6 18.5 18.4 18.4 Wheat 17.1 15.5 15.5 15.1 15.3 15.1 15.0 14.9 14.6 Corn 6.0 6.1 5.7 5.8 5.8 5.3 4.9 4.4 4.1 Soybeans 6.0 6.1 5.7 5.8 5.8 5.3 4.9 4.4 4.1 Tubers 6.7 5.2 5.3 5.4 5.4 5.4 5.5 5.4 5.4 Oil-bearing crops 9.9 7.7 7.4 8.2 8.6 8.6 8.5 8.5 8.5 Peanuts 3.1 2.6 2.6 2.7 2.8 2.8 2.8 2.9 2.8 Rapeseeds 4.8 3.9 3.7 4.2 4.6 4.6 4.5 8.5 8.5 Sesame 0.5 0.4 0.3 0.3 0.3 0.3 0.3 0.3 0.3 Cotton 2.6 3.8 3.9 3.7 3.1 3.0 3.1 2.9 2.6 Jute and jute-like fibers 0.2 0.2 0.2 0.1 0.1 0.1 0.1 0.1 0.1 Sugar crops 1.0 1.0 1.2 1.3 1.2 1.2 1.2 1.2 1.2 Sugarcane 0.8 0.9 1.0 1.1 1.1 1.0 1.1 1.1 1.1 Beetroots 0.2 0.1 0.1 0.2 0.1 0.1 0.1 0.1 0.1 Tobacco 0.9 0.8 0.8 0.8 0.9 0.8 0.9 1.0 1.0 Vegetables 9.7 10.9 11.3 11.4 11.6 11.8 12.1 12.5 12.7 Other 12.1 11.0 10.9 10.2 9.6 9.7 9.6 9.3 9.2 Production of major farm products (1 000 tons) Cereal 405 224 450 992 456 324 478 474 481 563 496 371 519 394 539 347 552 692 Cotton 4 417 7 533 7 624 7 492 6 377 5 961 6 589 6 836 6 299 Peanuts 14 437 12 887 13 027 14 286 14 708 15 644 16 046 16 692 16 972 Rapeseeds 11 381 10 966 10 573 12 102 13 657 13 082 13 426 14 007 14 458 Sesame 811 662 557 586 622 587 605 639 623 Potatoes 13 255 12 897 12 958 14 156 14 646 16 307 17 658 18 552 19 188 Sugarcane 68 280 97 092 112 951 124 152 115 587 110 789 114 434 123 114 128 201 Beetroots 8 073 7 508 8 931 10 044 7 179 9 296 10 731 11 740 9 260 Tobacco 2 552 2 456 2 395 2 838 3 066 3 004 3 132 3 407 3 374 Tea 683 1 028 1 165 1 258 1 359 1 475 1 623 1 790 1 924 Fruits 124 357 171 020 181 363 192 202 203 955 214 014 227 682 240 568 250 930 Top five area of fruits (1 000 hectares) Citrus 1 272 1 815 1 941 2 031 2 160 2 211 2 288 2 306 2 422 Apples 2 254 1 899 1 962 1 992 2 049 2 140 2 177 2 231 2 272 Pears 1 015 1 087 1 071 1 074 1 074 1 063 1 086 1 089 1 112 Grapes 283 419 438 451 493 552 597 666 715 Bananas 249 286 307 318 339 357 386 395 392 Top five production of fruits (1 000 tons) Apples 20 431 26 059 27 860 29 847 31 681 33 263 35 985 38 491 39 683 Citrus 8 783 17 898 20 583 23 313 25 211 26 452 29 440 31 678 33 209 Pears 8 412 11 986 12 895 13 538 14 263 15 057 15 795 17 073 17 301 Bananas 4 941 6 901 7 797 7 835 8 834 9 561 10 400 11 558 12 075 Grapes 3 282 6 271 6 697 7 151 7 941 8 549 9 067 10 543 11 550 Top three production of spices (1 000 tons) Prickly ash seeds ... 161 194 245 264 251 242 185 259 Aniseed ... 88 96 101 107 117 122 136 143 Cinnamon ... 88 88 68 64 76 ... ... ... Yield of major farm crops (kg/hectare) Cereal 4 752.6 5 310.1 5 319.9 5 547.7 5 447.5 5 524.4 5 706.6 5 823.7 5 894.2 Cotton 1 093.1 1 295.3 1 286.4 1 302.0 1 288.6 1 229.4 1 307.9 1 458.1 1 449.5 Peanuts 2 973.3 3 257.7 3 302.4 3 364.8 3 360.6 3 455.5 3 502.5 3 598.5 3 663.3 Rapeseeds 1 518.6 1 832.6 1 873.8 1 835.3 1 876.5 1 775.1 1 827.3 1 884.8 1 922.8 Sesame 1 034.2 1 173.0 1 147.0 1 243.2 1 306.8 1 312.1 1 385.3 1 463.2 1 490.0 Potatoes 2 806.4 3 062.5 2 924.9 3 035.5 2 882.6 3 132.8 3 255.6 3 353.7 3 553.9 Sugarcane 57 626.1 70 450.2 71 228.2 71 209.7 68 093.4 65 700.0 66 485.1 68 600.3 70 576.2 Beetroots 24 518.0 39 766.9 41 359.8 40 754.4 38 536.2 42 498.1 47 361.1 49 792.8 50 922.4 Tobacco 1 775.9 2 065.7 2 058.3 2 140.4 2 203.2 2 233.9 2 143.4 2 133.7 2 078.8 Number of livestock at year-end (1 000 heads) Hogs 416 336 418 504 439 895 462 913 469 960 464 600 468 627 475 922 474 113 Cattle 123 532 104 651 105 948 105 760 107 265 106 264 103 605 103 434 103 851 Sheep and goats 279 482 283 698 285 647 280 849 284 522 280 879 282 358 285 041 290 363 Production of meat (1000 tons) 60 139 70 890 68 657 72 787 76 497 79 258 79 651 83 872 85 350 Milk (1000 tons) 9 191 33 025 36 334 37 315 36 777 37 480 38 107 38 754 36 495 Cow Milk 8 274 31 934 35 252 35 558 35 188 35 756 36 578 37 436 35 314 Poultry eggs (1000 tons) 21 820 24 240 25 290 27 022 27 425 27 627 28 114 28 612 28 761 Catch of fish (1000 tons) 9 240 9 200 9 511 9 567 9 870 10 222 11 618 11 730 Ownership of tractors and harvester-threshers in agriculture at year-end (1 000 units) (3) 13 881 17 963 18 888 20 963 21 883 22 772 23 633 24 500 ... Consumption of chemical fertilizers (kg/hectare) 265.3 323.9 332.8 335.3 340.7 346.1 351.5 357.4 357.3 Sources
National Bureau of Statistics of the People's Republic of China, China Rural Statistical Yearbook 2000-2013; China Statistical Yearbook 2000-2013; and Statistical Communique of the People's Republic of China on the 2013 National Economic and Social Development.Footnotes
(1) Data of indices of agricultural gross output prior to 2003 are calculated at 1990 prices. The new classification for national standard of industry classification has been implemented since 2003 and the gross output value includes the services in support of agriculture, forestry, animal husbandry and fishery.
(2) Preceding year = 100.
(3) Ownership of Tractors and Harvester-Threshers in Agriculture at Year-End includes large, medium and small-sized tractors, harvesters and threshers are not included.
Table 10.2.5 - Selected Data on Agriculture, Forestry, Animal Husbandry and Fishery - South Africa - 2000/2013
2000 2006 2007 2008 2009 2010 2011 2012 2013 Crop products (%) Grain ... 100.1 99.8 ... 100.2 100.0 ... ... ... Forestry products ... 99.7 100.3 ... 99.8 100.0 ... ... ... Livestock products ... 100.2 99.9 ... 100.1 100.0 ... ... ... Production of major farm products (1 000 tons) Cereal Maize/corn 11 001 6 618 7 125 12 700 12 050 12 815 10 360 12 121 11 691 Wheat 2 349 2 105 1 905 2 130 1 958 1 430 2 005 1 870 1 795 Malting barley 142 236 222 192 216 194 312 298 264 Sorghum 352 96 176 255 277 197 155 136 151 Sunflower seed 531 520 300 872 801 490 860 522 557 Soybeans 154 424 205 282 516 566 710 650 784 Cotton 70 39 29 26 23 21 46 32 14 Peanuts 114 74 58 89 100 88 64 59 42 Dry beans 72 67 40 59 67 52 42 48 60 Sugarcane 21 223 21 052 20 278 19 724 19 255 18 655 16 016 16 800 17 278 Tobacco 30 15 13 9 10 12 15 17 16 Garden fruits Bananas 378 343 346 393 371 400 385 387 419 Apples 602 633 708 778 818 724 781 796 924 Citrus 1 712 2 087 2 170 2 282 2 154 2 150 2 339 2 341 2 427 Pears 304 315 336 337 340 368 351 339 365 Grapes 210 295 262 272 296 270 348 272 254 Pineapples 168 164 146 125 123 94 109 99 97 Yield of major farm crops (kg/hectare) Cereal Maize/corn 3 210 4 140 2 790 4 540 4 960 4 670 4 370 4 490 4 200 Wheat 2 510 2 750 3 010 2 850 3 050 2 560 3 320 3 660 3 550 Malting barley 1 830 2 630 3 030 2 810 2 890 2 350 3 890 3 510 3 240 Sorghum 2 480 2 580 2 550 2 940 3 230 2 270 2 240 2 790 2 410 Sunflower seed 1 340 1 100 950 1 550 1 550 1 260 1 230 1 340 1 150 Soybeans 1 640 1 760 1 120 1 700 2 170 1 820 1 700 1 380 1 520 Cotton 1 368 2 180 2 825 2 927 3 245 4 085 3 563 3 514 2 112 Peanuts 1 370 1 520 1 420 1 640 1 820 1 530 1 170 1 300 900 Dry beans 1 000 1 230 780 1 350 1 530 1 180 1 000 1 200 1 380 Potatoes 1 967 1 857 1 917 ... 1 867 2 090 ... ... ... Sugarcane 50 291 49 187 48 281 46 629 49 499 48 835 42 598 45 776 46 446 Tobacco 1 904 2 483 2 133 2 676 2 639 3 075 2 777 3 207 Production of meat (1 000 tons) Beef and veal 581 804 794 765 771 848 834 845 839 Mutton 95 108 141 134 137 132 122 134 134 Goats 7 9 9 9 9 9 9 9 9 Poultry 870 1 176 1 223 1 328 1 388 1 472 1 477 1 489 1 573 Milk (1 000 tons) Cow milk 2 689 3 044 3 066 3 137 3 104 3 233 3 126 3 368 3 250 Poultry eggs (1 000 tons) 329 412 438 473 450 472 511 535 528 Sources
a) Statistics South Africa.
b) Department of Agriculture, Forestry and Fisheries.Footnotes
Data on commercial agriculture.
Graph 10.1 - Production of Cereals - 2000/2013
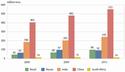
Click to enlargeSource: Summary Table of Chapter 10, BRICS Joint Statistical Publication 2014.
General
Cultivated Area: This Consists of net area sown and current fallows. Average Yield of Crops: Average yields per hectare of principal crops have been obtained by dividing the total production by the corresponding total area under each crop. Brasil
Fruits Production consideres the folllowing fruits: orange, banana, grape, pineapple, papaya, watermelon, apple, coconuts, passion fruit, mango, tangerine, lemon, melon, guava, peach, persimmon, avocado, cashew nuts, fig, pear, nut, quince."Cultivated area includes only harvested area. Russia
Agricultural production is the sum of crop-growing and animal husbandry outputs of all agricultural producers including enterprises of private sector (household enterprises, peasant (farm) enterprises and individual employers) in value terms at actual current prices. To calculate agricultural production index the indicator of production volume at comparable prices of previous year is used. India
Ministry of Agriculture is the nodal agency for collection, compilation & dissemination of agriculture statistics in India.
Directorate of Economics & Statistics in Department of Agriculture & Cooperation , Ministry of Agriculture is the agency primarily involved with Crop statistics and the reporting period for the same is agricultural year i.e. July to June next year whereas Department of Animal Husbandry , Dairying & Fisheries, Ministry of Agriculture produces & disseminates information on livestock with Financial Year as the reporting period(i.e. April- March next year)
Cultivated Area consists of Net Area sown and current fallows.China
Indices of agricultural gross output: The development rates of agricultural gross output value deflated by using producers prices indices.
Table 11.1 - Summary of Transport on BRICS Countries - 2000/2013
2000 2005 2006 2007 2008 2009 2010 2011 2012 2013 Length of railways in operation (1 000 km) Brazil 29 29 29 29 31 30 28 29 29 30 Russia 86 85 85 85 86 86 86 86 86 86 India(1) 63 64 63 63 63 64 64 65 65 ... China 69 75 77 78 80 86 91 93 98 ... South Africa 21 21 21 21 21 21 21 ... ... ... Length of highways (1 000 km) Brazil 1 579.0 1 610.0 1 603.0 1 765.0 1 736.0 1 712.0 1 712.0 1 712.0 1 713.0 1 691.0 Russia 532.0 531.0 597.0 624.0 629.0 647.0 665.0 728.0 925.0 987.0 India (1) 190.0 210.0 215.0 219.0 221.0 229.0 231.0 235.0 241.0 ... China 1 679.8 3 345.2 3 457.0 3 583.7 3 730.2 3 860.8 4 008.2 4 106.4 4 237.5 ... South Africa Length of petroleum pipelines (1 000 km) Brazil ... 7 7 7 7 7 8 8 8 9 Russia 48 50 50 50 49 49 49 51 55 55 India (1) 16 20 22 25 26 30 32 33 36 38 China 25 44 48 54 58 69 78 83 90 ... South Africa 3 3 3 3 3 3 3 ... ... ... Passenger traffic (all means) (billion passengers-km) Brazil ... ... ... ... ... ... ... ... ... ... Russia 496 473 477 497 512 464 484 503 533 ... India ... ... ... ... ... ... ... ... ... ... China 1 226 1 747 1 920 2 159 2 320 2 483 2 789 3 098 3 338 (3) 3 604 South Africa ... ... ... ... ... ... ... ... ... ... Freight traffic (all means) (billion tons-km) Brazil ... ... ... ... ... ... ... ... ... ... Russia 3 638 4 676 4 801 4 915 4 948 4 446 4 752 4 915 5 056 5 083 India ... ... ... ... ... ... ... ... ... ... China 4 432 8 026 8 884 10 142 11 030 12 213 14 184 15 932 17 377 (3) 18 648 South Africa ... ... ... ... ... ... ... ... ... Passenger traffic by air (million persons-km) Brazil 48 000 59 000 57 000 61 000 69 000 76 000 94 000 108 000 113 000 116 000 Russia 53 410 85 774 93 932 111 002 122 601 112 469 147 119 166 760 195 775 ... India (5) 26 212 51 567 63 880 77 850 78 440 89 442 103 171 112 794 99 971 ... China 97 054 204 493 237 066 279 173 288 280 337 524 403 900 453 696 502 574 (3) 565 849 South Africa ... ... ... ... ... ... ... ... ... Sources
Brazil
a) National Terrestrial Transport Agency - ANTT.
b) National Civil Aviation Agency - ANAC.
c) National Department of Transport Infrastructure, National Transportation System 2013.
d) National Petroleum, Natural Gas and Biofuels National Agency - ANP.Russia
a) Federal State Statistics Service of the Russian Federation.
b) Federal Road Agency.India
a) Ministry of Railways, Indian Railways Annual Statistical Statements 2011-2012.
b) Ministry of Road Transport & Highways, Basic Road Statistics of India (various issues).
c) Ministry of Petroleum & Natural Gas, Indian Petroleum & Natural Gas Statistics 2012-2013.
d) Ministry of Civil Aviation, Directorate General of Civil Aviation, Air Transport Statistics (various issues).China
a) Ministry of Transport of the People's Republic of China, Annual Statistical Reports 2000-2013.
b) Civil Aviation Administration of China, Annual Statistical Reports 2000-2013.
c) China Railway Corporation, Annual Statistical Reports 2012-2013.
d) China National Petroleum Corporation, Annual Statistical Reports 2000-2013.
e) China National Offshore Oil Corporation, Annual Statistical Reports 2013.
f) National Bureau of Statistics of the People's Republic of China, China Statistical Yearbooks 2000-2013 and Statistical Communique of the People's Republic of China on the 2013 National Economic and Social Development.
g) China Petroleum and Chemical Corporation, Annual Statistical Reports 2000-2013.South Africa
Transnet.Footnotes
Russia
(2) Length of public paved roads in operation (including highways). At the end of the year.India
(1) Highways includes both National and State Highways only (Excluding Rural Roads, Project Roads, Urban Roads etc) & the information is as on 31st March of the Year indicated in the table except for 2000 where it is as on 31st March 2001. (5) Reference Period is Financial Year i.e. (April of the Year indicated in the Table to March next year).China
(4) Since 2013, the statistical coverage of pipeline transport has included China National Offshore Oil Corporation on the basis of China National Petroleum Corporation and China Petroleum & Chemical Corporation.
(3) Preliminary data.
Table 11.2.1 - Selected Data on Transport - Brazil - 2000/2013
2000 2003 2004 2005 2006 2007 2008 2009 2010 2011 2012 2013 Traffic Passenger traffic by road (million persons-km) ... ... 30 30 28 28 27 ... ... ... ... ... Passenger traffic by railway (million persons-km) 416 469 475 452 464 444 458 421 438 422 421 392 Transport of goods by railway (million tons-km) 155 690 182 644 205 711 221 633 238 054 257 118 266 967 245 316 277 922 293 184 301 653 298 615 Passenger traffic by air (million persons-km)(1) 48 000 46 000 51 000 59 000 57 000 61 000 69 000 76 000 94 000 108 000 113 000 116 000 Transport of goods by air (million tons-km) (1) 6 774 6 677 7 343 8 185 7 725 7 604 8 535 8 017 9 710 11 697 12 084 12 517 Freight traffic of petroleum pipelines (million tons) ... ... 254 240 251 ... ... ... ... ... ... ... Ownership of automobiles Registered automobiles (1 000 units) 19 973 23 669 24 936 26 309 27 869 29 852 32 055 ... ... ... ... ... Passenger cars and buses (1 000 units) 20 234 23 973 25 257 26 644 28 222 30 227 ... ... ... ... ... ... Road traffic accident involving personal injury or death Accidents (2) 378 811 461 125 499 770 539 919 424 137 508 186 ... ... ... ... ... ... Number of injured (2) 358 762 439 065 474 244 513 510 404 385 484 900 ... ... ... ... ... ... Number of death (2) 20 049 22 060 25 526 26 409 19 752 23 286 ... ... ... ... ... ... Sources
a) National Terrestrial Transport Agency - ANTT.
b) National Civil Aviation Agency - ANAC.
c) National Department of Transport Infrastructure, National Transportation System 2013. Footnotes
(1) It refers to paid traffic domestic and international.
(2) It refers to the interstate and international collective passenger transport.
Table 11.2.2 - Selected Data on Transport - Russia - 2000/2013
2000 2005 2006 2007 2008 2009 2010 2011 2012 2013 Traffic Passenger traffic by road (million passengers-km) (1) 173 660 142 276 135 986 149 929 152 145 141 477 140 611 138 588 133 275 ... Transport of goods by road (million tons-km) (2) 152 735 193 597 198 766 205 849 216 276 180 136 199 341 222 823 248 862 (4)250 054 Passenger traffic by railway (million passengers-km) 167 054 172 217 177 838 174 085 175 872 151 467 138 885 139 842 144 612 138 517 Transport of goods by railway (million tons-km) 1 373 178 1 858 093 1 950 830 2 090 337 2 116 240 1 865 305 2 011 308 2 127 835 2 222 389 2 196 217 Passenger traffic by air (million passengers-km) 53 410 85 774 93 932 111 002 122 601 112 469 147 119 166 760 195 775 225 157 Transport of goods by air (million tons-km) 2 515 2 830 2 927 3 424 3 692 3 558 4 715 4 950 5 079 5 012 Freight traffic of petroleum Pipelines (million tons) 295 454 461 462 456 474 492 544 523 525 Length of roads in operation (1 000 km) (3) 532 531 597 624 629 647 665 728 925 987 Ownership of automobiles (5) Number of registered lorries (1 000 units) 4 401 4 849 4 929 5 168 5 349 5 323 5 414 5 545 5 751 6 020 Passenger cars and buses (1 000 units) 20 993 26 362 27 618 30 287 32 915 33 980 35 248 37 317 39 719 42 111 Road traffic accident involving personal injury or death Accidents 157 596 223 342 229 140 233 809 218 322 203 618 199 431 199 868 203 597 204 068 Number of injured 179 401 274 864 285 362 292 206 270 883 255 484 250 635 251 848 258 618 258 437 Number of death (6) 29 594 33 957 32 724 33 308 29 936 27 659 26 567 27 953 27 991 27 025 Sources
a) Federal State Statistics Service of the Russian Federation.
b) Ministry of the Interior of the Russian Federation.
c) Federal Agency for Air Transport.Footnotes
(1) Data on legal and physical persons transported passengers on a commercial basis.
(2) Transports of goods by all types of organizations.
(3) Public paved roads. At the end of the year.
(4) Preliminary data.
(5) Number of cars in the property of physical and legal persons.
(6) Since 2009 number of persons who was dies within 30 days after accidents, before 2009-person who was dies within 7 days.
Table 11.2.3 - Selected Data on Transport - India - 2000/2012
2000 2005 2006 2007 2008 2009 2010 2011 2012 Traffic Passenger traffic by railway (million persons-km) 457 022 615 614 694 764 769 956 838 032 903 465 978 508 1 046 522 ... Transport of goods by railway (million tons-km) 315 516 441 762 483 422 523 196 552 002 601 290 626 473 668 618 ... Passenger traffic by air (million persons) 18 32 43 53 50 57 67 75 69 Passenger traffic by air (million persons km) 26 212 51 567 63 880 77 850 78 440 89 442 103 171 112 794 99 971 Transport of goods by air (million tons-km) 549 800 860 1 040 1 200 1 428 1 646 1 750 1 529 Air transport (hours flown) (1 000 hours) 348 712 917 1 144 1 211 1 254 1 356 1 461 1 249 Aircraft kilometres flown (million km) 203 415 540 680 720 717 762 830 719 Production of motor vehicles (in 1 000) (1) 4 759 9 744 11 088 10 854 11 172 14 057 17 916 20 382 20 626 Registered passenger cars and buses (in 000)(2) 6 705 11 212 12 518 13 999 15 377 16 799 18 636 20 835 23 245 Ownership of passenger cars (in 1 000) (3) 5 297 8 073 9 110 10 146 11 200 12 366 13 749 15 467 17 570 Road traffic accident involving personal injury or death Accidents 391 449 439 255 460 920 479 216 484 704 486 384 499 628 497 686 490 383 Number of injured 399 265 465 282 496 481 513 340 523 193 515 458 527 512 511 394 509 667 Number of death 78 911 94 968 105 749 114 444 119 860 125 660 134 513 142 485 138 258 Sources
a) Ministry of Railways, Indian Railways Annual Statistical Statements 2011-2012.
b) Ministry of Road Transport & Highways, Basic Road Statistics of India (various issues) and Transport Year Book.
c) Ministry of Petroleum & Natural Gas, Indian Petroleum & Natural Gas Statistics 2012-2013.
d) Ministry of Civil Aviation, Directorate General of Civil Aviation, Air Transport Statistics (various issues).Footnotes
1. Information on Railways, Civil Aviation & production of vehicles pertains to Financial Year i.e. April (Year Indicated in the table) to March (Next Year)whereas that for registered vehicles /ownership is as on 31st March and that on accidents, injuries and deaths pertains to calendar year.
(1) It includes passenger vehicles (PVs), commercial vehicles (CVs), three wheelers, two wheelers.
(2) Includes Cars, Jeeps, Taxis, Buses and Omnibuses.
(3) Figures indicate number of cars registered in India as on 31st March of the year indicated in the table except for 2000 where the data is as on 31st March 2001.
Table 11.2.4 - Selected Data on Transport - China - 2000/2012
2000 2001 2002 2003 2004 2005 2006 2007 2008 2009 2010 2011 2012 2013(6) Traffic Passenger traffic by road (million persons-km) 665 742 720 708 780 577 769 560 874 838 929 208 1 013 085 1 150 677 1 247 611 1 351 144 1 502 081 1 676 025 1 846 755 1 846 755 Transport of goods by road (million tons-km) 612 940 633 044 678 246 709 948 784 086 869 319 975 425 1 135 469 3 286 819 3 718 882 4 338 967 5 137 474 5 953 486 6 711 451 Passenger traffic by railway (million persons-km) 453 259 476 682 496 938 478 861 571 217 606 196 662 212 721 631 777 860 787 889 876 218 961 229 981 233 1 059 562 Transport of goods by railway (million tons-km) 1 377 049 1 469 414 1 565 842 1 724 665 1 928 877 2 072 603 2 195 441 2 379 700 2 510 629 2 523 917 2 764 413 2 946 579 2 918 709 2 917 389 Passenger traffic by air (million persons-km) 97 054 109 135 126 870 126 319 178 228 204 493 237 066 279 173 288 280 337 524 403 900 453 696 502 574 565 849 Transport of goods by air (million tons-km) 5 027 4 372 5 155 5 790 7 180 7 890 9 428 11 639 11 960 12 623 17 890 17 391 16 389 16 858 Passenger traffic by waterways (million persons-km) 10 054 8 988 8 178 6 310 6 625 6 777 7 358 7 778 5 918 6 938 7 227 7 453 7 748 7 626 Transport of goods by waterways (million tons-km) 2 373 420 2 598 889 2 751 064 2 871 576 4 142 869 4 967 228 5 548 575 6 428 485 5 026 274 5 755 667 6 842 753 7 542 384 8 170 758 8 652 056 Freight traffic of petroleum pipelines (million tons) (1) 187 194 201 220 247 310 334 406 439 446 500 571 612 662 Length of regular civil aviation routes (1 000 km) (2) 994 1 037 1 063 1 034 1 155 1 143 1 147 1 296 1 342 1 425 1 695 1 996 1 995 ... Regular civil airports opened (3) 139 143 141 126 133 135 142 148 152 165 175 178 180 ... Ownership of automobiles Registered automobiles (1000 units) (4) 16 089 18 020 20 532 23 829 26 937 31 597 36 974 43 584 50 996 62 806 78 018 93 563 109 331 126 830 Passenger cars (1000 units) (5) ... ... 10 221 12 871 15 333 19 187 23 952 29 616 35 953 45 913 58 616 72 044 86 831 ... Road traffic accident involving personal injury or death Accidents 616 971 754 919 773 137 667 507 517 889 450 254 378 781 327 209 265 204 238 351 219 521 210 812 204 196 ... Number of injured 418 721 546 485 562 074 494 174 480 864 469 911 431 139 380 442 304 919 275 125 254 075 237 421 224 327 ... Number of death 93 853 105 930 109 381 104 372 107 077 98 738 89 455 81 649 73 484 67 759 65 225 62 387 59 997 ... Sources
a) Ministry of Transport of the People's Republic of China, Annual Statistical Reports 2000-2013.
b) Civil Aviation Administration of China, Annual Statistical Reports 2000-2013.
c) China Railway Corporation, Annual Statistical Reports 2012-2013.
d) China National Petroleum Corporation, Annual Statistical Reports 2000-2013.
e) China National Offshore Oil Corporation, Annual Statistical Report 2013.
f) National Bureau of Statistics of the People's Republic of China, China Statistical Yearbooks 2000-2013 and Statistical Communique of the People's Republic of China on the 2013 National Economic and Social Development.
g) The Ministry of Public Security of the People's Republic of China, Annual Statistical Reports 2000-2013.
h) China Petroleum and Chemical Corporation, Annual Statistical Reports 2000-2013.Footnotes
(1) Since 2013, the statistical coverage of pipeline transport has included China National Offshore Oil Corporation on the basis of China National Petroleum Corporation and China Petroleum & Chemical Corporation.
(2) The indicator "Length of Domestic Civil Aviation Routes" has been changed to "Length of Domestic Regular Civil Aviation Routes" from the year of 2011 but the coverage of the statistics remains stable.
(3) The indicator "Number of Civil Airports" has been changed to "Number of Regular Civil Aviation Airports" from the year of 2011, but the coverage of the statistics remains unchanged.
(4) The ownership of automobiles excludes three-wheel vehicles and low-speed trucks.
(5) The number of passenger cars includes the number of small passenger vehicles and minicars.
(6) Preliminary data.
Table 11.2.5 - Selected Data on Transport - South Africa - 2003/2010
2003 2005 2006 2007 2008 2009 2010 Traffic Passenger traffic by road (million persons) ... ... ... ... 283 288 288 Transport of goods by road (million tons) ... ... ... ... 479 427 450 Passenger traffic by railway (million persons) (1) (2) 482 498 503 592 613 644 520 Transport of goods by railway (million tons) ... ... ... ... 183 183 186 Freight traffic of petroleum pipelines (million tons) (3) (4) ... 16 110 17 032 16 893 17 216 17 751 ... Ownership of passenger cars Passengers cars and buses (1000 units) ... 4 863 5 193 5 477 5 598 5 739 ... Road traffic accident involving personal injury or death Number of death 10 762 11 031 10 946 12 001 9 346 ... ... Sources
a) Statistics South Africa.
b) Passenger Rail Agency of South Africa.
c) Transnet.Footnotes
(1) Passenger Rail Agency of South Africa.
(2) These figures cover Metro rail only.
(3) Transit Pipelines.
(4) The Land Transport Survey is a monthly survey which covers passenger and freight transportation by rail and road in South Africa. This survey is based on a sample drawn from the 2010 Business Sampling Frame (BSF) that contains businesses registered for value-added tax. This survey has replaced the Land Freight Survey which was discontinued in 2003, and was re-engineered from 2008.
Russia
Public Roads refer to the federal roads of federal property; regional and inter municipal roads of the property of constituent entities of the Russian Federation; local roads of the property municipalities as well as of property of settlements, municipal and city districts. India
Length of Railways in Operation: This indicates total route Kilometers, both electrified and non electrified. Length of highways excludes urban and project roads. Length of Petroleum Pipelines includes both onshore & offshore infrastructure. Civil Aviation: information on air traffic and air operations includes operations of Indian Carriers on scheduled both domestic and international services. China
Length of Railways in Operation refers to the total length of the trunk line for passenger and freight transportation ( including both full operation and temporary operation). Length of Highways refers to the length of highways which are built in conformity with the grades specified by the highway engineering standard [Highways WTBZ-Technical Standard JTJ01-88] formulated by the Ministry of Transport, and have been formally checked and accepted by the departments of highways and put into use. Length of Petroleum Pipelines refers to the actual transport distance of oil (or gas) products, which is in general calculated according to the length of single pipeline. Freight Traffic (passenger traffic) refers to the sum of the product of the volume of transported cargo (passengers) multiplied by the transport distance in a given period of time. Freight Traffic of Petroleum Pipelines refers to the total amount of oil (or gas) transported through petroleum pipelines. Length of Domestic Regular Civil Aviation Routes refers to the total length of all domestic periodic civil aviation routes during statistical period. Number of Regular Civil Airports Opened refers to the total number of areas assigned for civil aviation flights to do take-off, landing, taxiing, parking and other actions. Ownership of Automobiles refers to the total number of vehicles that are registered and received vehicles license tags according to the Work Standard for Motor Vehicles Registration formulated by the Transport Management Office under the Department of Public Security at the end of the reference period.
Table 12.1 - Summary of Information Society on BRICS Countries - 2000/2013
2000 2005 2006 2007 2008 2009 2010 2011 2012 2013 Main telephone lines per 1000 inhabitants Brazil 186 215 207 207 214 216 217 220 225 225 Russia 226 299 309 317 319 318 314 309 301 290 India (1) (2) 26 45 36 34 33 32 30 27 25 23 China (3) (4) 124 270 281 278 258 236 221 213 206 197 South Africa (5) ... 215 199 184 181 169 167 ... ... ... Number of subscribers of cellular mobile telephones per 1 000 inhabitants Brazil 140 466 532 636 781 905 1 047 1 239 1 339 1 364 Russia (6) 22 863 1 081 1 199 1 398 1 614 1 664 1 790 1 827 1 937 India (1) (2) 2 70 135 204 300 447 632 742 708 747 China (4) 67 303 353 416 485 563 644 736 825 908 South Africa (7) ... 615 677 735 773 832 865 ... ... ... Number of personal computers per 1 000 inhabitants Brazil ... ... ... ... ... ... ... ... ... ... Russia 64 121 161 218 268 365 437 ... ... ... India ... ... ... ... ... ... ... ... ... ... China (4) (8) ... ... ... ... ... ... ... ... ... 160 Urban 31 140 160 185 204 227 247 285 304 ... Rural 1 5 7 9 13 19 26 46 55 ... South Africa (9) (10) ... 123 ... ... ... ... ... ... ... ... Number of Internet users per 1 000 inhabitants Brazil ... 209 ... ... 348 417 ... 465 492 ... Russia 20 152 180 247 268 290 430 490 533 ... India (2) 5 24 28 40 44 51 75 101 126 175 China 18 85 105 160 226 289 343 383 421 458 South Africa (10) (12) ... 6 ... ... ... 88 101 ... ... ... Number of daily newspapers Brazil ... ... ... ... ... ... ... ... ... ... Russia (13) 946 769 805 774 787 793 770 789 749 ... India (14) 5 364 6 530 6 800 7 131 7 710 8 475 9 355 10 205 10 908 12 109 China (15) 2 007 1 931 1 938 1 938 1 943 1 937 1 939 1 928 1 918 ... South Africa ... ... ... ... ... ... ... ... ... ... Sources
Brazil
a) National Telecommunication Agency - ANATEL.
b) Brazilian Institute of Geography and Statistics - IBGE, National Household Sample Survey 2005/2012.Russia
a) Ministry of Communication and Mass Media of the Russian Federation.
b) Federal State Statistics Service of the Russian Federation.
c) World Bank.India
a) Telecom Regulatory Authority of India, Indian Telecom Services Performance Indicator Report (various issues).
b) Ministry of Information and Broadcasting, Office of the Registrar of Newspapers for India, Press in India (various issues).
c) International Telecommunication Union.China
a) Ministry of Industry and Information Technology of the People's Republic of China.
b) National Bureau of Statistics of the People's Republic of China, Integrated Household Survey in Urban and Rural Areas of China 2013; Urban Household Survey in China 2000-2012; and Rural Household Survey in China 2000-2012.
c) State Administration of Press, Publication, Radio, Film and Television of the People's Republic of China, Annual Statistical Report 2010-2012.South Africa
General Household Survey 2002-2010.Footnotes
Russia
(6) Number of user's devices of mobile radiotelephone (cellular) communication.
(13) Newspapers issued 3 and more times per week (number of titles).India
(1) Data is as on 31st December of the year indicated in the table (except for 2000 where it is Financial Year end i.e. 31st March 2001). Information for main telephone line pertains to wireline whereas that for cellular mobile telephone pertains to wireless subscription in case of India.
(2) Mid Year population estimates have been used for arriving at figures per 1000 inhabitants.
(11) Information for 2000-2012 is as per ITU database whereas data for 2013 is as provided by Telecom Regulatory Authority of India and is as on 30th September 2013.
(14) Data relates to 31st March of the year indicated in the table except for 2000 where the same is as on 31st December 2000.China
(3) PHS subscribers are also included in those of the main telephone lines.
(4) Preliminary data.
(8) In the fourth quarter of 2012, National Bureau of Statistics of the People's Republic of China conducted the integrated survey of urban and rural households, unifying the names, classification and statistical standards of urban and rural households. On its basis, we got the ownership data of resident in China, including the number of colour TV sets, cars and personal computers etc.
(15) Kinds of newspapers.South Africa
Household based question
(5) Does the household have access to a telephone line in the dwelling or household?
(7) Does the household have access to a cell phone in the dwelling or household?
(9) Does the household have access to a computer in the dwelling or household? Question was only asked once, in 2005.
(10) Does the household have access to an internet connection in the dwelling or household? Question was asked in 2005, and then again in
(12) Not access to outside sources, just whether they have access in the household.
Brasil
Number of Internet Users per 1000 Inhabitants - It was considered the inhabitants 10 years old or over. Internet users - persons 10 years old or over who accessed the Internet somewhere (own home, workplace, center of free or paid acess, home of other persons or any other place) by PC desktop or laptop (notebook, palmtop, pocket pc or handheld) at least once in the reference period of the last three months. Russia
Main Telephone Lines are telephone sets having independent numbers at the public telephone station as well as telephones with a shared line intended or public use. They switched on the public network and render service of local, inetrcities and international communication. Cellular communication - mobile radio and telephone communication. Mobile communication - complex of technical means (radio and communication equipment, communication lines and structures), which render communication facilities for mobile subscribers and subscribers of public telephone network. India
Main telephone Line - Information relates to wireline connections i.e. connections with (fixed) telephone line connecting the subscriber's terminal equipment to the network. It includes WLL (fixed line extending upto the base unit). Subscribers of Cellular Mobile Telephone - Includes wireless connections. Data on Internet User - Includes information on subscription through both fixed lines as well as wireless (mobile phones ) internet subscriptions. Number of Daily Newspaper - includes newspapers in all languages & bilingual/multilingual newspapers. China
Main Telephone Line refers to a main line which is a (fixed) telephone line connecting the subscriber's terminal equipment to the public switched network and which has a dedicated port in the telephone exchange equipment. The number of ISDN channels are included. PHS subscribers are included. Subscribers of Cellular Mobile Telephone refer to number of portable telephone users subscribing to a public mobile telephone service and have access to Public Switched Telephone Network (PSTN) using cellular technology. This includes analogue and digital cellular systems. Internet Users refer to the inhabitants aged 6 or above and have connected with Internet at least once in the last 6 months. Number of Daily Newspapers includes all kinds of newspapers, with CSSN (China Standard Serial Number). South Africa
Household based question.
Does the household have access to a telephone line in the dwelling or household? Does the household have access to a cell phone in the dwelling or household?
Does the household have access to a computer in the dwelling or household? Question was only asked once, in 2005.
Does the household have access to an internet connection in the dwelling or household? Question was asked in 2005, and then again in 2009, 2010. Not access to outside sources, just whether they have access in the household.
Table 13.1 - Summary of Finance on BRICS Countries - 2000/2013
2000 2006 2007 2008 2009 2010 2011 2012 2013 Share of deficit (-)/surplus of general government to GDP (%) Brazil (1) (2) -3.8 -3.5 -2.3 -2.4 -3.3 -2.9 -3.1 -3.0 -3.9 Russia 1.4 7.4 5.4 4.1 -6.0 -3.9 0.8 -0.1 -0.5 India (4) (5) -6.6 -1.3 -0.2 -4.3 -5.7 -3.2 -4.3 -3.0 ... China -2.5 -0.8 0.6 -0.4 -2.3 -1.7 -1.1 -1.7 -1.9 South Africa (6) -1.0 0.7 1.1 1.5 -0.6 -4.8 -3.7 ... ... Share of income tax to revenue (%) Brazil (7) 18.7 19.4 20.5 19.9 Russia(3) 8.3 8.8 9.5 10.4 12.2 11.2 9.6 9.6 10.4 India (4) (5) 11.0 20.4 23.2 21.3 20.5 20.7 19.2 19.7 ... China 12.4 24.5 23.3 24.3 22.6 21.3 22.0 21.7 22.4 South Africa (6) 42.3 40.8 43.3 44.4 46.6 43.9 41.3 ... ... M2 supply (year-end) (million US$) Brazil (8) 155 150 303 900 401 088 584 063 585 732 774 085 966 092 902 770 904 174 Russia(9) 40 859 340 703 524 196 441 658 504 881 656 558 760 345 902 384 961 565 India (4) (10) 84 136 215 265 288 781 274 935 315 253 359 781 361 414 351 852 330 331 China(11) 1 626 042 4 425 879 5 523 125 6 952 369 8 878 255 10 960 059 13 517 316 15 498 350 18 148 717 South Africa (6) 62 156 164 298 204 485 167 852 215 443 253 282 221 077 220 161 ... Sources
Brazil
a) Central Bank of Brazil.
b) National Treasury Secretariat.Russia
a) Federal State Statistics Service of the Russian Federation.
b) Federal Treasury.
c) Bank of Russia.India
a) Ministry of Finance, Union Budget (various issues).
b) Ministry of Statistics and Programme Implementation, Central Statistics Office, Statistical Year Book 2014.
c) Reserve Bank of India, Bulletin on Money Stock Measures (various issues).China
a) Ministry of Finance of the People's Republic of China.
b) The People's Bank of China.
c) National Bureau of Statistics of the People's Republic of China.South Africa
South African Reserve Bank.Footnotes
Brazil
(1) The general government includes federal government, state governments, and local governments, and excludes Central Bank of Brazil and public enterprises.
(2) Nominal result.
(7) Total tax revenue corresponds to the fiscal load.
(8) The Annual average exchange rates used is available in Tables 13.2.1 and 14.1.Russia
(3) The calculation carried out on the basis of data of the Federal Treasury, 2013 - according to preliminary data.
(9) The calculation according to the data of Bank of Russia. 2013 - preliminary data.India
(4) For all Information reference year is Financial Year (i.e. April of the year indicated in the table to March next year).
(5) The data relates to General Government i.e. Central Government & State Government combined. GDP is at current market price. Income tax is collected by Central Governemnt only. Information since 2011 is provisional.
(10) Includes Currency with public, deposit money of the public and post office saving bank deposit. Average annual exchange rate for the financial year has been used for currency conversion.China
(11) M2 is calculated using the year-end exchange rates released by State Administration of Foreign Exchange.South Africa
(6) Fiscal year: year begins on 01 April to 31 March of the following year. M2 comprises:
* notes and coins in circulation outside monetary sector.
* cheque and transmission deposits.
* other demand, short & medium term deposits up to 6 months.
Table 13.2.1 - Selected Data on Finance - Brazil - 2000/2013
2000 2006 2007 2008 2009 2010 2011 2012 2013 Expenditure (million R$) (1) 315 421 797 835 838 504 969 130 1 136 855 1 115 572 1 179 629 1 519 572 1 440 397 Structure of expenditure of consolidated budget (%) General public services 5.3 4.0 4.4 4.2 3.9 4.5 4.2 3.5 3.8 Foreign affairs 0.2 0.2 0.2 0.2 0.1 0.2 0.2 0.1 0.1 National defense 3.4 2.1 2.3 2.3 2.3 2.9 2.7 2.4 2.6 Public security 0.7 0.4 0.6 0.6 0.6 0.8 0.6 0.5 0.5 Education 3.4 2.2 2.6 2.6 2.9 3.9 4.5 4.3 5.3 Science and technology 0.4 0.5 0.5 0.5 0.5 0.7 0.6 0.5 0.7 Culture, sport and media 0.1 0.2 0.3 0.2 0.2 0.2 0.2 0.2 0.3 Social safety net and employment effort 33.0 31.4 33.2 31.9 31 35.5 37.4 32.8 40.0 Medical and health care 6.4 5.0 5.4 5.1 5.0 5.4 6.0 5.2 5.8 Environment protection 0.4 0.2 0.4 0.4 0.3 0.3 0.3 0.4 0.4 Urban and rural community affairs 1.0 0.9 1.4 1.2 1.2 1 0.9 0.9 1.1 Agriculture, forestry and water conservancy 1.6 1.2 1.3 1.0 1.2 1.3 1.3 1.0 1.4 Transportation 1.0 0.9 1.5 1.3 1.4 1.8 1.6 1.5 1.4 Industry, commerce and banking 0.7 0.6 0.7 0.6 0.5 0.5 0.5 0.4 0.5 Other expenditure (2) 42.4 50.3 45.6 47.9 48.7 41 39.2 46.4 36.0 Annual average exchange rates in national currency/US dollar (R$) 1.8 2.2 1.9 1.8 2.0 1.8 1.7 2.0 2.2 Currency issued- M0 (year-end) (million R$) 47 686 121 102 146 617 147 550 166 073 206 853 214 235 233 371 249 510 Currency issued - M0 (year-end) (million US$) 26 071 55 636 75 269 80 317 83 324 117 604 127 959 119 390 115 503 Currency issued- M1 (year-end) (million R$) 74 352 174 345 231 430 223 440 250 234 280 141 285 377 325 045 344 843 Currency issued - M1 (year-end) (million US$) 40 650 80 096 118 810 121 626 125 550 159 271 170 451 166 289 159 635 Currency issued- M2 (year-end) (million R$) 283 785 661 500 781 280 1 072 986 1 167 424 1 362 389 1 617 480 1 764 645 1 953 197 Currency issued - M2 (year-end) (million US$) 155 150 303 900 401 088 584 063 585 732 774 085 966 092 902 770 904 174 Discount rate of Central Bank (%) 15.8 13.3 11.3 12.8 8.8 10.8 10.9 7.2 9.9 Interest rate of deposit and lending (%) 15.8 12.6 11.5 12.6 9.9 11.5 10.3 7.7 11.5 Sources
a) Central Bank of Brazil.
b) National Treasury Secretariat.Footnotes
(1) Data covers Federal Government only.
(2) "Other expenditure" is the single largest item because it comprises transactions such as transfers to states and municipalities and debt management expenditure.
Table 13.2.2 - Selected Data on Finance - Russia - 2000/2013
2000 2006 2007 2008 2009 2010 2011 2012 2013 Revenue and expenditure of consolidated (general government) budget Revenue (billion Rub) (1) 2 098 10 626 13 368 16 004 13 600 16 032 20 855 23 435 24 082 Structure of revenue of consolidated budget (%) Profit (income) tax of organisations 19.0 15.7 16.2 15.7 9.3 11.1 10.9 10.1 8.6 Income tax of individuals 8.3 8.8 9.5 10.4 12.2 11.2 9.6 9.6 10.4 Tax, dues and regular payment for natural Resources usage (%) ... 11.2 9.2 10.9 7.9 9.0 10.0 10.6 10.8 Revenue from external economic activities (%) ... 21.7 18.0 22.4 19.7 20.1 22.4 21.2 20.8 Expenditure (billion Rub) (1) 1 960 8 375 11 379 13 992 16 048 17 617 19 995 23 175 24 931 Structure of expenditure of consolidated budget General and local government (%) (2) ... 9.9 10.3 9.2 8.2 8.2 6.8 6.2 6.1 National economy (%) ... 11.3 13.7 16.1 17.3 13.2 14.0 14.1 13.2 Social-cultural arrangements (%) 27.4 54.3 51.2 50.9 52.8 57.5 56.2 57.0 57.4 Currency issued- M0 (year-end) (billion Rub) (3) 419 2 785 3 702 3 795 4 038 5 063 5 939 6 430 6 986 Currency issued - M0 (year-end) (billion US$) (4) 15 106 151 129 134 166 184 212 214 Currency issued- M2 (year-end) (billion Rub) (3) 1 151 8 971 12 869 12 976 15 268 20 012 24 483 27 405 31 405 Currency issued - M2 (year-end) (billion US$) (4) 41 341 524 442 505 657 760 902 962 Discount rate of Central Bank (year-end) (%) (3) 25.0 11.0 10.0 13.0 8.8 7.8 8.0 8.3 8.3 Interest rate (%) (3) Deposit 6.5 4.1 5.1 5.8 8.6 6.0 4.4 5.5 ... Lending 24.4 10.4 10.0 12.2 15.3 10.8 8.5 9.1 ... Sources
a) Federal State Statistics Service of the Russian Federation.
b) Federal Treasury.
c) Bank of Russia.Footnotes
(1) In 2005 in Russia has adopted a new budget classification. Since 2005 data are included budgets of state extra-budgetary funds. 2013- preliminary data.
(2) Since 2011 excepting expenses on services of the state and municipal debt.
(3) Data of Bank of Russia.
(4) The calculation is according to the data of Bank of Russia.
Table 13.2.3 - Selected Data on Finance - India - 2000/2012
2000 2006 2007 2008 2009 2010 2011 2012 Revenue and expenditure of consolidated (general government) budget Total receipts (billion ₹)(1) 5 979 11 253 13 559 15 648 18 458 21 536 25 363 28 369 Revenue receipts (%) (1) 63.4 77.9 78.2 71.4 65.6 73.3 69.0 73.0 Tax receipts (%) (1) 51.1 64.3 64.7 59.2 53.3 58.0 57.3 60.6 Non-tax receipts (%) (1) 12.3 13.6 13.5 12.2 12.2 15.3 11.7 12.4 Expenditure of consolidated (general government) budget (billion ₹) (1) 5 956 11 092 13 153 15 997 18 521 21 451 25 188 28 359 Total expenditure of ministries/ departments and its distribution (billion ₹) (2) 3 256 5 834 7 127 8 840 10 245 11 973 13 044 14 104 Agriculture and rural development (%) 4.5 5.8 7.9 6.9 7.7 6.3 5.0 6.0 Defence services (%) 18.5 15.2 15.4 17.8 16.2 16.4 15.6 15.2 Health services (%) 1.6 2.0 2.0 2.0 2.0 2.1 2.0 2.2 Education (%) 2.4 3.8 4.0 3.7 4.3 4.6 4.7 4.8 Petroleum and natural gas (%) 0.1 0.4 0.4 1.6 3.2 5.4 6.8 3.9 Science, technology and IT (%) 0.5 0.6 0.8 0.7 0.8 0.7 0.6 0.7 Transport (%) 3.6 4.6 3.3 2.1 2.0 3.8 3.7 3.8 Economic affairs (centralized provisions) (%) 35.2 27.7 24.8 23.5 22.3 24.2 26.0 26.0 Home affairs (%) 3.2 2.8 3.0 3.4 3.3 3.5 3.4 3.4 Consumer affairs, food and public distribution (%) 3.8 4.6 5.1 5.7 5.9 5.7 6.1 5.5 Others (%) 26.6 32.5 33.3 32.6 32.3 27.3 26.1 28.5 Money stock measures (billion ₹) M1 3 794 9 680 11 558 12 597 14 893 16 355 17 334 18 949 M2 3 845 9 730 11 609 12 647 14 943 16 406 17 384 19 000 M3 13 132 33 101 40 179 47 948 56 027 64 995 73 578 83 820 M4 13 392 33 360 40 439 48 207 56 287 65 255 73 837 84 080 Foreign currency assets - FCA (million US$) 39 554 191 924 299 230 241 426 254 685 274 330 260 069 259 726 SDRs (million) 2 2 18 1 5 006 4 569 4 469 4 328 Reserve position in the IMF - RTP (million US$) 616 469 436 981 1 380 2 947 2 836 2 301 Foreign exchange reserves excluding gold (million US$) 40 172 192 395 299 684 242 408 261 071 281 846 267 374 266 354 Foreign exchange reserve of gold (million US$) 2 725 6 784 10 039 9 577 17 986 22 972 27 023 26 292 Structure of interest rates Deposit rates (% per annum) (3) Savings (4) 4.0 3.5 3.5 3.5 3.5 3.5 4.0 4.0 Term deposits 1 to 3 years 8.50-9.50 6.75-8.50 8.00-8.75 8.00-8.75 6.00-7.00 8.25-9.00 9.25 8.75-9.00 3 to 5 years 9.50-10.00 7.75-9.50 8.00-8.75 8.00-8.50 6.50-7.50 8.25-8.75 9.00-9.25 8.75-9.00 Above 5 years 8.50-10.00 7.75-8.50 8.50-9.00 7.75-8.50 7.00-7.75 8.50-8.75 8.50-9.25 8.50-9.00 Lending rates (% per annum) (3) 11.00-12.00 12.25-14.75 12.25-15.75 11.50-16.75 11.00-15.75 8.25-9.50 10.00-10.75 9.70-10.25 Sources
a) Ministry of Finance, Union Budget (various issues).
b) Reserve Bank of India, Hand Book of Statistics on Indian Economy and Bulletin on Money Stock Measures (various issues).Footnotes
1. For all Information reference year is Financial Year (i.e. April of the year indicated in the table to March next year). End of Financial Year i.e. 31st March (Next year) in case of foreign exchange reserves.
(1) Total receipts and Total expenditures consists Central and State Govt Receipts and expenditures.
(2) The information relates to expenditure (both Plan and Non Plan) by Ministries/Departments of Centre and Union Territories including Plan expenditure of States.
(3) Data for Deposit and lending rates relates to five major Public Sector Banks up to 2003-04. For the remaining years, the data relates to five major banks. Data on lending rate relates to Prime Lending Rate or Benchmark Prime Lending Rate or Base Rate as the case may be for relevant year.
(4) Savings deposit rates from 2011-12 onwards relates to balance up to 1 Lakh. Savings deposit rate was deregulated with effect from October 25, 2011.
Table 13.2.4 - Selected Data on Finance - China - 2000/2013
2000 2006 2007 2008 2009 2010 2011 2012 2013 Revenue and expenditure of consolidated (general government) budget revenue (1) (2) 1 339 523 3 876 020 5 132 178 6 133 035 6 851 830 8 310 151 10 387 443 11 725 352 12 914 290 Structure of revenue of consolidated budget (%) Total tax revenue ... ... 88.9 88.4 86.9 88.1 86.4 85.8 85.6 Domestic value added tax ... ... 30.1 29.3 27.0 25.4 23.4 22.5 22.3 Domestic consumption tax ... ... 4.3 4.2 6.9 7.3 6.7 6.7 6.4 VAT and consumption tax from imports ... ... 12.0 12.1 11.3 12.6 13.1 12.6 10.8 VAT and consumption tax rebate for exports ... ... -11.0 -9.6 -9.5 -8.8 -8.9 -8.9 -8.1 Business tax ... ... 12.8 12.4 13.2 13.4 13.2 13.4 13.3 Corporate income tax ... ... 17.1 18.2 16.8 15.5 16.1 16.8 17.4 Individual income tax ... ... 6.2 6.1 5.8 5.8 5.8 5.0 5.1 Resource tax ... ... 0.5 0.5 0.5 0.5 0.6 0.8 0.8 City maintenance and construction tax ... ... 2.3 2.2 2.3 2.3 2.7 2.7 2.6 House property tax ... ... 1.1 1.1 1.2 1.1 1.1 1.2 1.2 Stamp tax ... ... 4.4 2.1 1.3 1.3 1.0 0.8 1.0 Stamp tax on security exchange ... ... 3.9 1.6 0.7 0.7 0.4 0.3 0.4 Urban land use tax ... ... 0.8 1.3 1.3 1.2 1.2 1.3 1.3 Land appreciation tax ... ... 0.8 0.9 1.1 1.5 2.0 2.3 2.6 Tax on vehicles and boat operation ... ... 0.1 0.2 0.3 0.3 0.3 0.3 0.4 Tax on ship tonnage ... ... 0.0 0.0 0.0 0.0 0.0 0.0 0.0 Vehicle purchase tax ... ... 1.7 1.6 1.7 2.2 2.0 1.9 2.0 Tariffs ... ... 2.8 2.9 2.2 2.4 2.5 2.4 2.0 Farm land occupation tax ... ... 0.4 0.5 0.9 1.1 1.0 1.4 1.4 Deed tax ... ... 2.4 2.1 2.5 3.0 2.7 2.5 3.0 Tobacco leaf tax ... ... 0.1 0.1 0.1 0.1 0.1 0.1 0.1 Other tax revenue ... ... 0.0 0.0 0.0 0.0 0.0 0.0 0.0 Total non-tax revenue ... ... 11.1 11.6 13.1 11.9 13.6 14.2 14.4 Special program receipts ... ... 2.4 2.5 2.4 2.5 2.9 2.8 2.7 Charge of administrative and institutional units ... ... 3.7 3.5 3.4 3.6 3.9 3.9 3.7 Penalty receipts ... ... 1.6 1.5 1.4 1.3 1.3 1.3 1.3 Other non-tax receipts ... ... 3.4 4.1 5.9 4.5 5.5 6.2 6.7 Expenditure (million RMB) (1) (2) 1 588 650 4 042 273 4 978 135 6 259 266 7 629 993 8 987 416 10 924 779 12 595 297 13 974 426 Structure of expenditure of consolidated budget (%) General public services ... ... 17.1 15.7 14.9 15.1 15.7 15.7 15.5 Foreign affairs ... ... 0.4 0.4 0.3 0.3 0.3 0.3 0.3 National defense ... ... 7.1 6.7 6.5 5.9 5.5 5.3 5.3 Public security ... ... 7.0 6.5 6.2 6.1 5.8 5.6 5.5 Education ... ... 14.3 14.4 13.7 14.0 15.1 16.9 15.7 Science and technology ... ... 3.6 3.4 3.6 3.6 3.5 3.5 3.6 Culture, sport and media ... ... 1.8 1.8 1.8 1.7 1.7 1.8 1.8 Social safety net and employment effort ... ... 10.9 10.9 10.0 10.2 10.2 10.0 10.3 Medical and health care ... ... 4.0 4.4 5.2 5.3 5.9 5.8 5.9 Environment protection ... ... 2.0 2.3 2.5 2.7 2.4 2.4 2.4 Urban and rural community affairs ... ... 6.5 6.7 6.7 6.7 7.0 7.2 7.9 Agriculture, forestry and water conservancy ... ... 6.8 7.3 8.8 9.0 9.1 9.5 9.5 Transportation ... ... 3.8 3.8 6.1 6.1 6.9 6.5 6.6 Industry, commerce and banking affairs ... ... 8.6 9.9 7.9 8.9 8.1 7.5 7.3 Post-earthquake recovery and reconstruction ... ... ... 1.3 1.5 1.3 0.2 0.1 0.0 Other expenditure ... ... 5.9 4.7 4.2 3.0 2.7 2.0 2.4 Currency issued- M0 (year-end) (million RMB) 1 465 270 2 707 262 3 037 523 3 421 896 3 824 597 4 462 820 5 074 847 5 465 977 5 855 831 Currency issued - M0 (year-end) (million US$) (3) 176 999 346 698 415 837 500 672 560 118 673 867 805 531 869 617 960 460 Currency issued- M1 (year-end) (million RMB) 5 314 720 12 603 513 15 256 008 16 621 713 22 000 151 26 662 150 28 984 770 30 866 423 33 726 063 Currency issued - M1 (year-end) (million US$) (3) 641 998 1 614 035 2 088 548 2 431 995 3 221 955 4 025 873 4 600 757 4 910 735 5 531 674 Currency issued- M2 (year-end) (million RMB) 13 461 030 34 560 359 40 344 221 47 516 660 60 622 501 72 585 180 85 159 090 97 414 880 110 650 915 Currency issued - M2 (year-end) (million US$) (3) 1 626 042 4 425 879 5 523 125 6 952 369 8 878 255 10 960 059 13 517 316 15 498 350 18 148 717 Interest rate of deposit (year-end) (%) (4) 2.3 2.5 4.1 2.3 2.3 2.8 3.5 3.0 3.0 Interest rate of lending (year-end) (%) (4) 5.9 6.1 7.5 5.3 5.3 5.8 6.6 6.0 6.0 Sources
a) Ministry of Finance of the People's Republic of China.
b) The People's Bank of China.Footnotes
(1) Since 2009, there have been some changes on the classification of expenditure, so the data can not be compared with the previous ones.
(2) Data of 2013 are budget implementation data.
(3) Currency issued on million US$ is calculated using the year-end exchange rates released by State Administration of Foreign Exchange.
(4) Deposit rates and lending rates refer to the one-year official interest rates of deposits and loans of financial institutions.
Table 13.2.5 - Selected Data on Finance - South Africa - 2000/2011
2000 2006 2007 2008 2009 2010 2011 Revenue and expenditure of consolidated Structure of revenue of consolidated budget (%) Total tax revenue 79.2 79.4 81.9 81.5 80.8 78.6 78.8 Domestic value added tax 13.5 22.2 22.4 23.0 22.8 23.9 22.3 Domestic consumption tax ... ... ... ... ... ... ... VAT and consumption tax from imports 10.2 12.0 14.0 14.0 13.9 10.9 11.8 VAT and consumption tax rebate for exports 0.0 0.0 0.0 0.0 0.0 0.0 0.0 Business tax 0.0 0.0 0.0 0.0 0.0 0.0 0.0 Corporate income tax 10.8 18.5 21.4 21.8 22.8 18.7 16.5 Individual income tax 31.5 22.3 21.9 22.7 23.8 25.3 24.8 Resource tax 0.0 0.0 0.0 0.0 0.0 0.0 0.0 City maintenance and construction tax 0.0 0.0 0.0 0.0 0.0 0.0 0.0 House property tax 3.9 2.9 2.5 2.8 2.6 3.2 3.3 Stamp tax 0.0 0.0 0.0 0.0 0.0 0.0 0.0 Stamp tax on security exchange 1.3 1.9 1.5 1.5 1.0 1.0 0.9 Deed tax 0.7 1.5 1.0 1.0 0.6 0.6 0.6 Tobacco leaf tax 0.0 1.1 1.1 1.1 1.1 1.2 1.1 Other tax revenue (1) 7.3 -3.0 -4.8 -6.3 -8.3 -6.0 -2.4 Total non-tax revenue 20.8 20.6 19 18.5 19.6 21.4 21.2 Special program receipts 1.7 1.8 1.7 1.9 2.0 2.2 1.9 Charge of administrative and institutional units 61.7 53.9 51.4 41.6 38.4 46.0 5.4 Penalty receipts 0.6 0.7 0.3 0.5 0.4 0.3 0.4 Other non-tax receipts 5.6 7.0 7.2 8.5 9.7 9.0 17.7 Structure of expenditure of consolidated budget (%) General public services 25.6 23.8 23.5 21.4 20.7 19.8 ... Foreign affairs 0.5 0.5 0.4 0.5 0.6 0.7 ... National defense 4.1 4.7 4.1 3.8 3.8 3.4 ... Public security 8.9 9.6 9.8 10.1 10.1 10.2 ... Education 18.5 17.0 16.8 16.7 16.7 18.0 ... Science and technology ... ... ... ... ... ... ... Culture, sport and media 1.5 2.6 2.1 2.3 2.3 2.6 ... Social safety net and employment effort 10.4 12.7 13.1 12.9 12.8 13.0 ... Medical and health care 8.9 8.9 9.2 9.5 9.8 10.3 ... Environment protection 1.8 0.7 0.6 0.7 0.7 0.7 ... Urban and rural community affairs 2.6 3.7 3.6 3.9 4.1 4.1 ... Agriculture, forestry and water conservancy 2.3 2.8 2.7 2.7 2.5 3.1 ... Transportation 4.5 3.5 4.5 4.7 5.9 6.1 ... Industry, commerce and banking 0.4 1.2 1.2 1.3 1.4 0.9 ... Post-earthquake recovery and reconstruction ... 2.0 2.6 2.8 3.0 3.0 ... Other expenditure 10.1 6.4 5.6 6.5 4.7 3.9 ... Currency issued- M0 (year-end) (million ZAR) 43 568 96 071 110 130 120 513 126 881 135 999 158 666 Currency issued - M0 (year-end) (million US$) 5 757 13 776 16 229 12 953 17 211 20 536 19 512 Currency issued - M1 (year-end) (million ZAR) 274 355 605 679 738 317 753 628 806 261 862 788 947 174 Currency issued - M1 (year-end) (million US$) 36 250 86 852 108 797 81 005 109 367 130 284 116 477 Currency issued - M2 (year-end) (million ZAR) 474 848 1 156 842 1 396 325 1 561 612 1 588 265 1 677 329 1 797 771 Currency issued - M2 (year-end) 62 742 165 886 205 761 167 852 215 443 253 282 221 077 Currency issued - M3 (year-end) (million ZAR) (2) 520 665 1 349 293 1 667 580 1 914 200 1 948 222 2 083 114 2 255 567 Currency issued - M3 (year-end) (million US$) (2) 68 795 193 483 245 732 205 750 264 270 314 557 277 373 Discount rate of Central Bank (%) 12.0 9.0 11.0 11.5 7.0 5.5 5.5 Interest rate of deposit and lending (%) (3) 14.5 12.5 14.5 15.0 10.5 9.0 9.0 Source
South African Reserve Bank.Footnotes
Government finance in fiscal years; year begins on 01 April to 31 March of the following year.
(1) No definition available for some of the tax categories. Therefore this value is the residual of all other taxes. Total tax revenue minus the detail of all available categories. This also includes the adjustments made for South African Customs Union transfers.
(2) M3 is the broadly defined money supply aggregate officially used in South Africa.
(3) The prime overdraft rate serves as a market reference or benchmark rate for interest rates, but does not determine interest rates.
Graph 13.1 (a) - Percentage Share of Deficit (-)/Surplus of General Government to GDP - 2006/2012
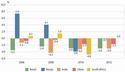
Click to enlargeSource: Summary Table of Chapter 13, BRICS Joint Statistical Publication 2014.
Graph 13.1 (b) - Percentage Share of Income Tax to Revenue - 2006-2009
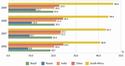
Click to enlargeSource: Summary Table of Chapter 13, BRICS Joint Statistical Publication 2014.
Brasil
Share of Deficit(-)/Surplus of General Government to GDP - The general government includes federal government, state governments, and local governments, and excludes Central Bank of Brazil (Bacen). and public enterprises. Nominal result. Share of Income Tax to Revenue - Total tax revenue corresponds to the fiscal load. M2 Supply (End of the Year) - The Annual average exchange rates used is available in Tables 13.2.1 and 14.1. Expenditure - Data covers Federal Government only. Other expenditure is the single largest item because it comprises transactions such as transfers to states and municipalities and debt management expenditure. Russia
Budget Revenues monetary funds coming to the budget, excluding funds which in accordance to the Budget Code of the Russian Federation are the sources of financing the budget deficit. Budget Expenditures monetary funds paid from the budget funds, excluding funds which in accordance to the Budget Code of the Russian Federation are the sources financing the budget deficit. Deposit Rate average rate on deposits of individuals in credit institutions (including OAO Sberbank of Russia) for up to 1 year. Lending Rate average rate on loans to corporate customers in credit institutions (including Sberbank of Russia) up to 1 year. Annual rates are calculated as the average of monthly data. India
General Government includes both Central Government and State Government. Income Tax: Income Tax Act, 1961 imposes tax on the income of the individuals or Hindu undivided families or firms or co- operative societies (other than companies) and trust (identified as bodies of individuals associated of persons) or every artificial juridical person. The inclusion of a particular income in the total incomes of a person for income-tax in India is based on his residual status. There are three residential status, viz., (i) Resident & Ordinarily Residents (Resident) (ii) Resident but not Ordinary Resident and (iii) Non Residents. There are several steps involved in determining the residential status of a person. All residents are taxable for all their income, including income outside India. Non residents are taxable only for the income.
M1 = Currency with the Public + Deposit money of the Public
M2 = M1 + Post Office savings banks deposits.
M3 = M1 + Time deposits with banks.
M4 = M3 +Total Post Office Deposits.China
Revenue of Consolidated Budget refers to income for the government finance through participating in the distribution of social products. It is the financial guarantee to ensure government functioning. The contents of government revenue have been changed several times. Expenditure of Consolidated Budget refers to the distribution and use of the funds which the government finance has raised, so as to meet the needs of economic construction and various causes. Share of Deficit/Surplus of General Government to GDP = (Revenue of consolidated budget- Expenditure of consolidated budget)/GDP. The Contents of Government Revenue include the following main items: a) Various Tax Revenues including domestic value added tax (VAT), domestic consumption tax, VAT and consumption tax from imports, VAT and consumption tax rebate for exports, business tax, corporate income tax, individual income tax, resource tax, city maintenance and construct tax, house property tax, stamp tax, urban land use tax, land appreciation tax, tax on vehicles and boat operation, ship tonnage tax, vehicle purchase tax, tariffs, farm land occupation tax, deed tax, and tobacco leaf tax, etc. b) Non-Tax Revenue including special program receipts, charge of administrative and institutional units, penalty receipts and others non-tax receipts. The Contents of Government Expenditure include the following main items:
a) Expenditure for general public services; b) Expenditure for foreign affairs; c) Expenditure for national defence; d) Expenditure for public security; e) Expenditure for education; f ) Expenditure for science and technology; g) Expenditure for culture, sports and media; h) Expenditure for social safety net and employment effort; i) Expenditure for medical and health care; j) Expenditure for environment protection; k) Expenditure for urban and rural community affairs; l) Expenditure for agriculture, forestry and water conservancy; m)Expenditure for transportation; n) Expenditure for industry, commerce and banking, etc.South Africa
M0 = Deposits of monetary institutions with the central bank and banknotes and coin in circulation outside the central bank.
M1 =Notes and coin in circulation plus cheque and transmission deposits and other demand deposits of domestic private sector with monetary institutions. M2 = M1 plus other short-term deposits held by the domestic private sector. M3 = M2 plus long-term deposits held by the domestic private sector.
14 External Economic Relations
Table 14.1 - Summary of External Economic Relations on BRICS Countries - 2000/2013
2000 2006 2007 2008 2009 2010 2011 2012 2013 Value of imports and exports of goods and commercial services (million US$) Brazil 137 027 277 750 342 394 448 640 355 402 477 717 596 636 586 530 607 560 Russia 175 689 542 660 674 052 889 662 590 272 762 792 983 498 1 034 881 (1) 779 897 India(2) 125 940 430 240 556 618 647 001 623 198 826 096 1 015 835 1 017 576 ... China (3) 530 249 1 914 458 2 376 498 2 814 784 2 446 417 3 264 141 3 997 755 4 264 789 ... South Africa 70 187 163 128 187 742 204 610 158 287 199 614 238 064 172 581 ... Value of imports of goods and commercial services (million US$) Brazil 72 444 120 467 157 790 220 247 174 679 244 202 302 388 304 089 326 263 Russia 61 091 209 460 283 661 366 228 247 321 320 958 410 050 444 536 (1) 344 748 India(2) 65 112 230 046 303 144 355 742 348 403 450 324 567 546 571 497 ... China (3) 250 688 852 769 1 034 231 1 232 976 1 113 143 1 520 559 1 907 926 2 016 472 ... South Africa ... ... ... ... ... ... ... ... ... Value of exports of goods and commercial services (million US$) Brazil 64 584 157 283 184 603 228 393 180 723 233 514 294 249 282 442 281 297 Russia 114 598 333 200 390 391 523 434 342 951 441 833 573 448 590 345 (1) 435 149 India(2) 60 828 200 194 253 474 291 259 274 795 375 772 448 289 446 079 ... China (3) 279 561 1 061 688 1 342 267 1 581 808 1 333 274 1 743 583 2 089 830 2 248 317 ... South Africa ... ... ... ... ... ... ... ... ... Share of current account surplus(+)/deficit(-) to GDP (%) Brazil -3.8 1.3 0.1 -1.7 -1.5 -2.2 -2.1 -2.4 -3.7 Russia 18.0 9.3 5.5 6.3 4.1 4.4 5.1 3.7 (4) 2,9 India(2)(5) -0.6 -1.0 -1.3 -2.3 -2.8 -2.8 -4.2 -4.7 ... China 1.7 8.5 10.1 9.3 4.9 4.0 1.9 2.3 ... South Africa -0.1 -3.5 -5.3 -7.2 -7.1 -4.1 -3.4 -5.9 ... Ratio of exports of goods and commercial services to imports of goods and commercial services (%) Brazil 89.2 130.6 117.0 103.7 103.5 95.6 97.3 92.9 86.2 Russia 187.6 159.1 137.6 142.9 138.7 137.7 139.8 132.8 (1) 126,2 India (2) 93.4 87.0 83.6 81.9 78.8 83.4 79.0 78.1 ... China 111.5 124.5 129.8 128.3 119.8 114.7 109.5 111.5 ... South Africa 111.9 92.5 92.0 92.1 96.9 99.4 97.9 90.3 ... Ratio of exports of goods to imports of goods (%) Brazil 98.7 150.9 133.2 114.3 119.8 111.1 113.2 108.7 101.1 Russia 234.1 182.3 155.3 161.5 161.6 159.8 161.8 157.3 (1) 153,6 India (2) 88.2 68.1 64.8 61.0 62.0 67.9 62.5 61.2 ... China 116.1 129.0 134.9 133.6 126.1 119.2 114.7 118.5 ... South Africa 117.2 93.9 93.7 95.2 100.4 104.7 102.2 91.5 ... Inflows of FDI (million US$) Brazil 32 779 18 822 34 585 45 058 25 949 48 506 66 660 65 272 64 045 Russia (6) 4 429 13 678 27 797 27 027 15 906 13 810 18 415 18 666 26 118 India (2) (7) 4 029 22 826 34 843 41 873 37 745 34 847 46 556 36 860 28 807 China (8) 40 715 63 021 74 768 92 395 90 033 105 735 116 011 111 716 117 586 South Africa (9) 888 -527 5 687 9 017 5 389 1 228 6 011 4 839 ... Outflows of FDI (million US$) Brazil 2 282 28 202 7 067 20 457 10 084 -11 588 1 029 2 821 3 496 Russia (6) 382 3 208 9 179 21 818 17 454 10 271 19 040 17 426 76 265 India (2) (7) 759 15 046 18 835 19 365 15 144 17 195 11 097 7 134 ... China (8) (10) ... 17 634 26 506 55 907 56 529 68 811 74 654 87 804 ... South Africa -271 -6 594 -2 962 3 137 -1 156 -450 257 -2 364 ... Annual average exchange rates Brazil (R$ per US$) 1.8 2.2 2.0 1.8 2.0 1.8 1.7 2.0 2.2 Russia (RUB per US$) 28.1 27.2 25.6 24.8 31.7 30.4 29.4 31.1 31.8 India (RS. per US$) (2) 45.7 45.2 40.2 46.0 47.4 45.6 48.1 54.0 ... China (RMB per US$) 8.3 8.0 7.6 6.9 6.8 6.8 6.5 6.3 6.2 South Africa (ZAR per US$) 6.9 6.8 7.1 8.3 8.4 7.3 ... ... ... Year-end exchange rates Brazil (R$ per US$) 2.0 2.1 1.8 2.3 1.7 1.7 ... ... ... Russia (RUB per US$) 28.2 26.3 24.6 29.4 30.2 30.5 32.2 30.4 ... India (RS. per US$) (2) 46.6 43.6 40.0 51.0 45.1 44.7 51.2 54.4 ... China (RMB per US$) 8.3 7.8 7.3 6.8 6.8 6.6 6.3 6.3 6.1 South Africa (ZAR per US$) 6.9 6.8 7.1 8.3 8.4 7.3 7.3 8.2 ... Foreign exchange reserves (million US$) Brazil (12) 33 011 85 839 180 334 193 783 238 520 288 575 352 012 373 147 358 808 Russia 24 263 295 277 466 376 410 695 405 825 432 949 441 162 473 110 ... India (2) 42 281 199 179 309 723 251 985 279 057 304 818 294 398 292 046 .... China 165 574 1 066 340 1 528 249 1 946 030 2 399 152 2 847 338 3 181 148 3 311 589 3 821 315 South Africa 7 534 25 613 32 979 34 099 39 706 43 834 48 860 50 735 ... Share of external debts to GDP (%) Brazil 33.6 15.9 14.1 12.1 12.2 12.0 12.0 13.9 13.9 Russia (13) ... 34.3 30.6 34.2 34.2 36.4 32.2 31.2 31.3 India (2) (14) 22.0 16.8 17.5 18.0 20.3 18.2 18.2 20.5 21.8 China ... 12.2 10.7 8.5 8.6 9.1 9.3 8.9 ... South Africa 27.8 22.7 26.4 26.6 27.5 28.8 28.1 34.2 ... International investment position (million US$) Brazil ... -364 540 -536 106 -281 795 -597 102 -890 447 -764 443 -825 637 -758 195 Russia (13) ... -31 566 -38 793 -150 600 254 788 103 430 16 340 137 956 ... India (2) (15) -76 848 -59 999 -62 445 -51 179 -66 600 -159 125 -203 609 -244 829 ... China ... 640 208 1 188 115 1 493 816 1 490 516 1 688 032 1 688 416 1 736 425 ... South Africa -6 790 -41 049 -68 621 -9 694 -37 461 -67 747 -24 963 ... ... Sources
Brazil
a) Central Bank of Brazil.
b) Ministry of Development, Industry and Foreign Trade.Russia
a) Federal State Statistics Service of the Russian Federation.
b) Bank of Russia.
c) International Monetary Fund.India
a) Ministry of Commerce & Industry, Department of Commerce, Export Import Data Bank; and Department of Industrial Policy and Promotion, FDI Statistics (various issues).
b) Reserve Bank of India, HandBook of Statistics on Indian Economy.
c) Ministry of Finance, Report on India's External Debt (various issues).China
a) State Administration of Foreign Exchange.
b) Ministry of Commerce of the People's Republic of China.South Africa
South African Reserve Bank.Footnotes
Brazil
(12) Cash concept.Russia
(1) Data refer to January-September of 2013.
(4) Prelimenary data.
(6) According to organizations that have provided statistical reports (excluding monetary authorities, commercial banks), including Ruble proceeds converted into US dollars.
(13) At the beginning of the year.India
(2) All information in case of India pertains to financial year (i.e.from April 1 of the year mentioned in the table to March of next year) /end of financial year (March of the year mentioned in the table).
(5) GDP estimates used are at Current Market Prices.
(7) Information since 2009-10 is provisional and that for 2013 is upto January 2014 only. FDI Inflow figures are gross inflows/investments.
(14) Information As on March end 2013 is partially revised.
(15) Information since 2009 is partially revised.China
(3) Data of imports and exports of goods and commercial services come from the State Administration of Foreign Exchange.
(8) Data of FDI come from the Ministry of Commerce of the People's Republic of China.
(10) Outflows of FDI from 2003 to 2006 did not include financial intermediation, data for 2007 and on included all sectors.South Africa
(9) These indicate on a net basis an increase in liabilities and a decrease in assets.
(11) These indicate on a net basis a decrease in liabilities and an increase in assets.
Table 14.2.1 - Selected Data on Merchandise Trade - Brazil - 2000/2013 (million US$)
2000 2005 2006 2007 2008 2009 2010 2011 2012 2013 Import from major trade partners (1) 55 851 73 600 91 351 120 617 172 985 127 722 181 649 226 245 223 183 239 621 United States of America 12 899 12 667 14 657 18 723 25 628 20 032 27 039 33 964 32 363 36 004 China 1 222 5 355 7 990 12 621 20 044 15 911 25 593 32 788 34 251 37 303 Argentina 6 843 6 241 8 053 10 404 13 258 11 281 14 426 16 906 16 444 16 463 Germany 4 428 6 144 6 503 8 669 12 027 9 869 12 552 15 212 14 212 15 182 Japan 2 961 3 405 3 840 4 609 6 807 5 368 6 982 7 871 7 735 7 082 Republic of Korea 1 437 2 327 3 106 3 391 5 413 4 818 8 422 10 096 9 099 9 491 Nigeria 734 2 643 3 918 5 281 6 704 4 760 5 920 8 386 8 012 9 648 Italy 2 167 2 276 2 570 3 348 4 613 3 665 4 838 6 222 6 202 6 719 France 1 880 2 700 2 838 3 525 4 678 3 615 4 800 5 461 5 910 6 498 Mexico 754 844 1 310 1 979 3 125 2 783 3 858 5 130 6 075 5 795 Export to major trade partners (1) 55 119 118 529 137 807 160 649 197 942 152 995 201 915 256 039 242 578 242 179 China 1 853 4 435 5 750 7 114 11 054 10 582 21 354 44 314 41 228 46 026 United States of America 159 4 164 6 894 8 905 13 683 9 351 16 293 25 804 26 701 24 653 Argentina 2 185 5 341 5 660 6 703 10 944 11 413 11 035 22 709 17 998 19 615 Netherland 761 2 382 3 936 1 971 3 650 5 979 9 307 13 639 15 041 17 333 Germany 1 195 2 862 3 198 3 444 5 485 2 665 7 558 9 039 7 277 6 552 Japan 1 559 2 516 2 928 3 378 4 131 3 761 5 182 9 473 7 956 7 964 United Kingdom 1 648 2 864 2 419 2 956 4 360 4 592 4 673 5 202 4 460 4 067 Venezuela 1 526 1 976 2 429 2 945 3 774 3 073 4 430 4 591 5 056 4 850 India 445 2 227 1 979 2 775 3 612 2 886 3 531 3 200 5 577 3 130 Belgium 438 1 537 2 231 1 971 1 833 2 399 3 455 3 959 3 742 3 594 Import by principal commodities (1) 55 851 73 600 91 351 120 617 172 985 127 722 181 649 226 245 223 183 239 621 Crude oil 3 190 7 667 9 081 11 989 16 389 9 186 10 097 14 080 13 412 16 321 "Diesel" (diesel Oil) 1 251 1 022 1 748 3 023 5 142 1 673 5 131 7 421 6 574 8 285 Auto engine explosion, 1500 < CM3 < = 3000, up to 6 passengers 808 469 1 348 2 028 3 096 3 338 4 928 6 977 5 845 5 365 Naphtha for petrochemicals 727 1 377 1 726 1 886 2 173 1 536 3 246 4 788 4 193 4 659 Other parts for television and radio broadcasting receivers, etc. 274 254 527 654 1 416 939 2 695 3 053 3 033 3 233 Other potassium chloride 561 956 950 1 500 3 828 2 061 2 204 3 503 3 510 3 319 Bituminous coal, not agglomerated 100 198 259 222 418 1 362 2 150 3 351 2 347 1 951 Natural gas in gaseous state 114 810 1 314 1 497 2 715 1 591 2 132 2 733 3 336 3 878 Refined copper cathodes/Its elements, raw 286 593 1 195 1 619 1 902 1 004 1 885 2 049 2 103 1 815 Wheat (excludes durum or seeding), and wheat with rye 855 647 988 1 389 1 872 1 206 1 521 1 832 1 757 2 415 Export by principal commodities 55 119 118 529 137 807 160 649 197 942 152 995 201 915 256 0339 242 578 242 179 Non-agglomerated iron ores and concentrates 1 853 4 435 5 750 7 114 11 054 10 582 21 354 31 851 23 810 25 996 Crude oil 159 4 164 6 894 8 905 13 683 9 351 16 293 21 603 20 306 12 957 Other soya beans, whether or not broken 2 185 5 341 5 660 6 703 10 944 11 413 11 035 16 312 17 455 22 812 Raw cane sugar 761 2 382 3 936 1 971 3 650 5 979 9 307 11 548 10 030 9 164 Agglomerated iron ores and concentrates 1 195 2 862 3 198 3 444 5 485 2 665 7 558 9 965 7 179 6 495 Coffee, not roasted, not decaffeinated beans 1 559 2 516 2 928 3 378 4 131 3 761 5 182 7 999 5 722 4 582 Marc other solid waste from the extraction of soybean oil 1 648 2 864 2 419 2 956 4 360 4 592 4 673 5 544 6 246 6 101 Chemical wood pulp 1 526 1 976 2 429 2 945 3 774 3 073 4 430 5 001 4 700 5 179 Cuts and edible offal of fowls, frozen 445 2 227 1 979 2 775 3 612 2 886 3 531 4 454 4 272 4 199 Other sugar cane, beet, sucrose chemistry 438 1 537 2 231 1 971 1 833 2 399 3 455 3 391 2 814 2 678 Source
Ministry of Development, Industry and Foreign Trade.Footnotes
Value is at FOB.
(1) Trade data are only for goods and exclude services.
Table 14.2.2 - Selected Data on Merchandise Trade - Russia - 2000/2013 (million US$)
2000 2006 2007 2008 2009 2010 2011 2012 2013 Import from major trade partners Germany 3 898 18 464 26 534 34 115 21 229 26 699 37 682 38 305 37 916 Netherlands 740 2 685 3 857 4 817 3 590 4 442 5 925 5 977 5 846 China 949 12 910 24 424 34 780 22 795 38 964 48 202 51 628 53 211 Italy 1 212 5 726 8 537 11 002 7 891 10 043 13 402 13 432 14 554 Turkey 349 2 753 4 179 6 146 3 216 4 867 6 360 6 860 7 256 USA 2 694 6 405 9 471 13 790 9 170 11 097 14 584 15 366 16 537 France 1 187 5 863 7 766 10 015 8 431 10 043 13 276 13 804 13 012 India 557 968 1 310 1 707 1 525 2 143 2 787 3 041 3 091 Brazil 388 2 987 4 109 4 372 3 478 4 067 4 389 3 359 3 493 South Africa 41 159 270 444 321 473 465 686 782 Export to major trade partners Germany 9 232 24 498 26 346 33 164 18 710 25 662 34 158 34 995 37 028 Netherlands 4 349 35 884 42 879 56 973 36 407 53 974 62 695 76 886 70 126 China 5 248 15 758 15 895 21 142 16 687 20 326 35 030 35 766 35 631 Italy 7 254 25 090 27 530 41 999 25 100 27 476 32 658 32 301 39 314 Turkey 3 098 14 290 18 534 27 655 16 377 20 317 25 350 27 419 25 500 USA 4 644 8 638 8 335 13 357 9 132 92 320 16 425 12 867 11 196 France 1 903 7 675 8 684 12 201 8 726 12 420 14 859 10 535 9 203 India 1 082 2 925 4 012 5 230 5 936 6 392 6 080 7 563 6 886 Brazil 259 726 1 130 2 041 1 083 1 798 2 125 2 305 1 985 South Africa 34 20 14 40 195 46 115 279 290 Imports by principal commodities (1) Fresh and frozen meats (including poultry meats) 967 4 229 4 703 6 611 5 823 5 665 6 034 6 289 5 890 Medicines 1 150 5 331 5 550 7 512 7 136 9 346 10 964 10 780 11 804 Passenger cars 448 12 721 21 333 30 262 8 511 11 377 20 041 20 220 16 997 Exports by principal commodities (1) Crude oil 25 284 102 283 121 503 161 147 100 593 134 757 181 757 180 930 173 668 Petroleum products 10 938 44 377 52 228 79 870 48 144 70 085 96 033 103 624 109 168 Natural gas 16 644 43 806 44 837 69 107 41 971 47 579 64 144 61 768 67 232 Source
Federal Customs Service of Russia.Footnote
(1) By the data of the Federal Customs Service of Russia, including data on foreign trade with the Republic of Belarus and the Republic of Kazakhstan. Data for 2010 are given excluding data of mutual trade between Russia and the Republic of Kazakhstan in July-December 2010 in connection with the abolition of customs clearance of products on the Russian-Kazakhstan border.
Table 14.2.2.1 - Selected Data on Merchandise Trade - Russia - 2013 (million US$)
Commodities Brazil India China South Africa All countries (1) Import Total 3 493.1 3 091.1 53 211.5 782.1 317 806.0 1. Fresh and frozen meat (including poultry) 1 951.9 - - - 5 890.2 2. Medicines 1.1 807.8 34.5 - 11 804.2 3. Pipes, iron 0.1 3.4 398.0 0.0 1 570.8 4. Internal combustion engines 39.4 9.6 691.3 0.1 3 829.9 5. Pumps and compressors 6.7 27.2 716.0 2.9 4 670.1 6. Computing machines and their parts 0.1 2.9 3 177.7 0.0 5 035.7 7. Machinery and mechanical devices having individual functions 1.5 11.3 279.1 2.0 2 689.8 8. Apparatus for telephone and telegraph communications 1.1 268.2 4 690.0 0.0 7 705.8 9. Passenger cars - 0.0 239.6 1.7 16 997.4 10. Parts and accessories of motor vehicles 17.7 84.0 1 323.8 10.8 11 488.3 Exports Total 1 984.9 6 885.6 35 630.5 289.9 526 392.0 1. Wheat and meslin - - - 124.4 3 482.7 2. Hard coal 16.9 52.6 2 243.3 - 11 821.2 3. Crude oil - - 18 564.8 - 173 668.3 4. Petroleum products 149.3 62.1 4 136.7 54.3 109 167.9 5. Natural gas - - - - 67 232.3 6. Mineral mixed fertilizers 452.5 9.7 231.4 32.5 3 570.8 7. Semi-finished products from carbon steel - 0.0 - - 6 474.6 8. Flat-rolled products from iron and steel 115.6 87.4 3.8 0.3 5 170.7 9. Crude nickel - - - - 3 626.4 10. Crude aluminum 2.1 3.7 79.9 4.2 6 193.3 Source
Federal Customs Service of Russia.Footnote
(1) Including trade with the Republic of Belarus and the Republic of Kazakhstan.
Table 14.2.3.1 - Selected Data on Merchandise Trade: Major Trade Partners - India - 2012-2013 (million US$)
Countries Import Countries Export China 52 248 China 13 535 Germany 14 326 Germany 7 246 Indonesia 14 879 Hong Kong 12 279 Iraq 19 247 Japan 6 100 Kuwait 16 588 Netherlands 10 565 Qatar 15 693 Saudi Arabia 9 786 Saudi Arabia 33 998 Singapore 13 619 Switzerland 32 167 United Arab Emirates 36 317 United Arab Emirates 39 138 United Kingdom 8 613 United States of America 25 205 United States of America 36 155 Source
Ministry of Commerce & Industry , Export Import Data Bank.
Table 14.2.3.2 - Selected Data on Merchandise Trade: BRICS Countries - India - 2000/2012 (million US$)
2000 2005 2006 2007 2008 2009 2010 2011 2012 Import Brazil ... 893 992 950 1 186 3 438 3 549 4 271 4 826 Russia 518 2 022 2 409 2 478 4 328 3 567 3 600 4 764 4 232 China 1 502 10 869 17 475 27 146 32 497 30 824 43 480 55 314 52 248 South Africa 1 022 2 472 2 470 3 605 5 514 5 675 7 141 10 972 8 888 Export Brazil ... 1 091 1 449 2 526 2 651 2 414 4 024 5 770 6 049 Russia 889 733 904 941 1 096 981 1 698 1 778 2 296 China 831 6 759 8 322 10 871 9 354 11 618 15 483 18 077 13 535 South Africa 311 1 527 2 242 2 661 1 980 2 059 3 912 4 731 5 107 Source
Ministry of Commerce and Industry, Export Import Data Bank.
Table 14.2.3.3 - Selected Data on Merchandise Trade - India - 2000/2013 (million US$)
2000-2001 2005-2006 2006-2007 2007-2008 2008-2009 2009-2010 2010-2011 2011-2012 2012-2013 Export by principal commodities Articles of apparel and clothing accressories, knitted or corcheted 1 786.9 3 191.1 3 617.7 4 272.9 5 048.1 4 591.1 4 768.0 5 777.0 5 554.0 Articles of apparel and clothing accressories, not knitted orcorcheted 3 790.5 5 435.5 5 292.7 5 420.4 5 902.9 6 127.8 6 449.0 7 961.0 7 408.0 Electrical machinery and equipment and parts thereof; sound recorders and reproducers, television image and sound recorders and reproducers, and parts 1 292.5 2 767.5 4 110.9 5 355.2 9 541.1 7 233.2 10 839.0 11 528.0 10 863.0 Ores, slag and ash 460.3 4 452.6 4 896.3 7003.5 5 456.2 6 651.9 5 818.0 5 425.0 2 383.0 Plastic and artecles thereof 700.9 2 160.5 2 741.3 2 789.8 2 543.5 2 753.6 3 948.0 5 302.0 5 150.0 Residues and waste from the food industries; prepared animal fodder 462.0 1 122.9 1 251.6 2 081.0 2 323.2 1 753.3 2 461.0 2 527.0 3 236.0 Ships boats and floating structures 52.3 935.6 1 035.8 1 748.6 3 715.6 2 554.3 5 274.0 8 096.0 3 838.0 Vehicles other than railway or tramway rolling stock, and parts and accessories thereof 932.8 3 293.3 3 766.1 4 484.1 6 002.0 6 169.5 11 301.0 10 931.0 12 193.0 Pharmaceutical products 945.1 2 444.2 3 184.0 4 159.4 5 078.8 5 191.2 6 543.0 8 483.0 10 063.0 Miscellaneous goods 34 137.0 77 288.0 96 518.0 125 817.0 139 684.0 135 743.0 193 735.0 239 932.0 239 712.0 Import by principal commodities Nuclear reactors boilers, machinery and mechanical appliences; parts thereof 4 236.8 13 915.0 18 628.0 25 344.0 26 641.0 23 990.0 29 007.2 37 552.0 35 236.0 Iron and steel 956.5 5 446.0 6 143.0 9 090.0 10 265.0 8 814.0 11 010.0 13 646.0 13 616.0 Articles of iron or steel 306.1 1 308.0 2 535.0 3 302.0 3 667.0 2 793.0 3 617.0 4 529.0 4 101.0 Organic chemicals 1 599.6 5 144.0 6 037.0 8 116.0 8 608.0 9 407.0 12 640.0 14 443.0 15 702.0 Fertilizers 444.9 1 677.0 2 668.0 4 610.0 12 011.0 5 992.0 6 182.0 9 221.0 7 413.0 Plastic and articles thereof 657.0 2 556.0 2 957.0 4 117.0 4 482.0 5 515.0 7 571.0 8 446.0 9 611.0 Mineral fuels, mineral oils and products of there distillation; bituminus substances; mineral waxes 17 545.0 50 310.0 61 779.0 86 384.0 103 934.0 96 321.0 115 929.0 172 754.0 181 345.0 Electrical machinery and equipment and parts thereof; sound recorders and reproducers, television image and sound recorders and reproducers, and parts 2 677.6 11 899.0 14 575.0 20 091.0 25 205.0 22 074.0 27 211.0 32 865.0 29 820.0 Natural or cultured pearls, precious or semiprecious stones; pre metals, clad with premetal and articles thereof; IMIT; jewlry; coin 9 707.4 20 691.0 22 615.0 26 291.0 43 926.0 46 322.0 77 054.0 91 075.0 83 896.0 Source
Ministry of Commerce & Industry , Export Import Data Bank.
Table 14.2.4.1 - Selected Data on Merchandise Trade - China - 2000/2013 (million US$)
2000 2005 2006 2007 2008 2009 2010 2011 2012 2013(1) Import from major trade partners Hong Kong, China 9 429 12 225 10 780 12 804 12 916 8 703 12 260 15 492 17 880 16 215 India 1 353 9 766 10 277 14 617 20 259 13 727 20 846 23 371 18 796 17 028 Japan 41 510 100 408 115 673 133 942 150 600 130 915 176 736 194 564 177 834 162 278 Korea, Rep. 23 207 76 820 89 724 103 752 112 138 102 545 138 349 162 706 168 738 183 073 Taiwan, China 25 494 74 680 87 099 101 027 103 338 85 720 115 739 124 909 132 204 156 637 South Africa 1 037 3 443 4 085 6 618 9 235 8 712 14 903 32 108 44 671 48 319 Germany 10 409 30 723 37 879 45 383 55 790 55 719 74 261 92 744 91 921 94 204 Russia 5 770 15 890 17 554 19 689 23 833 21 233 25 921 40 370 44 155 39 618 Brazil 1 621 9 993 12 909 18 342 29 863 28 277 38 125 52 394 52 329 54 086 United States of America 22 363 48 622 59 211 69 391 81 360 77 460 102 099 122 129 132 897 152 575 Australia 5 024 16 194 19 323 25 840 37 435 39 488 61 122 82 673 84 618 98 818 ASEAN 22 181 74 994 89 527 108 386 117 003 106 749 154 701 193 018 195 892 199 540 European Union 30 845 73 580 90 319 110 935 132 634 127 692 168 370 211 158 212 078 220 055 Export to major trade partners Hong Kong, China 44 518 124 473 155 309 184 436 190 729 166 229 218 302 267 983 323 431 384 792 India 1 561 8 934 14 581 24 011 31 585 29 656 40 915 50 537 47 678 48 443 Japan 41 654 83 986 91 623 102 009 116 132 97 868 121 043 148 270 151 622 150 275 Korea, Rep. 11 292 35 108 44 522 56 099 73 932 53 670 68 766 82 920 87 678 91 176 Taiwan, China 5 039 16 550 20 733 23 460 25 877 20 501 29 674 35 109 36 777 40 644 South Africa 1 014 3 826 5 768 7 428 8 618 7 366 10 800 13 362 15 323 16 831 Germany 9 278 32 527 40 315 48 714 59 209 49 916 68 047 76 400 69 210 67 348 Russia 2 233 13 211 15 832 28 466 33 076 17 519 29 612 38 904 44 056 49 595 Brazil 1 224 4 827 7 380 11 372 18 807 14 119 24 461 31 837 33 420 36 192 United States 52 099 162 891 203 448 232 677 252 384 220 802 283 287 324 453 351 777 368 427 Australia 3 429 11 062 13 625 17 990 22 247 20 642 27 220 33 910 37 728 37 560 ASEAN 17 341 55 367 71 311 94 147 114 317 106 257 138 160 170 071 204 255 244 070 European Union 38 192 143 704 181 980 245 178 293 148 236 197 311 219 355 975 333 959 338 985 Exports by principal commodities Mechanical and electrical products 105 313 426 747 549 402 701 171 822 930 713 113 933 434 1 085 589 1 179 338 1 265 527 High and new-technology products 37 043 21 248 281 425 347 825 415 611 376 909 492 414 548 788 601 164 660 330 Rolled steel 2 229 13 080 26 230 44 133 63 442 22 272 36 819 51 266 51 487 53 235 Automatic data processing machines components 10 994 76 307 93 018 123 715 135 019 122 360 163 953 176 285 185 321 182 175 Parts for automatic data processing equipments 5 583 28 356 32 619 32 294 31 371 25 728 30 688 29 930 29 623 28 600 Telephone sets (2) 1 693 2 123 2 842 38 761 41 491 41 537 48 927 64 805 82 987 97 169 Ships 1 497 4 578 8 006 11 944 19 123 27 095 39 203 41 805 36 111 26 253 Furniture 3 565 13 504 17 129 22 146 26 911 25 329 32 986 37 942 48 817 51 826 Garments (excluding knitwear and crochet) 17 478 32 432 39 657 43 644 46 763 42 654 49 169 57 366 55 021 61 009 Garments, knitted or crocheted 12 454 27 878 41 220 56 871 54 556 48 068 59 700 71 518 77 954 86 897 Imports by principal commodities Mechanical and electrical products 102 872 350 378 427 728 498 984 538 656 491 420 660 313 753 289 782 627 840 080 High and new-technology products 52 503 197 708 247 309 286 986 341 941 309 843 412 673 462 992 507 078 558 193 Soybean 2 270 7 779 7 489 11 472 21 813 18 787 25 081 29 834 34 990 37 985 Iron ore 1 858 18 373 20 913 33 796 60 532 50 140 79 427 112 407 95 740 105 728 Crude oil 14 861 47 723 66 411 79 771 129 335 89 256 135 151 196 664 220 800 219 654 Petroleum products refined 3 657 10 435 15 549 16 437 30 044 16 984 22 343 32 699 33 072 31 931 Rolled steel 8 536 24 608 19 827 20 553 23 433 19 480 20 112 21 576 17 805 17 049 Motor vehicles and chassis 1 193 5 115 7 526 10 956 15 173 15 403 30 665 43 183 47 569 48 861 Automatic data processing machines and components 4 516 18 021 19 925 22 397 25 402 23 774 29 281 31 675 36 938 30 829 Parts for automatic data processing equipments 5 367 15 686 18 180 16 839 14 978 13 124 18 656 16 706 17 250 16 944 Sources
General Administration of Customs of the People's Republic of China.Footnotes
(1) Preliminary data.
(2) From 2007 Telephone Sets include Wireless Telephone and Handsets (including Installed in the vehicle).
Table 14.2.4.2 - Top 10 Commodities Exported to BRICS Countries - China - 2013
Brazil
India
Commodity
Value(1)
Commodity
Value(1)
million US$ Variation
(%) (2)million US$ Variation
(%) (2)1. Mechanical and electrical products 21 497 6.4 1. Mechanical and electrical products 25 858 -1.4 2. Hi-tech products 8 605 6.4 2. Hi-tech products 12 177 9.7 3. Textile yarn, fabrics and made-up articles 2 370 7.6 3. Automatic data processing machines and units 3 250 13.6 4. Garments and clothing accessories 1 746 15.0 4. Textile yarn, fabrics and made-up articles 2 934 9.6 5. Liquid crystal display panel 1 412 -4.7 5. Fertilizer 1 907 -35.7 6. Products of steel or iron 1 291 26.0 6. Products of steel or iron 1 693 -25.4 7. Automatic data processing machines and units 893 -5.6 7. Telephone sets 1 450 38.4 8. Agriculture products 857 25.2 8. Medical and pharmaceutical products 1 268 4.3 9. Suit-case,hand bags and similar containers 660 5.7 9. Garments and clothing accessories 845 61.8 10. Parts for use with apparatus of TV sets, radio sets and wireless telecommunications equipments 650 3.6 10. Diodes and similar semiconductors 733 109.9 Russia
South Africa
Commodity
Value(1)
Commodity
Value(1)
million US$ Variation
(%) (2)million US$ Variation
(%) (2)1. Mechanical and electrical products 22 621 2.4 1. Mechanical and electrical products 7 782 17.6 2. Garments and clothing accessories 9 267 45.4 2. Hi-tech products 2 496 39.4 3. Hi-tech products 6 406 -4.7 3. Garments and clothing accessories 1 926 1.0 4. Textile yarn, fabrics and made-up articles 153 13.8 4. Textile yarn, fabrics and made-up articles 987 1.1 5. Footwear and parts thereof 3 131 20.4 5. Footwear and parts thereof 854 -17.7 6. Agriculture products 2 100 8.2 6. Furniture and parts 821 11.3 7. Automatic data processing machines and units 2 043 -22.6 7. Automatic data processing machines and units 662 4.3 8. Telephone sets 1 302 49.2 8. Products of steel or iron 493 30.4 9. Products of steel or iron 1 104 12.6 9. Diodes and similar semiconductors 486 1 045.4 10. Auto parts and accessories 1 098 5.0 10. Solar cells 456 1 101.0 Source
General Administration of Customs of the People's Republic of China.Footnotes
(1) Preliminary data.
(2) From previous year.
Table 14.2.4.3 - Top 10 Commodities Imported from BRICS Countries - China - 2013
Brazil
India
Commodity
Value(1)
Commodity
Value(1)
million US$ Variation
(%) (2)million US$ Variation
(%) (2)1. Agriculture products 22 505 20.4 1. Agriculture products 3 295 -19.8 2. Iron ores and concentrates 21 424 -5.6 2. Cotton 2 240 -26.1 3. Grainfood 19 122 34.0 3. Textile yarn, fabrics and made-up articles 2 132 92.2 4. Crude petroleum oil 3 803 -18.6 4. Unwrought copper and copper products 1 872 -13.7 5. Pulp 1 764 8.5 5. Diamonds 1 710 36.6 6. Sugar 1 433 26.6 6. Iron ores and concentrates 1 469 -60.0 7. Mechanical and electrical products 755 -50.6 7. Mechanical and electrical products 1 316 9.0 8. Bovine or equine leather 698 19.4 8. Plastics in primary forms 540 -8.9 9. Edible vegetable oils 506 -56.1 9. Hi-tech products 454 -1.6 10. Cotton 326 -60.0 10. Xylenes 277 -17.2 Russia
South Africa
Commodity
Value(1)
Commodity
Value(1)
million US$ Variation
(%) (2)million US$ Variation
(%) (2)1. Crude petroleum oil 19 740 -3.6 1. Iron ores and concentrates 6 024 8.6 2. Refined petroleum products 4 098 -33.5 2. Diamonds 2 407 75.2 3. Coal and lignite 2 781 15.8 3. Chromium ore and concentrates 1 153 30.7 4. Agriculture products 1 570 0.9 4. Coal and lignite 1 097 -30.1 5. Iron ores and concentrates 1 413 -20.4 5. Manganese ores and concentrates 916 61.4 6. Wood in the rough 1 408 -9.9 6. Agriculture products 498 17.1 7. Wood sawn length wise,sliced/peeled 1 362 6.1 7. Mechanical and electrical products 420 62.7 8. Frozen fish 1 303 1.6 8. Waste and scrap of metals 217 15.6 9. Fertilizer 1 206 -27.9 9. Wool 189 9.7 10. Pulp 589 -17.4 10. Motor vehicles (incl.CDK and SDK) 185 87.2 Source
General Administration of Customs of the People's Republic of China.Footnotes
(1) Preliminary data.
(2) From previous year.
Table 14.2.5 - Selected Data on Merchandise Trade: BRICS Countries - South Africa - 2010 (million US$)
Commodities Brazil Russia India China All countries Import Natural or cultured pearls, precious or semi-precious 1 349 653 105 218 2 835 009 11 478 115 79 988 907 Stones, precious metals, metals clad with precious metal and articles thereof; imitation jewellery, coins 186 709 2 21 641 56 230 683 004 Mineral products 38 250 503 66 634 101 077 1 273 196 Base metals and articles of base metal 16 911 11 018 6 422 914 833 935 Vehicles, aircraft, vessels and associated transport equipment 112 666 48 71 937 114 584 2 036 677 Machinery and mechanical appliances, electrical equipment; parts thereof, sound recorders and reproducers, television image and sound recorders and reproducers, and parts and accessories of such articles 68 160 9 718 851 363 153 875 16 000 785 Products of the chemicals or allied industries 67 174 30 006 404 650 665 562 7 665 828 Vegetable products 34 011 5 485 98 498 507 409 3 252 115 Prepared foodstuffs, beverages, spirits, and vinegar; tobacco and manufactured tobacco substitutes 26 653 65 24 979 151 234 311 062 Pulp of wood or of other fibrous celluloisic material; waste and scrap of paper or of paperboard; paper and paperboard and articles thereof 17 471 461 1 220 53 564 301 292 Plastics and articles there of; rubber and articles thereof 24 153 275 25 845 119 988 1 293 405 Live animals, animal products 6 287 310 152 366 1 369 239 2 512 935 Miscellaneous manufactured articles 7 631 46 19 020 626 292 817 118 Textiles and textile articles 17 645 36 23 406 290 244 1 002 902 Optical, photographic, cinematographic, measuring, checking, precision, medical or surgical instruments and apparatus, clocks and watches, musical instruments; parts and accessories thereof 230 6 634 53 179 60 939 814 863 Wood and articles of wood, wood charcoal, cork and articles of cork, manufactures of straw, of esparto or of other plaiting material, basketware and wickerwork 61 367 29 231 193 337 826 504 3 749 293 Other unclassified goods 209 412 8 615 365 349 5 040 790 20 314 335 Articles of stone, plaster, cement, asbestos, mica or similar materials, ceramic products, glass and glassware 138 137 1 866 383 081 368 633 8 202 400 Raw hides and skins, leather, furskins and articles thereof; saddlery and harness, travel articles, handbags and similar containers; articles of animal gut (other than silkworm-gut) 6 671 892 19 208 212 846 2 188 443 Animal or vegetable fats and oils and their cleavage products; prepared edible fats; animal or vegetable waxes 1 303 452 Footwear, headgear, umbrellas, sun umbrellas, walking-sticks, seat-sticks, whips, riding-crops and parts thereof; prepared feathers and articles made there with, artificial flowers, articles of human hair 4 981 5 25 307 717 411 23 819 Works of art, collectors' pieces and antiques 9 0 397 1 841 5 182 740 Special classification provisions: original equipment components 19 2 1 227 591 181 875 Not allocated 305 107 25 944 38 348 43 430 Exports 714 624 283 130 2 970 265 8 104 279 80 604 467 Natural or cultured pearls, precious or semi-precious stones, precious metals, metals clad with precious metal and articles thereof; imitation jewellery, coins 1 356 118 70 069 248 273 20 822 200 Mineral products 2 807 51 763 2 015 253 5 780 285 17 289 474 Base metals and articles of base metal 18 033 353 233 1 364 162 12 587 162 Vehicles, aircraft, vessels and associated transport equipment 10 929 1 878 10 251 15 932 6 897 416 Machinery and mechanical appliances, electrical equipment; parts there of, sound recorders and reproducers, television image and sound recorders and reproducers, and parts and accessories of such articles 147 569 39 695 78 988 93 571 6 517 511 Products of the chemicals or allied industries 141 268 2 103 287 741 191 856 4 253 062 Vegetable products 54 856 145 167 5 723 9 813 2 898 575 Prepared foodstuffs, beverages, spirits, and vinegar; tobacco and manufactured tobacco substitutes 148 20 410 4 818 58 967 2 684 549 Pulp of wood or of other fibrous celluloisic material; waste and scrap of paper or of paperboard; paper and paperboard and articles thereof 61 327 55 748 99 665 1 485 604 Plastics and articles thereof; rubber and articles thereof 3 918 545 27 716 86 555 1 297 720 Live animals, animal products 1 537 378 58 19 013 713 305 Miscellaneous manufactured articles 802 35 640 441 669 863 Textiles and textile articles 5 188 1 938 33 786 91 785 611 845 Optical, photographic, cinematographic, measuring, checking, precision, medical or surgical instruments and apparatus, clocks and watches, musical instruments; parts and accessories thereof 313 180 6 267 4 420 403 940 Wood and articles of wood, wood charcoal, cork and articles of cork, manufactures of straw, of esparto or of other plaiting material, basketware and wickerwork 211 100 16 138 417 375 269 Other unclassified goods 121 433 172 340 167 Articles of stone, plaster, cement, asbestos, mica or similar materials, ceramic products, glass and glassware 8 299 59 18 346 2 975 282 283 Raw hides and skins, leather, furskins and articles thereof; saddlery and harness, travel articles, handbags and similar containers; articles of animal gut (other than silkworm-gut) 2 430 290 1 019 31 153 208 976 Animal or vegetable fats and oils and their cleavage products; prepared edible fats; animal or vegetable waxes 1 4 502 175 619 Footwear, headgear, umbrellas, sun umbrellas, walking-sticks, seat-sticks, whips, riding-crops and parts there of; prepared feathers and articles made there with, artificial flowers, articles of human hair 213 5 24 228 47 508 Works of art, collectors' pieces and antiques 167 190 273 265 39 935 Special classification provisions: original equipment components 233 2 2 484 Source
South African Revenue Services.
Table 14.3.1 - Selected Data on Foreign Direct Investment - FDI - Brazil - 2000/2013 (million US$)
FDI inflow by source
2000 2006 2007 2008 2009 2010 2011 2012 2013 Netherlands 2 228 3 506 8 129 4 639 6 515 6 702 17 582 12 213 10 511 United States 5 398 4 522 6 073 7 047 4 902 6 144 8 909 12 310 9 021 Spain 9 592 1 564 2 202 3 851 3 424 1 524 8 593 2 523 2 246 Germany 374 867 1 801 1 086 2 473 538 1 125 826 1 011 Canada 192 1 287 819 1 442 1 372 751 1 789 1 950 1 215 Portugal 2 514 347 517 1 051 684 1 203 491 551 596 France 1 909 763 1 233 2 880 2 141 3 479 3 086 2 155 1 489 Switzerland 306 1 659 905 803 380 6 445 1 194 4 333 2 333 Japan 384 660 501 4 099 1 673 2 502 7 536 1 471 2 516 Argentina 112 126 70 127 80 100 97 262 82 Mexico 224 782 409 220 167 143 297 386 534 Chile 29 27 717 264 1 027 941 830 2 013 2 963 India ... 18 28 20 16 25 11 25 28 China ... 7 24 38 83 395 179 185 110 South Africa ... 10 2 5 3 4 33 11 25 Venezuela ... 13 18 10 9 4 9 25 11 Ecuador ... 2 5 5 3 2 3 6 3 Colombia ... 232 167 54 152 188 47 156 69 Russia ... 1 1 3 2 7 2 3 3 Luxembourg ... 746 2 857 5 937 537 8 819 1 867 5 965 5 067 United Kingdom ... 426 1 053 693 1 032 1 030 2 749 1 978 1 203 Italy ... 254 313 385 232 300 457 986 902 Bahamas ... 65 603 1 101 52 109 96 138 562 South Korea ... 110 265 628 132 1 045 1 075 875 544 Belgium ... 278 91 78 93 75 420 656 473 Cayman Islands ... 1 974 1 604 1 556 1 092 406 612 619 176 Bermudas ... 515 1 497 1 038 380 854 800 151 169 British Virgin Islands ... 286 371 1 048 403 1 059 1 138 857 265 Norway ... 369 284 207 671 1 540 1 073 936 405 Australia ... 117 494 1 154 707 556 1 079 518 329 Austria ... 16 116 93 48 3 420 1 508 108 89 Bahamas ... 65 603 1 101 52 109 96 138 562 Uruguay ... 237 212 424 198 275 301 567 130 Hong Kong ... 101 13 35 34 83 2 077 508 136 Sweden ... 20 64 55 214 387 467 476 408 Denmark ... 97 122 171 47 295 151 486 338 Panama ... 140 141 96 132 132 248 228 312 Singapore ... 79 24 91 91 38 252 999 271 Other countries ... 439 0 921 728 955 1 248 1 952 2 236 Source
Central Bank of Brazil.Footnote
1. Includes FDI - Equity gross inflows and excludes FDI - Other capital.
Table 14.3.2 - Selected Data on Foreign Direct Investment - FDI - Russia - 2000/2013 (million US$)
2000 2006 2007 2008 2009 2010 2011 2012 2013 FDI inflow by source 4 429 13 678.0 27 797.0 27 027.0 15 906.0 13 810.0 18 415.0 18 666.0 26 118.0 Cyprus 678.0 3 788 6 280 6 542 3 704 3 451 4 706.0 5 844.0 9 763.0 Germany 341.0 634.0 1 123 3 560 2 313 2 582 1 732.0 1 768.0 3 974.0 Netherlands 610.0 3 900 13 669.0 5 496 1 441 1 516 3 308.0 1 551.0 3 102.0 France 97.0 343.0 663.0 879.0 758.0 960.0 776.0 1 242.0 758.0 United Kingdom 262.0 563.0 515.0 1 210 542.0 584.0 311.0 755.0 643.0 Republic of Korea 7.0 78.0 47.0 226.0 494.0 520.0 281.0 312.0 169.0 India 0.0 352.0 226.0 312.0 396.0 512.0 612.0 488.0 488.0 Finland 87.0 162.0 506.0 763.0 676.0 389.0 608.0 505.0 720.0 Austria 22.0 286.0 360.0 1 144 440.0 371.0 853.0 952.0 886.0 Virgin Islands (British) 65.0 979.0 658.0 2 002 703.0 307.0 1 442.0 971.0 410.0 Brazil 0.4 1.0 0.0 China 3.0 106.0 229.0 110.0 301.0 121.0 591.0 212.0 254.0 South Africa 0.0 5.0 0.2 0.0 1.0 0.1 0.6 2.0 FDI outflows by destination 382.0 3 208 9 179 21 818.0 17 454.0 10 271.0 19 040.0 17 426.0 76 265.0 Netherlands 157.0 6 728 6 642 10 023 6 492 9 363.0 6 785.0 7 281.0 Cyprus 1 203 482.0 8 664 3 514 1 262 2 284.0 4 409.0 5 154.0 Belarus 77.0 1.0 634.0 665.0 658.0 675.0 2 510.0 70.0 4.0 Switzerland 25.0 3.0 1 014.0 592.0 496.0 419.0 186.0 20.0 United States of America 192.0 550.0 3 678 856.0 235.0 479.0 191.0 87.0 Ukraine 10.0 9.0 15.0 9.0 26.0 213.0 21.0 38.0 48.0 Germany 0.0 137.0 70.0 277.0 79.0 186.0 147.0 25.0 38.0 Virgin Islands (British) 0.0 38.0 7.0 69.0 30.0 152.0 175.0 355.0 53 918.0 Italy 0.0 0.0 63.0 3.0 112.0 - 28.0 Turkey 0.1 1.0 104.0 77.0 48.0 81.0 502.0 0.0 936.0 India 0.0 0.0 0.0 1.0 0.1 China 0.6 4.0 2.0 12.0 0.0 0.0 7.0 43.0 36.0 Brazil 0.2 - South Africa - - Source
Federal State Statistics Service of the Russian Federation.Footnote
According to organizations that provide statistical reports (excluding monetary authorities, commercial banks), including Rouble proceeds converted into US dollars.
Table 14.3.4 - Selected Data on Foreign Direct Investment - FDI - China - 2000/2013 (million US$)
2000 2006 2007 2008 2009 2010 2011 2012 2013 FDI inflow by source Hong Kong, China 15 500 20 233 27 703 41 036 46 075 60 567 70 500 65 561 73 397 Virgin Is. 3 833 11 248 16 552 15 954 11 299 10 447 9 725 7 831 6 159 Singapore 2 172 2 260 3 185 4 435 3 605 5 428 6 097 6 305 7 229 Korea, Rep. 1 490 3 895 3 678 3 135 2 700 2 692 2 551 3 038 3 054 Cayman Is. 624 2 095 2 571 3 145 2 582 2 499 2 242 1 975 1 668 United States 4 384 2 865 2 616 2 944 2 555 3 017 2 369 2 598 2 820 Samoa 283 1 538 2 170 2 550 2 020 1 773 2 076 1 744 1 858 Taiwan, China 2 296 2 136 1 774 1 899 1 881 2 476 2 183 2 847 2 088 Germany 1 041 1 979 734 900 1 217 888 1 129 1 451 2 078 Mauritius 265 1 033 1 333 1 494 1 104 929 1 139 959 910 India 10 52 34 88 55 49 42 44 27 Brazil 4 56 32 39 52 57 43 58 23 South Africa 9 95 69 26 41 66 13 16 13 Russia 16 67 52 60 32 35 31 30 22 FDI outflows by destination (1) Hong Kong, China ... 6 931 13 732 38 640 35 601 38 505 35 655 51 238 ... Cayman Is. ... 7 833 2 602 1 524 5 366 3 496 4 936 827 ... Australia ... 88 532 1 892 2 436 1 702 3 165 2 173 ... Luxembourg ... 4 42 2 270 3 207 1 265 1 133 ... Virgin Is. ... 538 1 876 2 104 1 612 6 120 6 208 2 239 ... Singapore ... 132 398 1 551 1 414 1 119 3 269 1 519 ... United States ... 198 196 462 909 1 308 1 811 4 048 ... Canada ... 35 1 033 7 613 1 142 554 795 ... Macao, China ... -43 47 643 456 96 203 17 ... Myanmar ... 13 92 233 377 876 218 749 ... Russia ... 452 478 395 348 568 716 785 ... Brazil ... 10 51 22 116 487 126 194 ... South Africa ... 41 454 4 808 42 411 -14 -815 ... India ... 6 22 102 -25 48 180 277 ... Source
a) Ministry of Commerce of the People's Republic of China.Footnote
(1) FDI outflows from 2003 to 2006 did not include financial intermediation, FDI outflows from 2007 and on included all sectors.
Table 14.4.1 - Balance of Payments - Brazil - 2013 (million US$)
Type of transaction Balance Credit Debit Current account (1) -81 074 304 227 385 301 Balance on goods (FOB) 2 553 249 543 246 990 Services and income (net) -86 994 49 204 136 197 Services -47 216 39 133 86 349 Income -39 778 10 071 49 848 Current unilateral transfers 3 366 5 480 2 114 Capital and financial account 74 147 481 270 407 123 Capital account (1) 1 193 1 632 438 Financial account 72 954 479 638 406 684 Direct investment 67 541 114 060 46 520 Portfolio investments 25 689 248 756 223 067 Financial derivatives 110 497 387 Other investments -20 386 116 324 136 711 Errors and omissions (1) 1 001 Overall balance (1) -5 926 Source
Central Bank of Brazil.Footnote
(1) Includes capital unrequited transfers and granting of brands and patents.
Table 14.4.2 - Balance of Payments - Russia - 2012 (millon US$)
Type of transation (1) Balance Current account 72 016 Goods and services 145 810 Primary income -67 661 Compensation of employees -11 831 Investments -56 838 Rent 1 008 Secondary income -6 133 Capital account -5 218 Finance account -56 501 Direct investment 1 765 Portfolio investments 17 031 Finacial derivatives -1 356 Other investments -43 925 Reserve assets -30 017 Net error and omission -10 297 Source
Bank of Russia.Footnote
(1) Can be listed respectively for each BRICS countries.
Table 14.4.3 - Balance of Payments - India - 2010-2013 (million US$)
2010-2011 2011-2012 2012-2013 Credit Debit Net Credit Debit Net Credit Debit Net A. Current account I. Merchandise 256 159 383 481 -127 322 309 774 499 533 -189 759 306 581 502 237 -195 656 II. Invisibles 190 488 111 218 79 269 219 229 107 625 111 604 224 044 116 551 107 493 Total current account (I + II) 446 647 494 700 -48 053 529 003 607 158 -78 155 530 625 618 788 -88 163 B. Capital account 1. Foreign investment 292 561 250 435 42 127 234 618 195 387 39 231 215 027 168 316 46 711 2. Loans 108 781 79 646 29 135 140 990 121 683 19 307 155 085 123 961 31 124 3. Banking capital 92 323 87 361 4 962 89 904 73 678 16 226 83 727 67 157 16 570 4. Rupee debt service 0 68 -68 0 79 -79 0 58 -58 5. Other capital 9 995 22 411 -12 416 13 296 20 224 -6 929 17 861 22 908 -5 047 Total capital account (1 to 5) 503 660 439 921 63 740 478 808 411 052 67 755 471 701 382 401 89 300 C. Errors and omissions 0 2 636 -2 636 0 2 432 -2 432 2 689 0 2 689 Overall balance (A+B+C) 949 212 936 162 13 050 1 007 811 1 020 643 -12 831 1 005 015 1 001 189 3 826 Source
Reserve Bank of India, HandBook of Statistics on Indian Economy.
Table 14.4.4 - Balance of Payments - China - 2012 (million US$)
Type of transaction Balance Credit Debit Current account 193 139 2 459 926 2 266 786 Goods and services 231 845 2 248 317 2 016 472 Goods 321 595 2 056 887 1 735 292 Services -89 750 191 430 281 180 Income and profit -42 139 160 441 202 581 Compensation of staff and workers 15 278 17 066 1 788 Profit from investment -57 417 143 376 200 793 Current transfers 3 434 51 167 47 733 Governments -3 098 863 3 961 Other departments 6 531 50 304 43 772 Capital and finance account -16 816 1 378 322 1 395 138 Capital account 4 272 4 550 278 Financial account -21 089 1 373 772 1 394 861 Direct investments 191 120 307 887 116 767 Securities 47 779 82 941 35 162 Other investments -259 988 982 944 1 242 932 Reserve assets -96 552 13 551 110 103 Gold reserves SDR (Special Drawing Rights) 505 695 189 China's position in IMF 1 616 1 616 0 Foreign currencies -98 673 11 240 109 913 Net error and omission -79 771 ... 79 771 Source
State Administration of Foreign Exchange.
Table 14.4.5 - Balance of Payments - South Africa - 2011 (million US$)
Type of transaction Balance Credit Debit Current account -13 621 Balance on goods (FOB) (1) 2 260 102 924 100 665 Services and income (net) -13 923 Services -4 744 14 866 19 610 Income -9 179 5 255 14 434 Current transfers -1 958 1 556 3 514 Capital and financial account (2) (3) (4) 13 618 Capital account (5) 33 53 20 Financial account 13 585 Direct investment 6 268 6 011 -257 Portfolio investments -2 255 6 324 8 579 Financial derivatives Other investments 4 076 5 929 1 854 Errors and omissions (2) (6) 10 005 Overall balance (2) -4 509 Source
South African Reserve Bank.Footnotes
(1) Public customs figures adjusted for balance-of-payment purposes.
(2) Investments by foreigners in undertakings in South Africa in which they have individual or collectively in the case of affiliated organisations or persons, at least 10 per cent of the voting rights.
(3) Investments by South African residents in undertakings abroad in which they have at least ten per cent of the voting rights.
(4) Transactions on the current, capital transfer and financial accounts.
(5) Commodity gold .Prior to 1981 net gold exports comprised net foreign sales of gold plus changes in gold holdings of the South African Reserve Bank and other banking institutions.
(6) Liabilities related to foreign reserves include all foreign liabilities of South African Reserve bank and short term foreign loans to the central government by international organisations.
Graph 14.1 (a) - Value of Imports and Exports of Goods and Commercial Services - 2008/2012
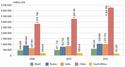
Click to enlargeSource: Summary Table of Chapter 14, BRICS Joint Statistical Publication 2014.
Graph 14.1 (b) - Ratio of Exports of Goods and Commercial Services to Imports of Goods and Commercial Services - 2008/2012
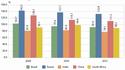
Click to enlargeSource: Summary Table of Chapter 14, BRICS Joint Statistical Publication 2014.
Graph 14.1 (c) - Share of External Debts to GDP - 2009-2012
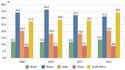
Click to enlargeSource: Summary Table of Chapter 14, BRICS Joint Statistical Publication 2014.
Russia
Export of goods - removal of goods (commodities) from the Russian Federation territory without of a guarantee of the return them back. Export includes the removal of domestically produced goods and reexport of goods as well. Domesticaly produced goods include also foreign manufactured goods imported into the country and significantly reprocessed and as a result changed their qualitative and technical characteristics. Re-exports - goods imported to the territory of the Russian Federation and then removed from its territory without payment of customs dues, taxes and application of embargo of economic restrictions. Recording of the good exports is realised by FOB prices or border prices of the exporting country. Import of goods - importing of goods into the Russian Federation territory without a guarantee of the return them removed back. Imports include the brought goods for consumption in the economy and good imported into the country territory in according to the reimport system. Re-imported goods are those moved out from the Russian Federation territory and then moved in this territory without payment of custom dues, taxes and application of embargo or economic restrictions. Recording of the good import is realised by in franco-border prices of the importing country (CIF), i.e. prices of goods include expenditures on the insurance and transportation to the border of the importing country. Balance of payments data are presented in accordance with the 6th version of the IMF's Balance of Payments and International Investment Position Manual. In the table 14.2.2 data on import and export of Russia are presented about the major trade partners and BRICS countries. India
Exports are credited to the country of final destination as declared by explorers in the shipping bill whether that country possesses a sea-port or not. The country of final destination is defined as that to which goods exported from India are intended to pass whether by sea and land or by sea only or by air without interruption of transit, save in the course of transhipment or transfer from one means of conveyance to another. Imports are classified with reference to the countries whence they were consigned to India and not with reference to the countries whence they were shipped directly to India. The country of consignment is defined as that from which the goods have come whether by land or sea or by sea only or by air, without interruption of transit save in the course of transhipment or transfer from one means of conveyance to another. Thus the countries where goods are consigned are not in all cases the countries of actual origin of goods produces in one country maybe purchased by a firm in another country and then dispatched after an interval to India. The data for Imports, Exports and Re-exports given are according to the Indian Trade Classification (based on harmonized Commodity description and coding system). External Debt to GDP includes Long term debts as Multilateral loans, bilateral loans, International Monetary Funds Trade Credit, External Commercial borrowings; non-Resident Indian deposits, Rupees debts and Short term deposit.
Under current account of the BoP, transactions are classified into merchandise (export and imports) and invisibles. Invisible transactions are further classified into three categories, namely a) Service- travel, transportation, insurance, Government not included elsewhere (GNIE) and miscellaneous (such as, communication, construction, financial, software, news agency, royalties, management and business services); b) Income; and c) Transfers (grants, gifts, remittances, etc.) which do not have any quid pro quo. Under the Capital Account, capital inflows can be classified by instrument (debt or equity) and maturity (short or long term). The main components of the capital account include foreign investment, loans and banking capital. Foreign investment, compromising Foreign Direct Investment consisting of Foreign Institutional Investors (FIIs) investment, American Depository Receipts? Global Depository receipts (ADRs/GDRs) represents non-debt liabilities, while loans external assistance, (external commercial borrowings and trade credit) and banking capital, including non-resident India (NRI) deposits are liabilities.China
Foreign Trade statistics and Coverage China's official external trade statistics is implemented by General Administration of Customs of the Peoples Republic of China. It's compiled from the declarations, which are made to the Customs by imports, exports or their agents and subject to verification by customs officers at the time of customs clearance. External Statistics comprise all merchandise passing through China's Customs territory (with the exceptions mentioned below). Including: goods from abroad entering customs warehouses, bonded areas or special economic zones (SEZ) and goods leaving abovementioned areas to abroad; goods for inward or outward processing or assembling and subsequent re-exportation or re-importation; goods on lease for one year or more; goods imported or exported by foreign-invested enterprises; international aid or donations, etc. Excluding: Customs statistics do not cover temporary imports or exports; goods on lease for less than one year; travellers' personal effects; ship's and aircraft' bunkers and stores obtained abroad; monetary gold and coins being legal tender; goods in transit through China. Import and Export Valuation Imports are valued on a CIF basis, which is based on the transaction value and all freight, insurance and other charges incurred before discharging the goods at the first port of entry of China. Exports are valued on a FOB basis, which is based on the transaction value at China's port of shipment equivalent of the actual price at which the goods are sold. The statistical value is expressed in RMB and USD respectively. Any transaction value in terms of a currency other than RMB or USD shall be converted into RMB or USD at the exchange rate between issued by the State Administration of Foreign Exchange. Trading Partner The country of origin is recorded for imports while the country of final destination for exports. The country of origin refers to the country or region where the imported goods have been grown, mined or manufactured. If two or more countries (regions) were involved in the manufacture of the products, the place where the last substantial working or processing was carried out will be recorded as the country (region) of origin. However, the countries (regions) of origin of the imported goods are not quite clear will be recorded as "country unkown". The country of final destination refers to the country or region where the exported goods are to be consumed, utilized or further processed or manufactured. In instance where the country of final destination can not be ascertained, the exports will be credited to the final country (region) dispatched to as known at the time of exportation. Inflows of FDI refer to the investments inside China by foreign enterprises and economic organizations or individuals (including overseas Chinese, compatriots from Hong Kong, Macao and Taiwan, and Chinese enterprises registered abroad), following the relevant policies and laws of China, for the establishment of ventures exclusively with foreign own investment, Sino-foreign joint ventures and cooperative enterprises or for co-operative exploration of resources with enterprises or economic organizations in China.
It includes the re-investment of the foreign entrepreneurs with the profits gained from the investment and the funds that enterprises borrow from abroad in the total investment of projects which are approved by the relevant department of government.Outflows of FDI refer to investment made by domestic enterprises and organizations (referred to as domestic investors) in foreign countries and Hong Kong, Macao and Taiwan regions in the form of cash, in-kind, intangible assets and other ways, and the economic activities centering on controlling the operation and management of those foreign enterprises. The Balance of Payments (BOP) is a statement that summarizes economic transactions between residents and nonresidents during a specific time period. The International Investment Position (IIP) shows at a point in time the value of : financial assets of residents of an economy that are claims on nonresident or are gold bullion held as reserve assets; and the liabilities of residents of an economy to nonresidents.
Table 15.1 - Number of Foreign Tourists Arrivals in BRICS Countries from Different Continents - 2006-2013 (100 persons-time)
Continents of origin 2006 2007 2008 2009 2010 2011 2012 2013 Africa Brazil 837 754 758 781 837 865 923 ... Russia (1) 68 64 105 96 98 111 137 176 India 1 428 1 575 1 418 1 645 2 045 2 324 2 614 ... China 2 938 3 791 3 784 4 012 4 636 4 888 5 249 5 527 South Africa ... ... ... 50 894 57 412 61 368 66 565 ... Americas Brazil 27 173 27 792 28 838 28 622 31 963 34 016 35 823 ... Russia (1) 2 742 2 375 2 777 2 661 2 424 2 711 2 906 3 257 India 9 121 10 496 10 708 10 978 12 364 13 007 13 597 ... China 24 058 27 210 25 814 24 912 29 954 32 010 31 795 31 238 South Africa ... ... ... 3 332 4 580 4 329 5 134 ... Asia Brazil 1 826 1 887 2 204 1 598 1 843 2 270 2 447 ... Russia (1) 5 185 4 064 4 053 3 766 5 008 6 311 9 404 India 16 203 18 096 19 555 18 892 21 338 24 161 25 390 ... China 135 882 160 612 145 511 137 811 161 786 166 232 166 222 160 601 South Africa ... ... ... 2 230 2 826 2 505 ... ... Europe Brazil 18 947 18 366 17 398 15 782 15 755 15 756 15 980 ... Russia (1) 8 297 7 138 7 023 6 606 6 516 6 691 7 160 7 315 India 16 086 18 388 19 006 18 175 19 780 21 133 21 658 ... China 52 796 62 168 61 233 45 911 56 979 59 378 59 482 56 881 South Africa ... ... ... 7 639 8 399 12 732 ... ... Australia Brazil 318 435 470 483 463 447 528 ... Russia (1) 230 296 298 253 246 284 375 412 India 1 374 1 671 1 783 1 825 2 103 2 332 2 445 ... China 6 386 7 285 6 888 6 724 7 893 8 593 9 149 8 634 South Africa ... ... ... 1 015 1 281 1 228 1 429 Others (not specified) Brazil 1 071 1 024 833 757 753 979 1 067 ... Russia (1) 7 807 8 199 8 695 7 625 7 046 7 253 6 689 6 084 India 260 589 356 162 128 136 74 ... China 43 31 23 22 21 19 19 22 South Africa ... ... ... 5 009 6 238 1 232 ... ... Sources
Brazil
Ministry of Tourism.Russia
State Border Service of Russia.India
Ministry of Tourism, India Tourism Statistics (various issues).China
a) National Bureau of Statistics of the People's Republic of China, China Statistical Yearbook 2000-2013.
b) China National Tourism Administration, The Yearbook of China Tourism Statistics, 2000-2013.South Africa
Statistics South Africa.Footnotes
The figures of Australia pertains to Australasia, a region of Oceania that includes Australia, New Zealand, the island of New Guinea, and neighboring islands in the Pacific Ocean.Russia
(1) Number of tourist arrivals (visits).India
The following categories of travelers are not included in the data series on foreign tourism:
(a) Nationals of Nepal entering India through land routes along Indo-Nepal border.
(b) All foreigners entering India from Bhutan by land.
Table 15.2.1 - Foreign Tourists Arrivals by Top 15 Countries - Brazil - 2001/2012
Countries of origin 2001 2004 2005 2006 2007 2008 2009 2010 2011 2012 Total 4 772 575 4 793 703 5 358 170 5 017 251 5 025 834 5 050 099 4 802 217 5 161 379 5 433 354 5 676 843 Argentina 1 374 461 922 484 992 299 933 061 921 679 1 017 675 1 211 159 1 399 592 1 593 775 1 671 604 United States of America 596 844 705 993 793 559 721 633 695 749 625 506 603 674 641 377 594 947 586 463 Germany 320 050 294 989 308 598 277 182 257 740 254 264 215 595 226 630 241 739 258 437 Uruguay 304 682 309 732 341 647 255 349 226 111 199 403 189 412 228 545 261 204 253 864 Chile 153 921 155 026 169 953 176 357 260 439 240 087 170 491 200 724 217 200 250 586 Paraguay 285 724 204 762 249 030 198 958 212 022 217 709 180 373 194 340 192 730 246 401 Italy 216 038 276 563 303 878 287 898 268 685 265 724 253 545 245 491 229 484 230 114 France 184 759 224 160 263 829 275 913 254 367 214 440 205 860 199 719 207 890 218 626 Spain 126 928 155 421 172 979 211 741 216 891 202 624 174 526 179 340 190 392 180 406 Portugal 165 898 336 988 357 640 299 211 280 438 222 558 183 697 189 065 183 728 168 649 England 143 626 150 336 169 514 169 627 176 970 181 179 172 643 167 355 149 564 155 548 Bolivia 107 664 60 239 68 670 55 169 61 990 84 072 83 454 99 359 85 429 112 639 Colombia 50 335 42 163 47 230 50 103 45 838 96 846 78 010 85 567 91 345 100 324 Peru 48 405 56 647 60 251 64 002 96 336 93 693 78 975 81 020 86 795 91 996 Netherlands 44 057 102 480 109 708 86 122 83 566 81 936 75 518 76 411 72 162 73 133 Others 649 183 795 720 949 385 954 925 967 013 1 052 383 925 285 946 844 1 034 970 1 078 053 Sources
a) Federal Police Department of Brazil.
b) Ministry of Tourism.
Table 15.2.2 - Foreign Tourists Arrivals by Top 15 Countries - Russia - 2001-2013 (number of visits)
Countries of origin 2001 2004 2005 2006 2007 2008 2009 2010 2011 2012 2013 Total (1) 2 295 206 2 860 802 2 384 626 2 433 018 2 213 597 2 295 074 2 100 601 2 133 869 2 335 977 2 570 469 2 664 782 Germany 204 644 351 099 313 547 328 583 345 708 332 822 333 892 347 214 346 627 375 285 380 253 China 156 792 283 839 204 192 157 361 129 749 127 155 115 870 158 061 234 127 343 357 372 314 USA 77 472 181 721 156 737 224 970 172 356 185 888 183 293 162 383 169 763 179 763 197 334 United Kingdom 66 036 115 622 118 996 124 169 130 608 142 016 150 910 126 454 128 533 135 949 157 799 Turkey 9 720 41 888 43 978 47 106 49 479 54 593 43 756 56 376 80 754 100 918 122 728 Italy 61 099 125 397 125 310 116 000 129 950 143 493 113 495 122 973 125 062 118 729 117 927 France 50 585 141 113 109 305 102 513 112 762 103 223 94 176 94 282 94 863 99 581 96 947 Finland 193 707 242 816 175 557 148 153 153 139 142 017 149 884 139 216 133 630 120 306 93 762 Israel 9 655 26 924 30 397 27 133 31 250 32 725 46 451 58 694 75 468 85 955 92 478 Spain 14 661 51 395 60 180 53 943 79 497 105 655 95 070 86 732 100 773 70 291 70 193 Japan 33 391 56 780 50 842 59 581 45 083 44 435 39 269 42 176 37 985 44 667 55 092 Republic of Korea 20 442 44 397 43 304 42 951 48 825 47 343 35 200 42 573 46 991 48 425 52 114 Netherlands 13 268 33 101 32 695 29 014 33 659 35 376 31 851 34 907 37 874 32 533 30 893 Brazil 1 868 5 168 7 302 4 848 20 526 16 087 10 640 15 131 23 050 27 180 30 049 Latvia 37 531 50 501 119 938 49 396 64 280 66 754 33 884 33 796 33 522 32 125 28 149 India 1 327 4 753 7 487 4 984 12 868 6 806 8 641 9 563 12 590 26 598 17 824 South Africa 1 412 2 129 2 108 3 295 2 971 6 694 3 826 3 970 4 038 4 406 5 540 Source
State Boarder Service of Russia.Footnotes
Top 15 (rank for 2013 year) and BRICS countries.
(1) Foreign tourist arrivals from all countries.
Table 15.2.3 - Foreign Tourists Arrivals by Top 15 Countries - India - 2001/2012 (person-time)
Countries of origin 2001 2005 2006 2007 2008 2009 2010 2011 2012 Total 2 537 282 3 918 610 4 447 167 5 081 504 5 282 603 5 167 699 5 775 692 6 309 222 6 577 745 United States of America 329 147 611 165 696 739 799 062 804 933 827 140 931 292 980 688 1 039 947 United Kingdom 405 472 651 803 734 240 796 191 776 530 769 251 759 494 798 249 788 170 Bangladesh 431 312 456 371 484 401 480 240 541 884 468 899 431 962 463 543 487 397 Srilanka 112 813 136 400 154 813 204 084 218 805 239 995 266 515 305 853 296 983 Canada 88 600 157 643 176 567 208 214 222 364 224 069 242 372 259 017 256 021 France 102 434 152 258 175 345 204 827 207 802 196 462 225 232 231 423 240 674 Germany 80 011 120 243 156 808 184 195 204 344 191 616 227 720 240 235 254 783 Japan 80 634 103 082 119 292 145 538 145 352 124 756 168 019 193 525 220 015 Australia 52 691 96 258 109 867 135 925 146 209 149 074 169 647 192 592 202 105 Malaysia 57 869 96 276 107 286 112 741 115 794 135 343 179 077 208 196 195 853 Singapore 42 824 68 666 82 574 92 908 97 851 95 328 107 487 119 022 131 452 China (Main) 13 901 44 897 62 330 88 103 98 093 100 209 119 530 142 218 168 952 Russia 15 154 56 446 62 203 75 543 91 095 94 945 122 048 144 312 177 526 Italy 41 351 67 642 79 978 93 540 85 766 77 873 94 100 100 889 98 743 South Korea 27 150 49 895 70 407 84 583 82 335 ... 95 587 108 680 109 469 Others 655 919 1 049 565 1 174 317 1 375 810 1 443 446 1 472 739 1 729 710 1 802 538 1 883 023 Source
Ministry of Tourism, India Tourism Statistics (various issues).Footnote
The following categories of travelers are not included in the data series on foreign tourism:
(a) Nationals of Nepal entering India through land routes along Indo-Nepal border;
(b) All foreigners entering India from Bhutan by land.
Table 15.2.4 - Foreign Tourists Arrivals by Top 15 Countries or Territories - China - 2000/2013 (1 000 person-time)
Countries or territories of origin 2000 2004 2005 2006 2007 2008 2009 2010 2011 2012 2013 Total (1) 10 160 16 933 20 255 22 210 26 110 24 325 21 938 26 127 27 112 27 192 26 290 Korea, Rep. 1 345 2 845 3 545 3 924 4 777 3 960 3 198 4 076 4 185 4 070 3 969 Japan 2 202 3 334 3 390 3 746 3 978 3 446 3 318 3 731 3 658 3 518 2 878 Russia 1 080 1 792 2 224 2 405 3 004 3 123 1 743 2 370 2 536 2 426 2 186 United States of America 896 1 309 1 556 1 710 1 901 1 786 1 710 2 010 2 116 2 118 2 085 Vietnam ... 170 201 334 654 744 829 920 1 007 1 137 1 365 Malaysia 441 742 900 911 1 062 1 041 1 059 1 245 1 245 1 236 1 207 Mongolia 399 554 642 631 682 705 577 794 994 1 011 1 050 Philippines 364 549 654 704 833 795 749 828 894 962 997 Singapore 399 637 756 828 922 876 890 1 004 1 063 1 028 967 Australia 234 376 483 538 607 572 562 661 726 774 723 Canada 237 348 430 499 577 535 550 685 748 708 684 India 121 309 357 405 463 437 449 549 607 610 677 Thailand 241 464 586 592 612 554 542 636 608 648 652 Germany 239 365 455 501 557 529 519 609 637 660 649 United Kingdom 284 418 500 533 605 552 529 575 596 618 625 Brazil ... 14 38 48 67 75 64 85 98 99 96 South Africa ... 35 52 56 58 54 51 65 67 72 69 Source
China National Tourism Administration, The Yearbook of China Tourism Statistics 2000-2013.Footnotes
Top 15 (rank for 2013 year) and BRICS countries.
(1) The data for Total include all foreign tourist arrivals in China.
Table 15.2.5 - Foreign Tourists Arrivals by Top 15 Countries - South Africa - 2009-2012 (person-time)
Countries of origin 2009 2010 2011 2012 Total 7 011 865 8 073 552 8 339 354 9 188 368 Zimbabwe 1 227 631 1 513 714 1 553 008 1 847 973 Lesotho 1 048 550 1 275 838 1 526 597 1 618 222 Mozambique 983 739 1 051 502 1 076 753 1 104 404 Swaziland 628 113 632 490 700 119 768 728 Botswana 484 258 507 042 477 937 452 159 United Kingdom 446 369 453 030 420 483 438 023 United States of America 230 324 282 377 287 614 326 644 Germany 196 643 215 800 235 774 266 333 Namibia 177 863 190 903 197 835 200 841 Zambia 147 089 157 692 160 302 169 555 Malawi 139 605 126 120 135 577 142 063 From BRICS India 55 203 71 587 90 367 106 774 China 34 561 65 920 84 862 132 327 Brazil 32 256 53 756 54 183 78 376 Russian Federation 8 893 11 551 10 487 13 350 Others 1 170 768 1 464 230 1 328 456 1 522 596 Source
Statistics South Africa.
Table 15.3.1 - Foreign Tourists Arrivals in the Country from Different Continents - Brazil - 2001/2012
Continents of origin 2001 2004 2005 2006 2007 2008 2009 2010 2011 2012 Total 4 772 575 4 793 703 5 358 170 5 017 251 5 025 834 5 050 099 4 802 217 5 161 379 5 433 354 5 676 843 North America 693 238 838 595 941 777 855 098 818 536 765 380 734 998 773 181 729 756 716 583 Central and South America 2 438 455 1 864 847 2 056 283 1 862 175 1 960 628 2 118 459 2 127 173 2 423 119 2 671 836 2 865 673 Western Europe (1) 1 392 803 1 761 260 1 970 540 1 873 507 1 812 480 1 693 095 1 542 272 1 535 301 1 525 040 1 541 874 Eastern Europe (2) 0 0 35 899 21 217 24 169 46 666 35 913 40 224 50 601 56 170 Africa (3) 36 352 64 678 75 676 83 721 75 435 75 824 78 110 83 688 86 511 92 349 South East Asia (4) 0 0 0 0 0 0 0 0 - - East Asia (5) 82 620 98 464 110 398 136 153 126 620 163 149 119 025 128 450 163 855 189 036 West Asia (6) 26 178 32 159 35 138 46 461 62 051 37 813 29 405 36 976 41 646 33 523 South Asia (7) 0 0 0 0 0 19 456 11 361 18 829 21 530 22 096 Australasia (8) 23 486 22 972 26 023 31 819 43 520 47 000 48 295 46 302 44 657 52 815 Others (not specified) 79 443 110 728 106 436 107 100 102 395 83 257 75 665 75 309 97 922 106 724 Source
Ministry of Tourism.Footnotes
(1) Includes Austria, Belgium, Denmark, Finland, France, Germany, Greece, Ireland, Italy, Netherland, Norway, Portugal, Spain, Sweden, Switzerland, U.Ketc.
(2) Includes Hungary, Poland, CIS etc.
(3) Includes Egypt, Ethiopia, Kenya, Nigeria, South Africa, Sudan, Tanzania, Zambia etc.
(4) Includes Indonesia, Malaysia, Myanmar, Philippines, Singapore, Thailand etc.
(5) Includes China, Hong Kong, Japan, Korea etc.
(6) Includes Bahrain, Israel, Jordan, Kuwait, Oman, Qatar, Saudi Arabia, Syria, Turkey, U.A.E., Yemen Arab Republic etc.
(7) Includes Afghanistan, Iran, Maldives, Nepal, Pakistan, Bangladesh, Sri Lanka, Bhutan etc.
(8) Includes Australia, New Zealand, the island of New Guinea, and neighboring islands in the Pacific Ocean.
Table 15.3.2 - Foreign Tourists Arrivals in the Country from Different Continents - Russia - 2001/2013 (number of visits)
Continents of origin 2001 2004 2005 2006 2007 2008 2009 2010 2011 2012 2013 Total 2 295 206 2 860 802 2 384 626 2 433 018 2 213 597 2 295 074 2 100 601 2 133 869 2 335 977 2 570 469 2 664 782 North America 83 715 199 556 171 220 248 576 199 171 230 144 226 937 193 925 204 703 216 023 238 335 Central and South America 8 213 20 513 25 483 25 626 38 350 47 526 39 188 48 496 66 360 74 583 87 376 Western Europe 293 699 602 147 527 630 532 038 573 135 539 592 535 927 546 793 552 784 584 387 585 705 Eastern Europe 1 024 411 520 206 231 689 297 672 140 682 162 710 124 643 104 835 116 289 131 620 145 747 Africa 2 634 5 303 5 969 6 825 6 355 10 467 9 553 9 822 11 092 13 728 17 640 South East Asia 5 082 13 466 11 709 19 607 22 796 20 945 17 644 25 076 26 351 39 305 36 014 East Asia 236 316 402 632 316 456 279 260 238 374 235 506 207 072 264 739 349 966 485 481 568 719 West Asia 42 150 130 519 119 531 188 125 94 449 101 974 105 909 136 856 180 477 216 712 244 227 South Asia 65 976 38 915 36 220 31 542 50 734 46 870 46 002 74 123 74 263 102 187 91 392 Australasia(1) 7 298 17 878 18 210 23 035 29 629 29 826 25 268 24 591 28 417 37 530 41 186 Others 525 712 909 667 920 509 780 712 819 922 869 514 762 458 704 613 725 275 668 913 608 441 Source
State Border Service of Russia.Footnotes
Names and composition of geographical regions are given according to Standard Country or Area Codes for Statistical use by United Nations. (1) Includes Australia, New Zealand, the island of New Guinea, and neighboring islands in the Pacific Ocean.
Table 15.3.3 - Foreign Tourists Arrivals in the Country from Different Continents - India - 2001/2012 (person-time)
Continents of origin 2001 2004 2005 2006 2007 2008 2009 2010 2011 2012 Total 2 537 282 3 456 698 3 918 610 4 447 167 5 081 504 5 282 603 5 167 699 5 775 692 6 309 222 6 577 745 North America 417 747 662 004 768 808 873 306 1 007 276 1 027 297 1 051 209 1 173 664 1 239 705 1 295 968 Central and South America 21 925 28 165 35 586 38 745 42 319 43 505 46 604 62 728 60 988 63 699 Western Europe 819 973 1 128 297 1 282 119 1 487 271 1 686 083 1 709 525 1 634 042 1 750 342 1 838 695 1 853 066 Eastern Europe 38 863 82 426 101 445 121 309 152 764 191 110 183 475 227 650 274 598 312 686 Africa 90 962 115 493 134 801 142 813 157 485 141 750 164 474 204 525 232 386 261 428 West Asia 96 424 122 808 133 821 146 693 171 661 215 542 204 843 235 317 278 773 290 996 South Asia 672 133 790 698 841 969 908 916 982 428 1 051 846 1 001 401 1 047 444 1 139 659 1 171 499 South East Asia 139 975 209 110 241 408 281 726 303 475 332 925 360 191 439 043 521 755 540 914 East Asia 130 464 201 627 223 567 282 985 352 037 355 230 322 797 411 947 475 951 535 622 Australasia (1) 66 104 100 944 119 778 137 436 167 063 178 308 182 451 210 275 233 165 244 511 Others 42 712 15 126 35 308 25 967 58 913 35 565 16 212 12 757 13 547 7 356 Source
Ministry of Tourism, India Tourism Statistics (various issues).Footnotes
The following categories of travelers are not included in the data series on foreign tourism:
(a) Nationals of Nepal entering India through land routes along Indo-Nepal border;
(b) All foreigners entering India from Bhutan by land.
(1) Includes Australia, New Zealand, the island of New Guinea, and neighboring islands in the Pacific Ocean.
Table 15.3.4 - Foreign Tourists Arrivals in the Country from Different Continents and Countries - China - 2000/2013 (1 000 persons-times)
Continents and countries of origin 2000 2007 2008 2009 2010 2011 2012 2013 Total 10 160 26 110 24 325 21 938 26 127 27 112 27 192 26 290 Asia 6 102 16 061 14 551 13 779 16 179 16 623 16 622 16 060 Korea, DPR 76 114 102 106 116 152 181 207 India 121 463 437 449 549 607 610 677 Indonesia 221 477 426 469 573 609 622 605 Japan 2 202 3 978 3 446 3 318 3 731 3 658 3 518 2 878 Malaysia 441 1 062 1 041 1 059 1 245 1 245 1 236 1 207 Mongolia 399 682 705 577 794 994 1 011 1 050 Philippines 364 833 795 749 828 894 962 997 Singapore 399 922 876 890 1 004 1 063 1 028 967 Korea, Rep. 1 345 4 777 3 960 3 198 4 076 4 185 4 070 3 969 Thailand 241 612 554 542 636 608 648 652 Africa 66 379 378 401 464 489 525 553 South Africa 58 54 51 65 67 72 69 Europe 2 489 6 217 6 123 4 591 5 698 5 938 5 948 5 688 United Kingdom 284 605 552 529 575 596 618 625 Germany 239 557 529 519 609 637 660 649 France 185 463 430 425 513 493 525 534 Italy 78 215 194 191 229 235 252 251 Netherlands 76 194 181 167 189 198 196 189 Portugal 23 48 44 44 48 47 49 49 Sweden 54 145 138 126 155 170 172 159 Switzerland 31 65 63 63 74 75 83 81 Russia 1 080 3 004 3 123 1 743 2 370 2 536 2 426 2 186 Latin America 83 160 260 231 301 337 353 354 Brazil 67 75 64 85 98 99 96 North America 1 133 2 562 2 321 2 260 2 695 2 864 2 826 2 770 Canada 237 577 535 550 685 748 708 684 United States 896 1 901 1 786 1 710 2 010 2 116 2 118 2 085 Oceanic and Pacific Islands 282 729 689 672 789 859 915 863 Australia 234 607 572 562 661 726 774 723 New Zealand 38 109 105 100 116 121 128 129 Others 7 3 2 2 2 2 2 2 Source
National Bureau of Statistics of the People's Republic of China, China Statistical Yearbook 2000-2013.
Table 15.3.5 - Foreign Tourists Arrivals in the Country from Different Continents - South Africa - 2009-2012 (person-time)
Continents of origin 2009 2010 2011 2012 Total 7 011 865 8 073 552 8 339 354 9 188 368 North America 275 715 337 652 345 384 393 446 Central and South America 57 530 120 329 87 506 119 913 Western Europe 735 072 793 970 1 230 796 ... Eastern Europe 28 829 45 904 42 416 ... Africa 5 089 414 5 741 177 6 136 835 6 656 457 South East Asia 27 346 32 148 43 542 ... East Asia 86 893 120 149 138 376 ... West Asia 37 828 37 285 44 547 ... South Asia 70 901 92 986 24 007 ... Australasia (1) 101 479 128 149 122 784 142 949 Others (not specified) 500 858 623 803 123 161 ... Source
Statistics South Africa.Footnote
(1) Includes Australia, New Zealand, the island of New Guinea, and neighboring islands in the Pacific Ocean.
General
Tourism, Rome 1963.International Visitor: An international visitor is any person visiting the country on a foreign passport and the main purpose of visit is other than the exercise of an activity remunerated from within the country of establishments of residence in the country. This definition covers two segments of visitors: Tourists' and "Same Day Visitors".
A "foreign tourist" is a person visiting India on a foreign passport, staying at least twenty four hours in the country, the purpose of whose journey can be classified under one of the following headings:
(i) Leisure (recreation, holiday, health, study, religion, and sport);
(ii) Business, family, mission, meeting.Brazil
Foreigner Tourist Arrival - Arrivals of non-residents persons across international borders of Brazil classified as a tourist (or overnight visitors), and with a stay for less than a year for any main purpose: 1- Personal (Holidays, leisure and recreation, Visiting friends and relatives, education and training, health and medical care, religion and pilgrimages, shopping and others) and Business and professional.
They are not counted as visitors/tourist: employed by a resident entity, border workers, seasonal workers, other short and long term workers, nomads and refugees, transit passengers not entering the economic and legal territory, crews on a public modes of transport, persons entering the country to establish there their country of residence, long- term students and patients and their family, diplomats, consular staff, military personnel and their dependants, armed forces on maneuver.Russia
Foreign tourist arrival refer to foreign visitor arrivals who come to Russia for medical treatment, recreation, sight-seeing, sport, business, religion and other purposes excluding the exercise of an activity remunerated from within the country, and who stay from 24 hours till 6 months or at least 1 night in the country. India
A "foreign tourist" is a person visiting India on a foreign passport, staying at least twenty four hours in the country, the purpose of whose journey can be classified under one of the following headings:
(i) Leisure (recreation,holiday,health,study, religion & sport)
(ii) Business, family , mission, meeting.China
Foreign Tourists Arrivals refer to foreign visitor arrivals who come to China (mainland) for sight-seeing, vacation, visiting relatives, medical treatments, shopping, attending conferences or to engage in activities of economic, cultural, sports and religious. In compiling statistics, each time of entering China (mainland) is counted as one person-time. [Source: Instituto Brasileiro de Geografia e Estatistica - IBGE, Rio de Janeiro, Jul14]
A Brief Overview of The Statistical System of Brazil
I. Organizational Structure of the IBGE
The Brazilian Institute of Geography and Statistics (IBGE) is ruled according to the Law n.�5.878, of May 11th 1973, and the Statute - Decree n.�3.740, of June 13th, 2003. It is linked to the Ministry of Planning, Budget and Management, with the role of coordinating the Brazilian Statistical System and being the main producer of official statistics in Brazil.
The Brazilian official statistics are being produced by IBGE, Central Bank, ministries and statistical state agencies. IBGE is the official statistics office responsible for the production, analysis and dissemination of Statistical information (demographic, economic and social), as well as geographical, cartographic and geodetic information and those related to natural resources and environment.
IBGE besides its functions in the Statistical System is also the main producer of geo scientific information and has the role of coordinating the National Cartographic System. One of the main projects of the production of geo scientific information is the construction of the National Spatial Data Infrastructure - INDE. The purpose of the INDE is to catalogue, to integrate and harmonize geospatial data from Brazilian institutions, producers and sponsors of this kind of data, so that these data can be easily located, accessed and used for several uses and for any user who has Internet access.
IBGE is responsible for the construction, provision and operation of the Brazilian Geospatial Data Site-SIG Brazil, as well as for the management of the Brazilian Directorate of Geospatial Data - DBDG. It is also responsible to prepare the proposal for obtaining the necessary resources for the implementation and maintenance of INDE.
The programs carried out by IBGE are fundamental for both the government and the society. Several public policy actions are based on the information produced by IBGE on the Brazilian reality.
In order to produce statistical and geo scientific information, IBGE is present countrywide, with units at headquarters, in Rio de Janeiro, and in state and municipal levels, with the following composition: Collegiate bodies of senior direction: Technical Council, Board of Trustees, Board of Directors; Channels of direct and immediate assistance to the President: Cabinet, Attorney General; Sectional bodies: Internal Audit, Executive Board; Specific individual organs. Directorate of Surveys, Directorate of Geosciences, Directorate of Informatics, Centre for Documentation and Information Dissemination, National School of Statistical Sciences, 27 State Units (26 state and Federal District), with 581 agencies to collect and disseminate data.
The production of statistics and geo scientific information is carried out by the Directorate of Geoscience and Directorate of Surveys.
These departments are supported by the Directorate of Informatics, which ensures the infrastructure of computer hardware and software and data communication. The Centre for Documentation and Information Dissemination is in charge of the dissemination policy for the results of all surveys carried out by the institution, publicizing them online, including micro data, free of charge.
The Executive Board is accountable for planning, budget and overall coordination of IBGE's work.
The Directorate of Surveys is responsible for the production of social, economic and demographic statistics as well as for the production of synthesis to the System of National Accounts and Social indicators. It is also responsible for coordinating National Statistical System, systematically calling meetings with users and other producers of statistical information.
The Directorate of Geosciences is responsible for the production of geographical, geodetic and cartographic information, as well as those related to environmental and natural resources. It also coordinates the fundamentals Geodetic and Basic Cartography plans.
IBGE maintains the National School of Statistical Sciences, which offers the following courses: Bachelor of Science degree in Statistics, Post Graduate Diploma in Environmental Analysis and Land Management, Masters in Population Studies and Social Research and training programs for IBGE technicians.
The units of IBGE at headquarters are responsible for the design of surveys, analysis of results and coordination of the teams working at the national level.
The units of IBGE located throughout the national territory are responsible for the collection, review and submission of primary statistical data to headquarters.
These units also conduct field activities related to geodesy and cartography.
II. Work Program for the Production of Statistics
In 2012, IBGE has updated its Strategic Plan in order to set goals and targets for the future years. Thus, the Strategic Plan is the main instrument of governance of the institution.
The program of work and its schedule are discussed by all technical and infrastructure areas before being consolidated into IBGE'S Strategic Plan. This is submitted to the Planning Board, composed by IBGE's President and directors, which evaluates and approves it.
IBGE's Strategic Plan subsidizes the preparation of the Federal Government Multi-year Plan (PPA, in Portuguese) for the same period. The PPA covers all areas of government and describes the main objectives and goals for various organizations and ministries.
The institutional goals to be met in a semester have been set at the beginning of each semester. Institutional goals encompass the full range of publications planned for the period. These goals are approved by the Board and broadly disseminated, both internally and on the internet. They are an item in the objective evaluation of the institution's performance in accomplishing its mission.
IBGE's work program is presented to various Advisory Committees, which are composed of renowned members in the area, who discuss methodological issues and assist in setting priorities.
The Advisory Committees cover the following areas: Population Census, Agriculture Census; National Index of Consumer Prices; Mortality Statistics: Planning Control and Evaluation of Agricultural Statistics; Brazilian Regional Accounts.
As the demands for information not included in the predetermined work program cannot be satisfied with the resources available, they are met through agreements with the concerned governmental entities, which fund additional surveys. Examples of additional surveys are those demanded by the Ministries of Health, Education and Social Development.
IBGE also cooperates with various ministries, such as the Ministry of Finance, and the central Bank for the preparation of National Accounts.
Annually, the Ministry of Labor provides IBGE with the Annual list of Social Information (RAIS), which consist of the set of administrative records used to update the Central Business Register (CEMPRE).This register is used to select the sample of enterprises for the Annual Economic Surveys, which has replaced the Economic Censuses since 1990's. To set their long term lines of work, IBGE hold regular meetings with producers and users of social, economic and territorial information. These meetings aim at preparing the revision and expansion of the General Plan of Statistical and Geographical Information, based on mobilization and consultation to producers and users of information, including governmental institutions, survey institutes, NGOs, Scientific associations, as well as technicians and researchers interested in the production, dissemination and use of information.
This action resulted in the preparation of a diagnosis of the state of the art of production of information in the sphere of public services and the mapping of gaps, identifying opportunities for improvement and demands for new information.
The growing demand for socioeconomic and demographic information, as well as the inclusion of new issues, requires research in shorter time intervals.
One solution to fit the statistical offices to this new reality has been the adoption of models that address a systematic conception, with the production of integrated information sources and databases.
The Integrated System of Household Survey (SIPD) will integrate the existing household surveys (National Household Sample Survey - PNAD, Monthly Employment Survey - PME, Household Budget Survey - POF, Urban Informal Economy Survey - ECINF) and meet new demands.
Being a new project, with proposals of significant dimension, planning SIPD requires intensive contact with users and producers of information. In this sense, the steps in the development of SIPD have been presented in seminars and conferences sponsored by IBGE.
The transparency of this process assures users the joint monitoring and evaluation of the paths taken in building this new project.
III. Social Statistics Committee
The Social Statistics Committee, which was established by Inter ministerial Decree n�424, issued on December 6, 2007, is a forum for the discussion and evaluation of the demands of the Social Statistical System of the Country.
The following Ministries and Institutes are part of the Social Statistics Committee: Ministry of Social Development and the 'Fight against Hunger" Food Programme; Ministry of Education; Ministry of Planning, Budget and Management; Ministry of Social Welfare; Ministry of Health; Ministry of Labor and Employment; Institute of Applied Economic Research - IPEA; Ministry of Justice; National Institute of Educational Studies and Research Anfsio Teixeira - INEP; and Brazilian Institute of Geography and Statistics - IBGE.
The Social Statistics Committee is composed of the Managerial Committee, which is responsible for setting guidelines for the work of the committee, and the Executive Group, responsible for implementing such guidelines.
The work of the Social Statistics Committee has been following the guidelines below since 2009: Draw up the inventory of social statistics, especially the official ones, updating them regularly; Ensure and improve the comparability and accessibility of information; Encourage the adoption of concepts, classifications and methods for processing, storing and presenting official statistical information; Fill in information gaps and expand the integration of data sources; Organize the demand for information and coordinate their production and use; Regulate and facilitate access by various government agencies to existing databases, ensuring transparency, visibility and secrecy; Undertake actions in order to allow visibility to the work developed by the Committee; and Adopt the Fundamentals Principles of Official Statistics.
The Executive Group has carried out intensive work, such as the identification of data bases of several agencies, the preparation for standardized procedures for the project Metadata Bank at IBGE.
One of the main goals of the committee is to integrate the various database of social information derived from surveys and administrative records, in order to promote the effective coordination and governance of the national statistical system.
IV. Municipal Commissions on Geography and Statistics
IBGE invests in strengthening the principle of transparency, allowing society to know and follow the development of its activities.
In this context, IBGE has expanded the operation area of the old Municipal Census Committees, which used to be created to function only when censuses were being carried out.
Municipal Commissions on Geography and Statistics (CMGE's, in Portuguese) have been created, from 2010 Brazilian Census, in order to broaden participation of local communities in the processes and dissemination of the studies, surveys and general maps developed by the institution.
The CMGEs include the participation of representatives from IBGE, as well as executive, legislative and judicial representatives of municipalities and representatives of other local civic organizations.
V. Technical Cooperation
The following nationwide technical cooperation may be highlighted: Ministry of Health; Ministry of Education; Ministry of Cities; Ministry of Agrarian Development; Ministry of Aquaculture and Fishing; Special Secretariat of Policies for Women at the Presidency of the Republic; Ministry of Social Development and the "Fight Against Hunger" Food Program; Special Secretariat for Human Rights at the Presidency of the Republic; Ministry of Culture; National Justice Council (CNJ).
With regard to international technical cooperation agreements, the following work may be highlighted: Specialized Meeting on Statistics of MERCOSUR - the Cooperation Project in Statistics towards the integration MERCOSUR and the strengthening of its national and regional institutions through the development, improvement, harmonization and integration of the production and dissemination of statistics.
In the period of 2010-2013, IBGE has been conducting international technical cooperation agreement on technology and methodology on population and agricultural censuses; social, demographic and economic statistics with many countries.
VI. Interaction with the International Community
IBGE has extended its participation in the international Statistical community with United Nations Statistics Division -UNSD, the Statistical Conference of the Americas - SCA, the Conference of European Statistics - CES, the Organization for Economic Cooperation and Development - OECD, the World Tourism Organization - WTO, the International Labour Organization - ILO, the Community of Portuguese Speaking Countries - CPLP, BRICS, among others.
VII. Courses and Conferences for the Press and General Users
In recent years, IBGE has expanded the role of communication and the relationship with the press, as an alternative way of publicizing its work and building its image and credibility before the public.
In press conferences, the release is available for participants at the beginning of the event. At the same time, indicators and commentary on survey results are published at the IBGE's website.
Besides structural surveys, IBGE monthly publishes about ten short term data. Thus approximately 100 press conferences are held at IBGE a year.
The publication of short term data is regulated by Decree n�355, issued on November 5, 2007, and signed by the Ministry of Planning, Budget and Management. According to the decree, survey results must be sent to government officials at 7 a.m., i.e., two hours in advance of public access to the data, which happens at 9 a.m. As to access to information, IBGE releases, on this website, the list of state official who have the precedence over the public, a fact that ensures the transparency of the procedure.
Qualifying journalist is essential to improve the reports they write on IBGE surveys. In recent years, the Coordination of Social Communication (CCS) has organized several courses for journalists. Courses on more complex information were held (e.g. National account and census) as well as training for the use of digital tools that allow quick access to statistical information.
VIII. Access to the Internet and Other Access
IBGE provides several ways for accessing the information it produces, so that the public is better served: publications (books and periodicals) accompanied by CD-ROMs; free telephone consultation; a Central Library, located at the Centre for Documentation and Information Dissemination in Rio de Janeiro; a connection with the Department of Documentation and Information Dissemination at the IBGE State Units, located in all Brazilian state capitals.
IBGE provides electronic products and services that are the main media through which information such as: specific files with data on population, economy, cartography, geodesy, natural resources and environment in free access in the website (http://www.ibge.gov.br).
Besides the electronic publications the IBGE web page has two important databases to stand out: Aggregated Statistical Tables (SIDRA in Portuguese) - Database with information grouped in territorial level that allows the users to construct their own tables according and compare data to selected information; and Statistical Multidimensional Database (BME in Portuguese) - Database with micro data information that allows users to construct tables according to selected information and confidentiality constraints. This one requires Internet subscription.
A Brief Overview of The Statistical System of Russia
Federal State Statistics Service (Rosstat) is the authority responsible for production of the official statistics on social, economic, demographic, ecological and other dimensions of society.
National statistical system in the Russian Federation is based on the principals of centralized structure. The main task of the national statistical system is to provide timely, comprehensive and objective information on the socio-economic development of Russia, its regions and economic sectors to the governmental authorities at all levels, media, scientific community, business entities, population and international organizations. In order to achieve this aim Federal plan of statistical works has been developed. It defines the main directions of statistical monitoring of socioeconomic and demographical processes in the country. The Federal plan is worked out by Rosstat in cooperation with other governmental agencies and adopted by the Government of the Russian Federation.
Rosstat main functions are:
- to submit the official statistics in accordance with the established regulations to the President and the Government of the Russian Federation, Federal Assembly of the Russian Federation, other governmental entities, including regional authorities, media, legal entities and individuals, and also to international organizations;
- to develop and approve within its power the official statistical methodology for the federal statistical observation and official statistics production in accordance with the established regulations; to ensure that methodology complies with international standards and the UN Fundamental Principles of Official Statistics;
- to approve federal statistical observation forms and instructions on their completion;
- to coordinate activities in the field of official statistics while developing Federal plan of statistical works, proposals on its updating;
- to maintain, provide methodological support and conduct federal statistical observations and to process collected data;
- to develop and maintain national classifications of technical, economic and social data in accordance with the established regulations;
- to ensure within its power protection of confidential information received as a result of statistical observation;
- to provide users with official statistical and other information in accordance with established regulations;
- to implement internationally adopted statistical practices, gained from the membership of the Russian Federation in international organizations.
I. Statistical System: Principles of Organization
The national statistical system is a network of interacting governmental entities and bodies that collect, process and disseminate statistics, describing the pace of socio-economic and demographic development of the country.
The system is developed in accordance with the administrative territorial division of the country in order to ensure provision of comprehensive and objective statistics on socio-economic development of the Russian Federation, its regions, industries and economic sectors to the public authorities and all levels of government, the media, scientific community, business entities, public and international organizations.
The system comprises two organizational levels: federal, represented by Rosstat Head Office, and regional level, represented by Rosstat regional offices.
II. Federal Level of the State Statistics
Federal level of the state statistics involves Rosstat Head Office, Main Computing Centre, Scientific Research Institute for problems of socio-economic statistics, Scientific Research and Design and Technology Institute of Statistical information, Information and Publishing Center "Statistics of Russia".
III. Regional Level of State Statistics
Russian Federation is divided into 85 constituted entities (regions). In each constituent entity (republic, oblast, autonomous area, territory) Rosstat has its regional office.
Rosstat regional offices collect, process statistics, provide data to the republic, provincial and regional authorities and other users.
IV. Legal Basis of the Official Statistical Activities
Federal State Statistical Service activities are regulated by the Constitution of the Russian Federation, federal laws, Decrees of the President and the Government of the Russian Federation, international treaties of the Russian Federation.
The basis of the statistical activities in Russia is the federal law "On official statistical accounting and the system of national statistics in the Russian Federation" of 2007 (as amended).
Carrying out of major statistical surveys, such as Population Census and Agricultural Census is supported by the specific federal laws.
In order to provide Rosstat with all necessary data aiming at creating national information resources, the Government of the Russian Federation issued an act on obligatory provision of primary statistical and administrative data.
V. Emerging Challenges
Timely, accurate, reliable official statistics on social, economic, demographic, ecological and other dimensions of the society is vital for the country's socio-economic development and governance.
Nowadays the Russian statistical system is being developed in the environment of significant socio-economic changes, implementation of the international standards of financial data reporting. This transition defines the demand for new approaches in official statistics as well as creation of a flexible statistical information system, responding to changes occurring in the society.
Development of the statistical system is based on further technological modernization, implementation of new planning and decision-making methods and improvement of human resources.
The principal aspect of Russian statistics modernization is higher transparency of statistical methodology and a broader access to official statistics for all users.
The Federal task program "Development of the state statistics in Russia" has been developed to face the challenges.
The aim of the program is to continue improvement of the state statistical system and modernization of state statistics in Russia on the basis of international standards in methodology and technology of data collection, production and dissemination. The following steps have to be taken to achieve the main objective of the Project: (i) development of methodological guidelines that support practical implementation of modern global standards of data production with regard to Russian economic environment; (ii) development and implementation of modern information technologies of data collection, storage and dissemination; (iii) development of human resources of statistical service based on foreign experience as well as development of e-learning system.
A Brief Overview of The Statistical System of India
India has a federal structure of Government and the Indian Statistical System Functions within the overall administrative set up of the country. The division of responsibility for administration between the Union Government and the State Governments is on the basis of three-fold classification of all subjects, namely, the Union List, the State List, and the Concurrent List. The Concurrent list represents the subjects where both the Union and State Governments can operate, and it includes the subject Statistics. There is a further division of responsibility, by subjects or groups of subjects, among the different Ministries/Departments of the Union Government and among the Departments of State Government, on the basis of their administrative functions.
The Indian Statistical System, therefore, may be treated as both decentralized and centralized system. For example, the large-scale statistical operations conducted all over the country like Population Census, Economics Census, Agricultural Census and Livestock Census, as well as nation-wide sample surveys including the Annual Survey of Industries and the Socio-Economic Surveys are the responsibility of central agencies. Similarly, compilation of national accounts, preparation of all-India Prices and Industrial production indices are also Central activities. In the case of States, the State statistical organizations collect and generate data on a number of variables. The Central Government acts as the coordinating agency for presentation of statistics on an all-India basis even in fields where the States have primary authority and responsibility for collection of statistics. The State Directorates of Economics and Statistics (DESs) carry out the responsibility of coordination of all statistical activities at the State level and keeping liaison with the Ministry of Statistics and Programme Implementation (MOSPI) at the Centre for the purpose of maintaining uniformity and consistency in the data produced and consolidated at different levels.
I. Statistical System at the Centre
The Ministry of Statistics and Programme Implementation (MOSPI) is the nodal agency for planning and facilitating the integrated development of the Statistical system in the country including laying down norms and standards in the field of official statistics, evolving concepts and definitions, suggesting methodologies of data collection, processing and dissemination of results. The Ministry has two wings viz. National Statistical Organization (NSO), commonly called 'Statistics Wing' and the 'Programme Implementation (PI) Wing' The NSO consists of the Central Statistics Office (CSO) including Computer Centre and the National Sample Survey Office (NSSO). The Programme Implementation Wing has three divisions viz. Twenty Point Programme Division, Infrastructure Monitoring Division, and Member of Parliament Local Area Development Division. In addition to a number of publications brought out by the MOSPI, both NSO and PI wing generate a lot of statistical information which is used by policy planners, researches and other users. The MOSPI also has an autonomous Organization viz. the Indian Statistical Institute (ISI) which is a premier statistical institute of international repute.
Besides the NSO, most of the line Ministries/Departments in the Government of India dealing with different subjects such as Agriculture, Water, Health, Rural Development sectors etc. have statistical establishment to perform statistical activities for the respective Ministry/ Department, and they are generally headed by senior level statistical functionaries to facilitate proper coordination with NSO. Most of these Departments bring out respective statistical data/publications.
II. Central Statistics Office (CSO)
CSO is headed by a Director General with the headquarters located in New Delhi. It consists of five major Divisions viz. National Accounts Division (NAD), Economic Statistics Division (ESD), Social Statistics Division (SSD), Training Division and Coordination and Publication Division (CAP). In addition, CSO has a premier training institute called National Academy of Statistical Administration (NASA) located near Delhi which has been conducting national/international statistical training programmes since its inauguration in February 2009.
The Central Statistical Office is responsible for coordination of statistical activities in the country, and evolving and maintaining statistical standard. Its activities mainly include National Income Accounting; conduct of Economic Census and its follow up surveys, processing of data collected through Annual Survey of Industries and preparation of Reports, compilation of Index of Industrial Production, as well as Consumer price Indices, Gender Statistics, and imparting training on Official Statistics. CSO brings out a number of publications periodically including Statistical Year Book, Monthly Abstract of Statistics, India in figures, Energy Statistics, Infrastructure Statistics, Environment Statistics etc. besides disseminating statistical data to various national and international agencies. The other activities include preparation of Five Year Plan and Annual Plans in respect of statistical matters, holding conferences with the Central and State statistical agencies, revision of National Industrial Classification, preparation and implementation of Strategic Plans to make available data on key parameters, improving the quality and reliability of existing data sets, making available new data sets on emerging fields to meet increasing data demands, and, reducing time lag in dissemination of data.
The Computer Centre under CSO handles the data processing jobs of the MOSPI, provides training to statistical personnel on software, maintains the MOSPI's website (www.mospi.gov.in) and the National Data Warehouse of Official Statistics.
III. National Sample Survey Office (NSSO)
The NSSO functions under the overall direction of National Statistical Commission with requisite independence and autonomy in the matter of collection, processing and publication of NSS data. The NSSO is headed by the Director General and Chief Executive Officer (DG & CEO), who is also the Member-Secretary of the Steering Committee.
The National Simple Survey Office (NSSO) conducts large scale sample surveys including socio-economic surveys, Annual Survey of Industries, collection of price data for rural and urban sectors etc. besides carrying out sample checks on area enumeration and crop estimation surveys and preparation of the urban frames useful in drawing of urban samples. The major activities of the NSSO pertain to Survey Design, Field Operations, Processing of NSSO data and Publication NSSO Reports.
IV. Statistical System in the States
The Directorates of Economic and Statistics (DESs) in the States/UTs act as the nodal agencies for coordination of all statistical activities in the States/UTs. While the DES in most of the States/UTs have been formally declared by the State Governments as the Nodal Agencies on all statistical activities, the remaining few though not yet formally declared, continue to act as coordinating agency on statistical matters in the States /UT. Most of the States/UTs have District Statistical Offices (DSOs) which act as the field offices of the DESs for collection and compilation of statistical data for the districts. The DESs perform almost the same functions in the States/UTs as the NSO at the centre viz. bringing out some key statistics, coordination with the Central and State Statistical agencies, dissemination of statistics, etc.
V. Legal Support for Collection of Data
Data collection in India has been largely based on a voluntary response except for the statutory support provided through the erstwhile "Collection of Statistics Act, 1953' to collect industrial data. This Act has since been amended as the new 'Collection of Statistics Act 2008' which is much more comprehensive to enable collection of various socio-economic data. The collection of Statistics Act 2008 is administered by the Ministry of Statistics and Programme Implementation while another Act viz. Census Act 1948 is administered by the Office of the Registrar General Of India under the Ministry of Home Affairs, to collect population and other demographic data. Besides the two important Acts, there are a number of other Acts, Rules and Procedures being administered by concerned subject Ministries/ Departments, to collect statutory administrative returns which help in generating different subject related data.
VI. Emerging challenges
The Indian Statistical system has played an important role in facilitating informed decision-making, and greatly contributed to planned social and economic development in the country. A large variety of data is produced by the statistical system and extensive statistical data bases have been created which help in meeting the data requirements of not only the internal agencies but also the international agencies, besides a large number of other users such as researchers. The system is undergoing steady transformation to meet ever increasing information needs following challenges arising out of the globalization and liberalization of economy. It involves many significant structural and operational changes in the statistical system both at the Centre and in the State. It includes constitution of National Statistical Commission (NSC) to revamp the statistical system in the county with a view to improve the credibility, timeliness and adequacy of data. A comprehensive India Statistical Strengthening Project (ISSP) has been initiated with the collaboration of the World Bank to strengthen the statistical system in the states, in addition to an extensive programme undertaken to strengthen statistical capacity and infrastructure at sub-state level.
Further, keeping in view the need to modernize the statistical system, there is an increasing thrust on deploying latest information and communication technology in data collection, data management and data dissemination for improving efficiency of statistical operations and activities. For example, e-collection of industrial and price data has been in operation already and e-system for the dissemination of various data including e-publication has been initiated to facilitate wider and speedier access of such data. Steps are also being taken to accelerate e-governance to engage citizen's directly in the process of data sector reforms. Indeed, the official statistical system is relentlessly gearing up to meet growing aspiration of different stakeholders in the emerging fast-changing environment by providing requisite data as reliably and timely as possible, besides undertaking appropriate measures to upgrade statistical skills and capacity through elaborate training programmes and promoting coordination between Central and State statistical agencies.
A Brief Overview of The Statistical System of China
Since its establishment, National Statistical System of the People's Republic of China has been developed and improved during the 60-year process of reform and adjustment to meet the demands for the new conditions and situation. The Statistical Law of the People's Republic of China stipulates that the State shall establish a centralized and unified statistical system, with a statistical administrative structure under unified leadership and with each level assuming responsibility for its own work.
The government statistical system comprises the government comprehensive statistical system and the government departmental statistical system. The government comprehensive statistical system is consisted of the statistical institutions established through a top-to-down model and relevant statistical staff from all the administrative levels. National Bureau of Statistics of China is established under the State Council, independent statistical institutions are established in local governments at and above the county level, and governments of townships and towns are staffed with full-time or part-time statisticians, who are responsible for the specific coordination and administration of the statistical work in their respective administrative areas. The government comprehensive statistical system adopts the management model as "unified leadership and decentralized administration"
I. Government Comprehensive Statistical System
1) National Bureau of Statistics of China
As an organ directly under the State Council, the National Bureau of Statistics of China (NBS) is responsible for directing and coordinating the statistical work throughout the country and national economic accounts. In the entire national statistical system, NBS is a main provider of national statistical data and a coordinator of the government departmental statistics and local statistics. Pursuant to the Statistics Law of the People's Republic of China, the main function of NBS is to be responsible for organizing, directing and coordinating the statistical work throughout the country, to formulate statistical policy and planning, basic national statistical system and unified statistical standards, approve the statistical standards of departments, draw up a plan or scheme for important general surveys of the national conditions and strength jointly with the departments concerned, organize and conduct the important general surveys of the national conditions and strength such as Population Census, Economic Census and Agricultural Census, organize and conduct the statistical survey of key industries of the economy, collect, aggregate, collate and provide the statistical data related to the surveys, and synthetically collate and provide the basic national statistical data, and to check, administer and publish the basic national statistical data and publish periodically the statistical data related to national economy and social development, and to administer the departmental and local statistical survey programs by law.
NBS has, divided by professional and function, set up 18 administrative units at departmental level, 2 institutions operating as administrative units, 10 institutions (in Beijing) and China Statistics Press directly under NBS. According to the needs of its work, NBS establishes Survey Offices in each province (municipality, autonomous region) and a survey team in each city (prefecture, autonomous prefecture and league) and in one-third of counties (cities at county level, districts and banners), which are as agent organs of NBS and vertically administrated under NBS, and are mainly responsible for the surveys of key statistical data required for the macroeconomic control and national accounts assigned by NBS mainly through sampling surveys.
2) Local Bureau of Statistics
Independent statistical institutions are established in local governments at and above the county level, and statistical stations are established or statisticians are staffed in the people's governments of townships and towns, who are responsible for carrying out their tasks of State statistical surveys and for organizing, guiding and coordinating the statistical work in their respective administrative areas. The statistical institutions of local governments at various levels are subordinated to the dual leadership of the governments at their level and the statistical institutions at higher level, in terms of statistical work, mainly under the leadership of the statistical institutions at higher level.
II. Departmental Statistical System
The ministries of the State Council and departments of local governments at various government levels do, according to the needs of their statistical work, establish statistical institutions and staffed with statisticians, forming a departmental statistical system. The main function of departmental statistical system is to organize and coordinate the statistical work within the departments, to execute the tasks of State and local statistical surveys, to draw up and carry out statistical survey plans within the departments and to collect, compile and provide statistical data, to make statistical analysis and exercise statistical supervision over the implementation of plans of the departments and of the enterprises or institutions under their jurisdiction. As a main system of statistical work, the national statistical system has the power to direct and coordinate the statistical work in the departmental statistical system.
III. Statistical Laws and Regulations
Whether statistical institutions or statistical set-ups in enterprises and institutions, must comply with the national statistical laws and regulations and conduct statistical surveys according to the statistical indicator systems and statistical survey methodologies formulated by NBS.
Statistical legal system in China comprises the statistics law ("Statistics Law of the People's Republic of China"), administrative regulations (including Regulations for Census and Regulations for Customs Statistics), administrative rules, regulatory documents (including the Interim Measures for Survey Programs of Departmental Statistics, the Measures for Administration on Foreign-Related Surveys and the Measures for Administration on Approval of Statistical Surveys) and local statistical regulations and rules. Pursuant to the Statistics Law of the People's Republic of China, State statistical survey programs are worked out by NBS, or jointly with the relevant ministry or ministries of the State Council, and are submitted to the State Council for documentation, but important programs shall be reported to the State Council for examination and approval. Statistical survey programs of departments are worked out by the relevant ministries or departments of the State Council and are reported to the statistical institution at the same level for the documentation or examination and approval. Local statistical survey programs are worked out by statistical institutions of local governments at and above the county level, or by statistical institutions of local people's governments at and above the county level jointly with the relevant department or departments, and shall all be reported to the statistical institution at the higher level for the documentation or examination and approval. In drawing up a plan for statistical survey programs, it is necessary to draw up simultaneously appropriate statistical survey system, which shall be reported for examination and approval or for the documentation. A statistical survey system shall stipulate survey objective, scope and coverage, methods, respondents, organization, forms or questionnaires, and submission and release of statistical data. A statistical survey shall be organized and conducted under a statistical survey system approved. Any change of the contents of statistical survey system shall be submitted to the original examination and approval authority for approval, or to the original registration authority for the documentation.
IV. Statistical Survey
NBS collects statistical data mainly through periodical censuses and current statistical surveys, and sorts out statistical data through ad hoc surveys, typical surveys and administrative registry records. At present, the important general surveys of the national conditions and strength by NBS include Population Census, Agricultural Census and Economic Census, and 48 current statistical surveys, including national accounts, agriculture, industry, energy, investment, construction, trade and external economy, services, urban and rural households, price, society and science and technology, labor force, wages and salaries, are organized and conducted. These surveys cover main aspects of economy, society, population, environment and resources. The contents of both the censuses and surveys basically cover all the aspects concerning with economy, society, population, environment and resources.
The government departmental statistics involve traffic, tourism, finance, banking, import and export in customs, utilization of foreign capital, culture, education, health, science and technology, registry of permanent residence, social development, etc.
V. Release and Provision of Statistical Information
In order to provide the official statistics and products on China to the whole society and international community more in quantity, shorter in time lag, and better in quality, NBS releases statistical survey data and supplies with value added products via statistical processing through various channels and in various ways. For the time being, a system of regular releases of statistical information has been established, including various well-arranged types, such as press conference, internet release, public data bank and publications, "Statistics Info" through WeChat, official mobile information service platform and mainly varieties of yearbooks which enable the release and provision of statistical data and products more efficiently, widely and richer in content. In addition, the statistical institutions in 31 provinces, autonomous regions and municipalities, as well as many cities and counties have also formed their own relevant regular patterns for timely data release, which forms a hierarchical and widely covered layout for statistical data release and provision in China.
VI. The Main Targets and Latest Development of China's Statistics
The transformation of Chinese economy to the market system is under way with rapid and profound development, which has posed higher requirements on the China's statistical system. As to these all new requirements, the Chinese national statistical system is making its great efforts to enhance the statistical capacity, improve statistics quality and the credibility of official statistics, and to mend the pace of modern service-oriented statistics. Since 2012, in order to reform the statistical production modes, NBS has implemented the Four Major Programmes on industrial enterprises above designated size, wholesale and retail and catering businesses above designated size, qualified construction enterprises and real estate development enterprises. Up to now, a true and complete, timely updated business registry of establishments has taken into shape; a standardized system of integrated questionnaires for business surveys has been worked out; a comparatively convenient and applicable data collection and processing software has been developed; a comparatively safe and efficient online reporting system for business statistics has been set up and used all over China. The successful implementation of the Four Major Programmes symbolized the profound reform of the statistical production modes, and initially realized the whole processes from program design, task deployment, to data collection, processing, transmission, storage, processing for analysis electronically, efficiently and by intranet in our statistical work. In these four areas, the design of the survey programs and the task deployment are unified, the data collection and data sharing are monitored at various levels. The coverage of the Four Major Programmes will be continuously expanded, the service functions of the direct online reporting system will be actively developed, and a modernized service-oriented statistical system for users, for local statistical grassroots, and for survey respondents will be constructed in the national Statistical system of China.
A Brief Overview of The Statistical System of South Africa
The South African Statistical system is nearly 100 years old, but has only served the needs of all its peoples for a relatively short period. The advent in 1994 of the democratic dispensation provided the production of statistics with two organizational model options for transformation. The first model was to centralize the production of most of the statistics into a single agency, the national statistical office (NSO) which was the then Central Statistical Service (CSS). The CSS was later transformed into Statistics South Africa (Stats SA) consisting of a head office and branches in the provinces, and much later on regional offices were established at sub-provincial level. The minority of the statistics excluded from centralization were largely of a financial nature such as the balance of payments. These would be generated by the relevant agencies including the South African Reserve Bank (SARB) and the National Treasury (NT). Indeed the feeling that centralization was the way to go was prevalent both within Stats SA and in other organs of state. The second model was to decentralize the production of most of the statistics whereby the various organs of state would produce statistics on the basis of their specialist subject areas. Naturally statistics-producing organs of state would constitute a statistical production system which would require coordination. The model ultimately adopted was a product of an evolutionary process. Statistical production faced four major pressures which overlapped in some areas. First was ideological transformation from a focus on "own affairs" of the apartheid political dispensation to a focus on integration of the total population and geography of the new state. This translated into transformation of the demographics of the CSS, integration of the Bantustan statistics offices into the CSS, and establishment of provincial CSS offices to facilitate data collection by head office. Second was the data gap facing the new government with regard to policy and programme development. Alleviation of poverty and inequality, especially service delivery, and the provision of developmental opportunities was unquestionably urgent. This provided the imperative for the 1996 census of population and housing. Third was the rationalization of the statistical series produced so they could be relevant to the aspirations of the citizenry. The rationalization included the introduction of the production of social statistics in addition to the existing economic statistics. Fourth was the drive to improve the quality of the statistics produced by the NSO.
Although they are still around at different levels of intensity, the pressures mentioned above were most intense during, and coincided with, the tenure (1995-99) of the first head of the CSS which later became Stats SA. During this period the transformation model of statistical production was the centralize done. However, overtime it had become increasingly clear that Stats SA had very limited capacity to cater for most statistical needs of users. In the same breath the potential of other organs of state for filing the gap between what Stats SA produced and what users needed was recognized. Acknowledgement of the current Statistics Act (No. 6 of 1999). The Act specifically provided for Statistician-General as executive head of Stats SA as well as coordinator of statistics produced by other organs of state. It was a land marking the production of statistics in the country because it defined a new direction for the strategic and work programmes of Stats SA as well as defining the role of other organs of state in the production of statistics. Incidentally the Act coincided with the change of name of the NSO from CSS to Stats SA.
In 2000 a new head took over the reins at Stats SA and immediately embarked on a new vision for statistical production in the county. Although the new vision was as yet to be formally defined, it was hinged on coordination of statistical production. A national Statistics Systems Division (NSSD) was established at Stat SA to tease out the coordination process. The NSS concept became a Cabinet Lekgotla of January 2002. Although the SANSS was included in the Programmes OF Action (POA) of the government, for the next eight years or so it lacked prominence especially at Stats SA for three main reasons. First was the relatively perennial capacity constraint. Second and most significant was the continued pressure to get Stats SA as an entity to work more effectively and efficiently with particular regard to the quality of its own products. The third was the challenge of change management.
It was not until 2009 that the NSS concept influenced the strategic direction of Stats SA. Since then the department's five-year strategic plan and the annual work programme have undergo a strategic shift that emphasizes implementation of statistical coordination as mandated by the Statistics Act [3, 4]. As its new vision and mission indicate, the department has assumed a leadership position by partnering with other organs of state to advance statistical development in the county. The shift has been widening of statistical production beyond the product of Stats SA to setting up a system to support other organs of state to produce statistics of good quality. The objectives of the shift are to expand the production of statistics in order to increase the supply of official statistics and to address the gap in statistical quality. Of the six strategic objectives of Stats SA, three directly address statistical coordination. The first objective is "to expand the information base by increasing its depth, breadth and geographic spread". The strategy is to translate the government's 12 priority development outcomes identified in the Cabinet Lekgotla of 20-22 January 2010 [5] into Stats SA ' 10 statistical themes that constitute the universe of statistical production [3:30] (see Table 1). Strategic focus areas include health, education, safety and security, sustainable resource management, rural development, food security and land reform. The second objective is "to enhance public confidence and trust in statistics". Focus areas for this objective include developing a quality management system for the SANSS, setting standards for the SANSS, assessing statistics for quality and certifying them official where applicable, and development and maintenance of dwelling and business frames for standardizing data collection areas to enhance data comparability. The third objective is "to lead the development and coordination of statistical production within the SANSS". This is where the SANSS performs a transformation function of the fragmented statistical system to an integrated one focused on the production of official statistics.
 | This document has been published on 24Sep14 by the Equipo Nizkor and Derechos Human Rights. In accordance with Title 17 U.S.C. Section 107, this material is distributed without profit to those who have expressed a prior interest in receiving the included information for research and educational purposes. |