| Information |  | |
Derechos | Equipo Nizkor
| ||
| Information | | |
Derechos | Equipo Nizkor
| ||
26Oct14
Aggregate Report on the Comprehensive Assessment
Contents 1.1 Comprehensive assessment
1.2 Outcomes of the comprehensive assessment
1.3 Structure of this report
1.4 Comprehensive assessment in numbers2 Nature of the comprehensive assessment
2.1 Rationale
2.2 Components
2.3 Execution
2.4 Characteristics of the comprehensive assessment3 Scope of the exercise and methodological overview
3.1 Participating banks
3.2 Overview of the methodology
3.3 Risks not addressed in the comprehensive assessment4.1 AQR quality assurance
4.2 Stress test and join-up quality assurance
4.3 Supervisory dialogue5 Aggregate outcomes of the comprehensive assessment
5.1 Projected capital change under the comprehensive assessment
5.2 Shortfall identified by the comprehensive assessment6.1 Harmonisation of asset quality metrics
6.2 AQR adjustments to asset carrying values
6.3 Remedial actions to be implemented by banks following the comprehensive assessment7 Stress test and join-up with AQR outcomes
7.1 Outcomes of the stress test
7.2 Quantitative findings of the stress test by key drivers8.1 Capital quantity
8.2 Capital composition9.1 List of participating banks in the comprehensive assessment and peer groups
9.2 Detailed results
9.3 List of acronyms and abbreviations
9.4 Bibliography
9.5 Geographic clusters used for analysis of collateral value adjustmentsList of figures
Figure 1 Gross AQR adjustment by country of participating bank Figure 2 Comprehensive assessment median projected adverse scenario reduction in capital ratio by country of participating bank Figure 3 Comprehensive assessment capital shortfall by main components Figure 4 Comprehensive assessment capital shortfall by country of participating bank Figure 5 Schematic of AQR work blocks Figure 6 Illustration of risk-based portfolio selection, credit RWA coverage Figure 7 Illustration of risk-based portfolio selection, number of portfolios Figure 8 Selected exposures by asset class Figure 9 Selected exposures by debtor geography Figure 10 GDP impact across CEBS/EBA EU-wide stress test exercises in the euro area, deviation between adverse and baseline Figure 11 AQR quality assurance model Figure 12 Overview of AQR quality assurance checks Figure 13 Quality assurance correction process Figure 14 Example where two or more impairment triggers hit and debtor remains performing, as percentage of total performing debtors pre- and post-QA Figure 15 Example of the impact of credit file review QA on the haircut applied to the large corporate aggregate market value of collateral in one Member State Figure 16 Comprehensive assessment adverse scenario impact on capital Figure 17 Comprehensive assessment adverse scenario impact on capital ratios Figure 18 Comprehensive assessment projected adverse scenario impact on capital by country of participating bank Figure 19 Development of CET1 ratio distribution by participating bank Figure 20 Comprehensive assessment shortfall by main components Figure 21 Capital shortfall by component of the comprehensive assessment by country of participating bank Figure 22 Capital shortfall by country of participating bank Figure 23 Capital shortfall grouped by bank stress test balance sheet type and RWA size group Figure 24 Capital shortfall bank distribution Figure 25 Bank internal NPE definition compared to key EBA ITS simplified NPE approach Figure 26 Bank classification of derivative and non-derivative holdings under the IFRS 13 fair value hierarchy Figure 27 Gross AQR adjustment by country of participating bank Figure 28 Impact of the AQR by component Figure 29 Summary of impact of provisions by asset class Figure 30 Impact of the credit file review by driver Figure 31 Number of reclassified NPEs by country of participating bank Figure 32 Change in provisions and coverage ratio by asset class for reclassified NPEs Figure 33 Change in provisions and coverage ratio by asset class for going and gone concern existing NPEs Figure 34 Pre- and post-AQR coverage ratio by asset class for going and gone concern existing NPEs Figure 35 Collateral valuation adjustments throughout the AQR Figure 36 Collateral value reduction for selected real estate property types Figure 37 Collateral value adjustment by location of real estate collateral Figure 38 Real estate collateral valuation adjustment by year of last appraisal Figure 39 Real estate valuation adjustment by reappraisal type (only reappraised properties) Figure 40 Provision increases for the shipping industry by country of participating bank Figure 41 Impact of projection of findings on non-retail provisioning Figure 42 Additional collective provisions by type of provision Figure 43 Additional specific retail provisions by asset class Figure 44 Additional specific provisions by debtor geography Figure 45 Additional IBNR by AQR asset class Figure 46 Additional IBNR by SSM debtor geography Figure 47 Impact of the AQR fair value exposures review by component Figure 48 AQR adjustment of revaluations grouped by RWA of participant bank Figure 49 AQR impact of the CVA review and main drivers Figure 50 AQR impact of the CVA review grouped by RWA of participating banks Figure 51 Models classified depending on outcome of the AQR review, and AQR impact of the derivative pricing model review, by type of issue Figure 52 Impact of the stress test on the aggregate CET1 capital by country under the adverse scenario in � billion and in percentage of RWA Figure 53 Aggregate stress test impact by risk driver under the baseline scenario Figure 54 Aggregate stress test impact by risk drivers under the adverse scenario Figure 55 Decomposition of loan losses across portfolios and banks under the baseline and adverse scenario Figure 56 Net interest income development across banks under the baseline and adverse scenario Figure 57 Net fee and commission income development across banks under the baseline and adverse scenario Figure 58 Sovereign losses on AFS and FVO portfolios across banks under the baseline and adverse scenario Figure 59 RWA development across banks under the baseline and adverse scenario Figure 60 Development of administrative and other operating expenses as an aggregate across banks under the baseline scenario Figure 61 Distribution of changes to CET1 ratios across banks following a static vs. dynamic balance sheet assumption under the baseline and adverse scenarios Figure 62 Join-up impact by bank in relation to AQR adjustments Figure 63 Total absolute and relative impact of join-up by country of participating bank under the adverse scenario Figure 64 CET1 impact of join-up by type (credit vs. other effects) under the baseline scenario Figure 65 CET1 impact of join-up by type (credit vs. other effects) under the adverse scenario Figure 66 Cumulative aggregated equity increase 2008-2013 Figure 67 Breakdown of capital actions undertaken by significant banks in 2014 Figure 68 CET1 issuance by country of participating bank, including issuances between 1 January and 30 September 2014 Figure 69 Aggregated capital actions undertaken by participating banks in 2014 Figure 70 Capital actions by participating bank, 1 January to 30 September 2014 Figure 71 Impact of capital actions on the aggregated capital shortfall Figure 72 Bank-level leverage ratios by country of participating banks Figure 73 Leverage ratio bank distribution Figure 74 Total transitional adjustments by country of participating banks as of 1 January 2014 Figure 75 Bank-level impact of transitional adjustments to CET1 Figure 76 Stock of DTAs requiring future profitability, pre-AQR List of tables
Table 1 Participating banks with a shortfall Table 2 Balance sheet used for the stress test Table 3 Impact of application of EBA ITS simplified NPE approach and the credit file review by AQR asset class Table 4 Summary of AQR adjustment by component Table 5 Distribution of impairment triggers for reclassified NPEs Table 6 Illustration of provisioning impact of the projection of findings split by portfolio type Table 7 AQR impact of revaluations by asset class (total value examined in portfolio samples) Table 8 Total impact by stress test component Table 9 Phase-in percentages applicable to the majority of CET1 deductions Table 10 Phase-in percentages applicable to the deduction of DTAs that rely on future profitability and existed prior to 1 January 2014 Table 11 List of participating banks in the comprehensive assessment and inclusion in peer groups Table 12 CET1 ratios for participating banks (%) Table 13 Buffer (+) / shortfalls (-) for participating banks (� billion) Table 14 AQR adjustment by bank and asset class (� million)
The ECB conducted the comprehensive assessment to prepare for assuming banking supervision tasks in November 2014. This resulted in aggregate adjustments of �48 billion to participating banks' asset carrying values which will be reflected in their accounts or in supervisory capital requirements. Overall, the exercise has identified capital shortfalls for 25 banks, totalling �25 billion. After accounting for equity already raised this year as well as agreed restructuring plans, shortfalls remain at 12 banks. Banks will be required to fill these shortfalls within six to nine months.
The European Central Bank (ECB) will assume banking supervision tasks in November 2014 in its role within the Single Supervisory Mechanism (SSM). In preparation, the ECB has conducted a comprehensive assessment of 130 |1| banks. The stated objectives of this exercise were to:
- Strengthen banks' balance sheets by repairing the problems identified through the necessary remedial actions.
- Enhance transparency by improving the quality of information available on the condition of the banks.
- Build confidence by assuring all stakeholders that, on completion of the identified remedial actions, banks will be soundly capitalised.
This report provides an overview of the approach taken and presents the results of the exercise.
The comprehensive assessment was broad in scope. The 130 credit institutions included in the exercise (i.e. "the participating banks" |2|) had total assets of �22.0 trillion, which accounts for 81.6% of total banking assets in the SSM. |3|
The comprehensive assessment consisted of two components.
1) The asset quality review (AQR) was a point-in-time assessment of the accuracy of the carrying value of banks' assets as of 31 December 2013 and provided a starting point for the stress test. The AQR was undertaken by the ECB and national competent authorities (NCAs), and was based on a uniform methodology and harmonised definitions. The scale of the exercise was unprecedented; it provided a thorough health check of the banks that will be subject to direct supervision by the ECB.
The exercise was based on the Capital Requirements Regulation and Directive (CRR/CRD IV), on the definition of regulatory capital as of 1 January 2014. Under the AQR, banks were required to have a minimum Common Equity Tier 1 (CET1) ratio of 8%.
2) The stress test provided a forward-looking examination of the resilience of banks' solvency to two hypothetical scenarios, also reflecting new information arising from the AQR. The stress test was undertaken by the participating banks, the ECB, and NCAs, in cooperation with the European Banking Authority (EBA), which also designed the methodology along with the ECB and the European Systemic Risk Board (ESRB). Under the baseline scenario, banks were required to maintain a minimum CET1 ratio of 8%; under the adverse scenario, they were required to maintain a minimum CET1 ratio of 5.5%.
The AQR respected current accounting and prudential regulation, including the CRR/CRD IV capital rules. |4| In some areas the ECB's methodology involved additional prudential prescription to accounting concepts in order to achieve consistency and adequate conservatism. The results are of a prudential nature. AQR-adjustments were made, often in cases where banks were not breaching accounting rules. However, it is expected that many banks will likely choose to reflect many of these changes in their accounts. Examples of areas in which additional prescription was provided include impairment triggers, the calculation of individual specific provisions, and collateral valuations.
The stress test is not a forecast of future events, but a prudential exercise to address banks' ability to withstand weaker economic conditions. In the stress test, banks' projections were subject to centrally defined requirements in order to ensure appropriate conservatism and high-quality output. For example, balance sheets were assumed to remain constant over the stress test horizon in terms of total exposure volume, maturity and product mix (i.e. the static balance sheet assumption). |5|
Within both components, the approach taken aimed for a rigorous and consistent exercise, emphasising a "level playing field" between banks.
Within the AQR, a detailed asset-level review was performed for over 800 specific portfolios making up 57% of the banks' risk-weighted assets. This resulted in the detailed analysis of more than 119,000 borrowers; the assessment of the valuation of about 170,000 collateral items; the building of 765 models to "challenge" the banks' own estimates of collectively assessed provisions and over 100 models to assess their CVA calculation; the revaluation of over 5,000 of the most complex fair value exposures; and the review of over 100 complex valuation models. This in-depth review employed over 6,000 experts at its height.
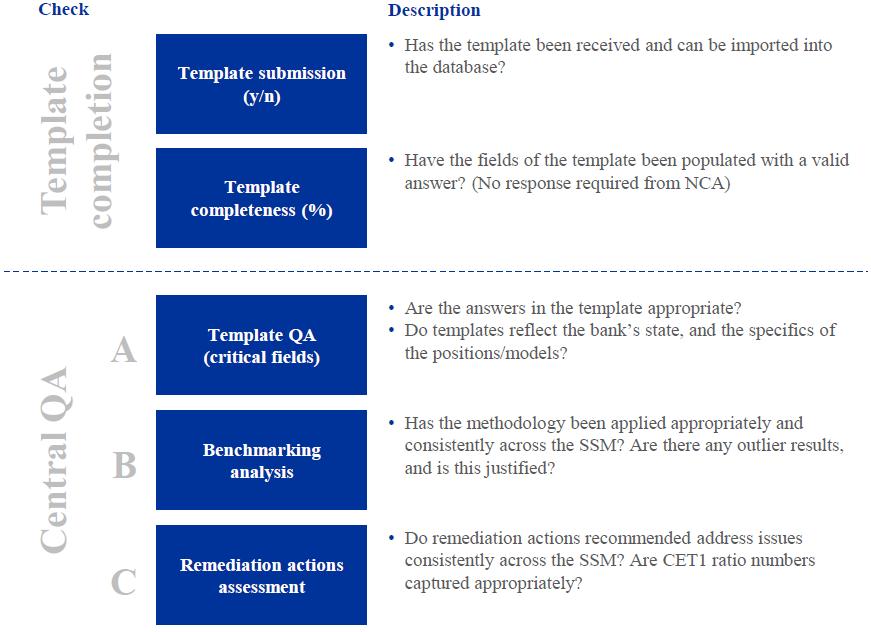
In order to maintain consistency and equal treatment across both the AQR and stress test, central ECB teams independently performed quality assurance on the work of the banks and NCAs. The ECB was in close contact with NCAs, responding to over 8,000 methodology and process questions. The ECB reviewed and challenged outcomes from an SSM-wide perspective using comparative benchmarking, as well as engaged with NCAs to investigate specific issues that arose. Over 100 experts from the ECB along with external support professionals were involved in this quality assurance activity.
1.2 OUTCOMES OF THE COMPREHENSIVE ASSESSMENT
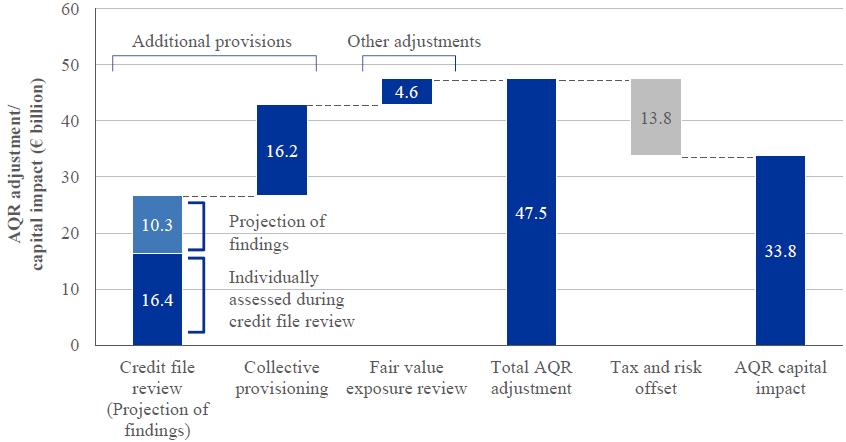
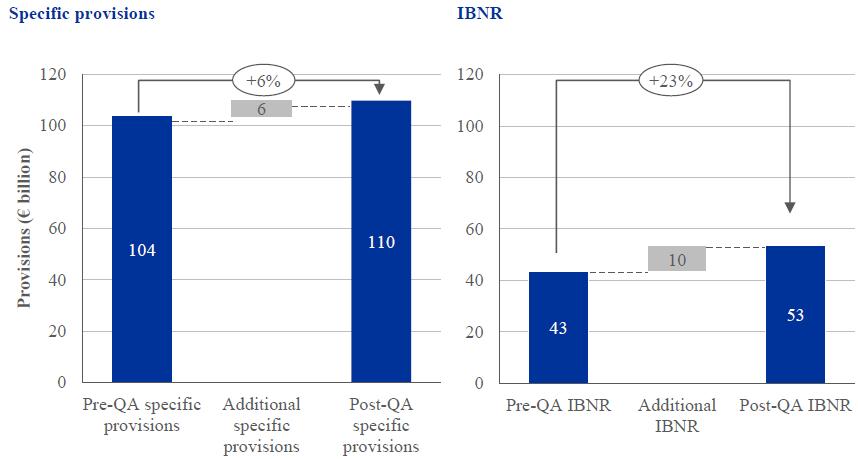
The AQR resulted in aggregate adjustments of �47.5 billion to participating banks' asset carrying values as of 31 December 2013. These adjustments originated primarily from accrual accounted assets, particularly adjustments to specific provisions on non-retail exposures. Additionally, non-performing exposure (NPE) stocks were increased by �135.9 billion across the in-scope institutions, as NPE definitions were moved onto a harmonised and comparable basis, including the examination of forbearance as a trigger of NPE status.
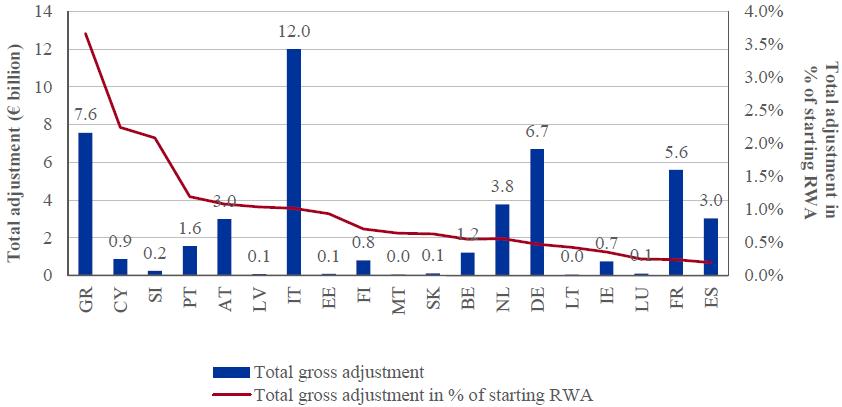
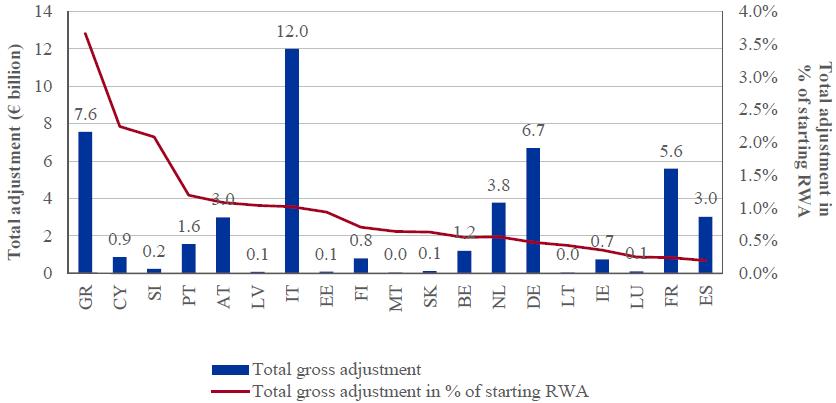
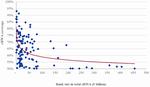
The prudential and accounting implications will be assessed by the SSM's new Joint Supervisory Teams (JSTs) along with the qualitative conclusions of the exercise regarding, for example, the soundness of banks' internal processes. This will mean that even where banks do not reflect adjustments in their accounts all conclusions will be captured in ongoing supervision and in supervisory capital requirements. As Figure 1 shows, the AQR adjustments differ by jurisdiction as consistent standards have been applied where previous approaches may have diverged.
Figure 1 Gross AQR adjustment by country of participating bank

Click to enlargeIn addition to adjustments made directly to current carrying values, the AQR result was also reflected in the projection of banks' capital adequacy under hypothetical scenarios performed in the stress test.
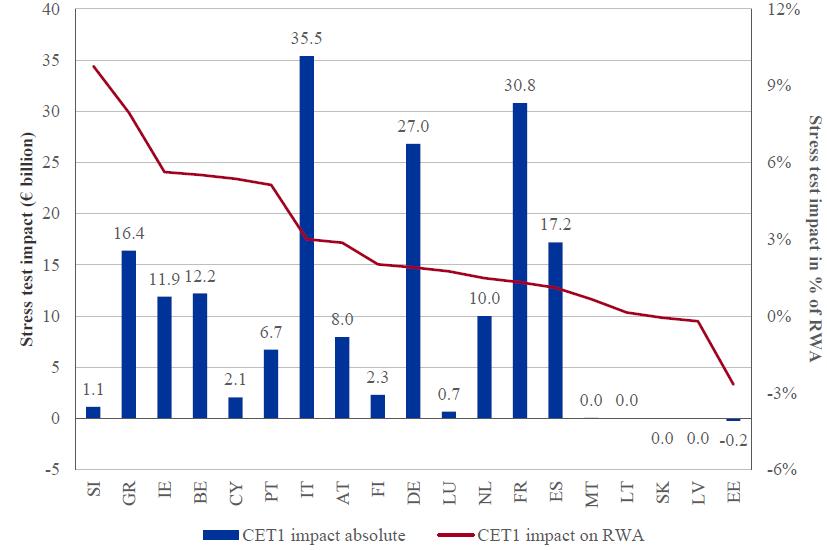
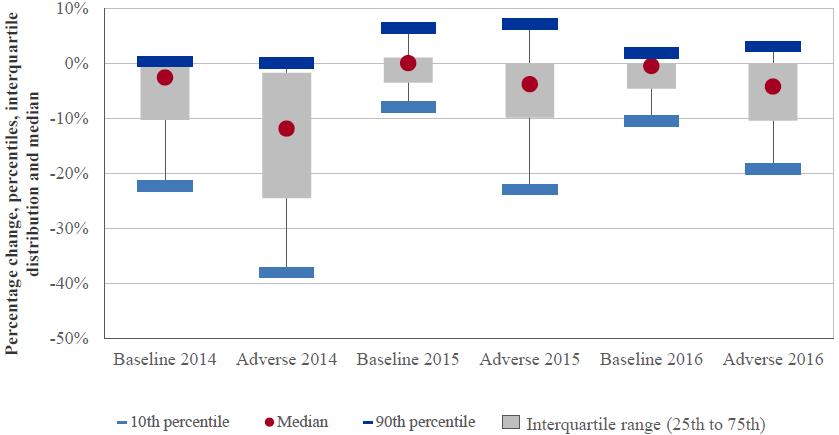
Under the adverse scenario, the banks' aggregate available capital is projected to be depleted by �215.5 billion (22% of capital held by participating banks) and risk weighted assets (RWA) to increase by about �860 billion by 2016; including this as a capital requirement at the threshold level brings the total capital impact to �262.7 billion in the adverse scenario.
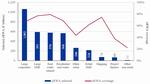
This capital impact leads to a decrease of the CET1 ratio for the median participating bank by 4.0 percentage points from 12.4% to 8.3% in 2016. The reduction in the median CET1 ratio projected for banks in each country is shown in Figure 2.
Figure 2 Comprehensive assessment median projected adverse scenario reduction in capital ratio by country of participating bank
Click to enlargeAlthough not fully comparable, the median projected CET1 ratio reduction in the Comprehensive Capital Analysis and Review (CCAR) carried out in the United States in 2014 was 2.9% |6| ; it was 3.9% in the AQR and stress test carried out in Spain in 2012 |7| , and 2.1% in the EBA stress test carried out in 2011 |8| .
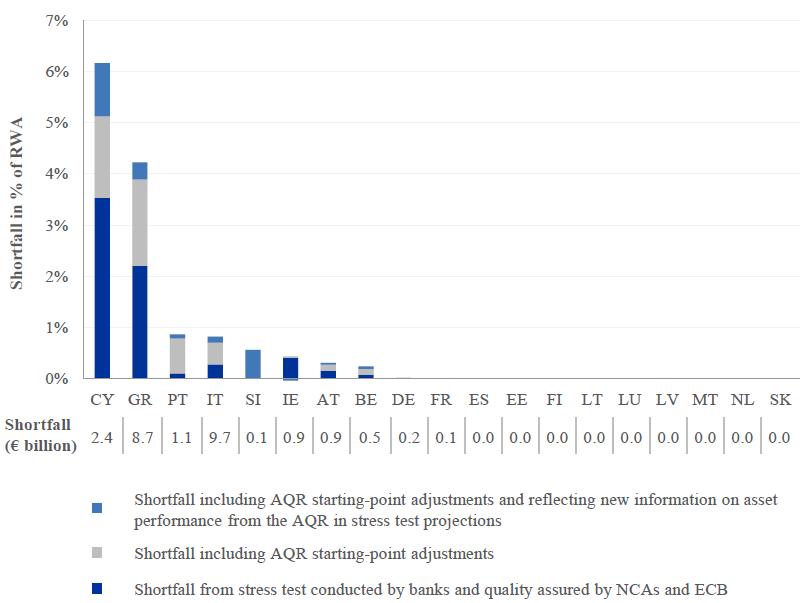
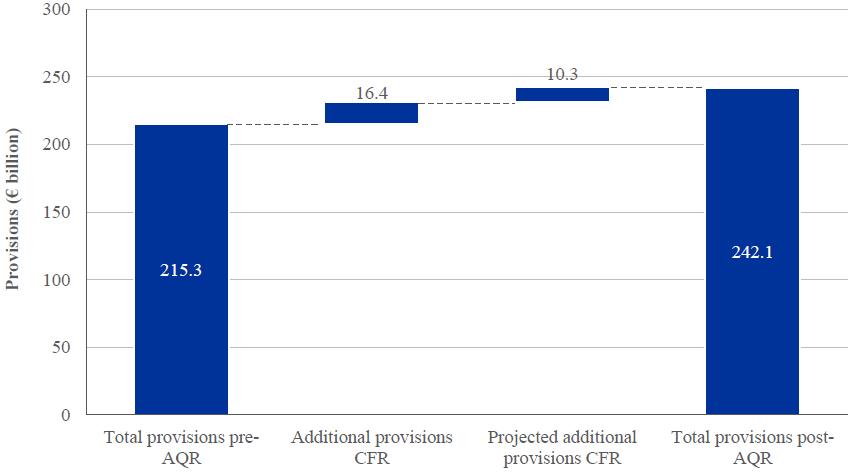
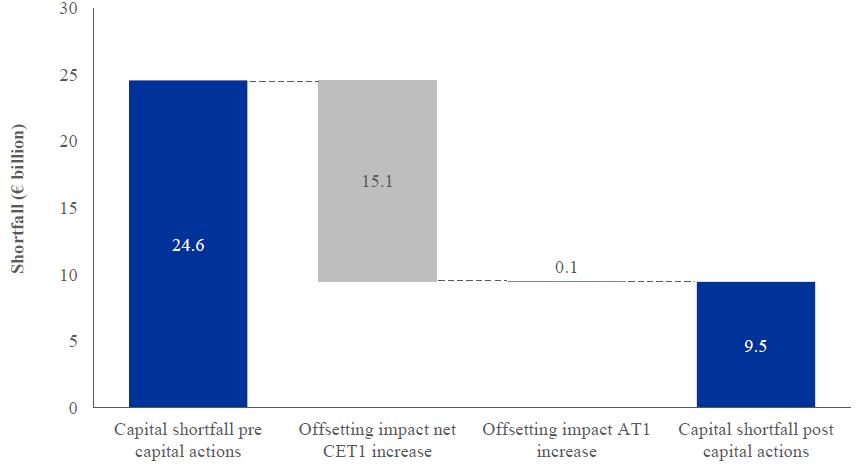
Overall, the comprehensive assessment identified a capital shortfall of �24.6 billion across 25 participating banks after comparing these projected solvency ratios against the thresholds defined for the exercise. |9|
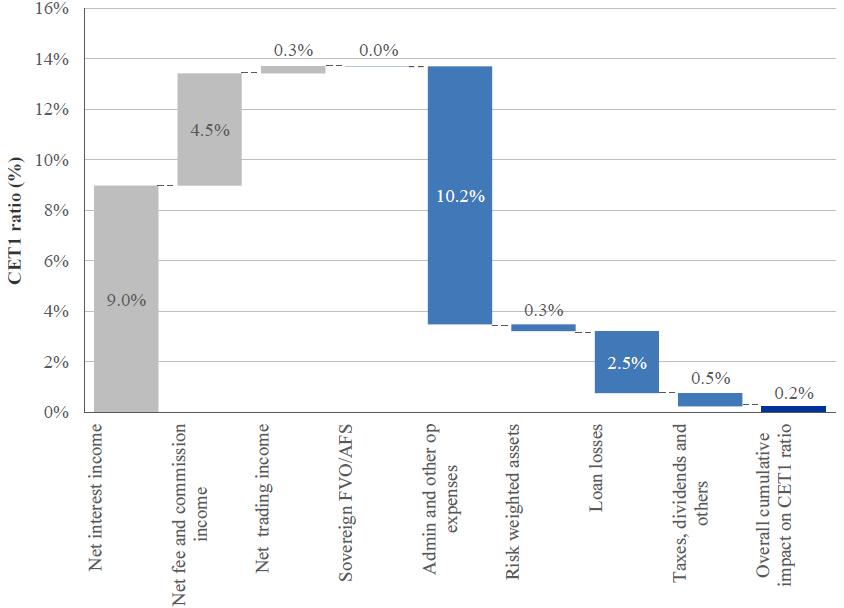
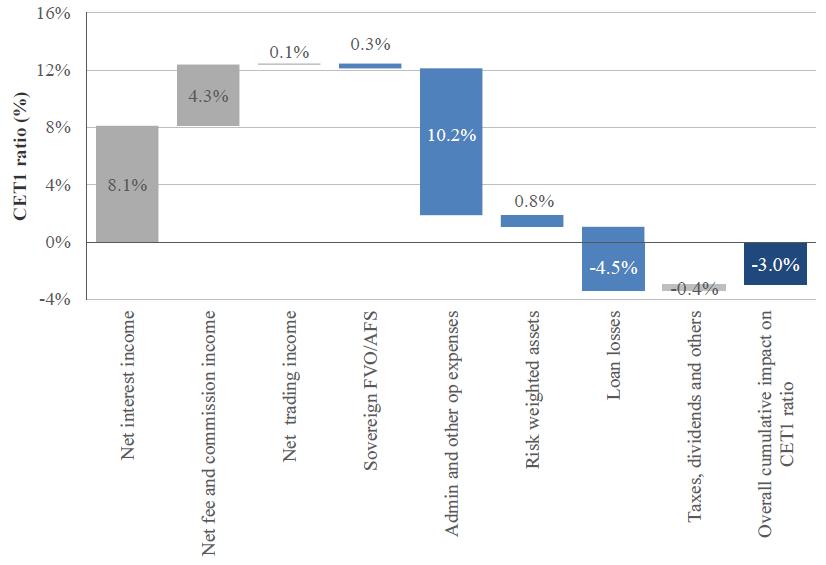
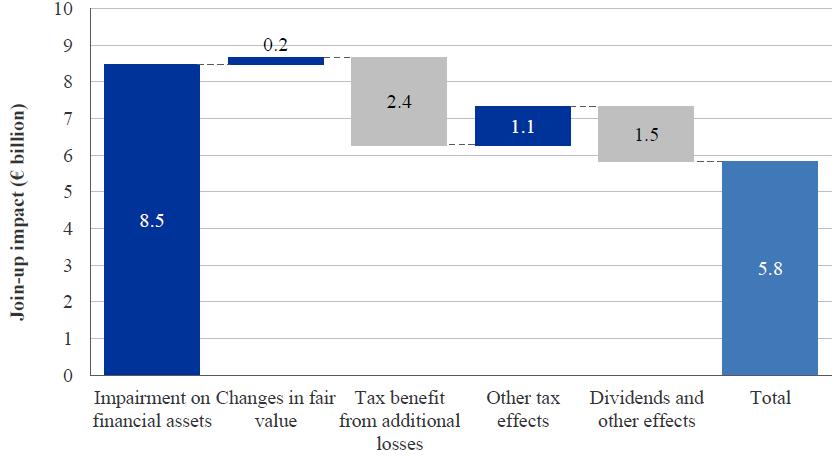
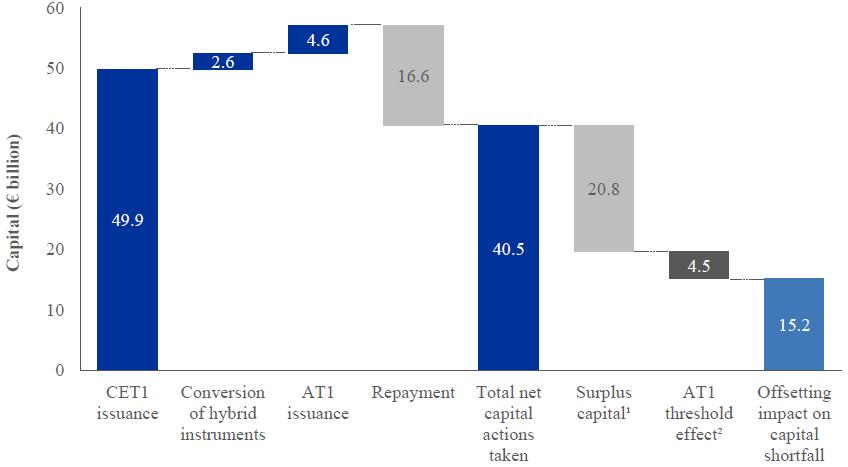
The �24.6 billion shortfall can be disaggregated into three components. The amount of shortfall that arose from the stress test conducted by the banks and quality assured by the ECB was �11.2 billion before making any adjustments due to AQR results and after accounting for all existing capital buffers as of 31 December 2013. The inclusion of the reduction in starting-point available capital due to AQR adjustments increases this shortfall to �21.9 billion. Finally, the reflection of the new information on asset performance learned through the AQR in the stress test projections resulted in the full shortfall of �24.6 billion. These impacts are illustrated in Figure 3.
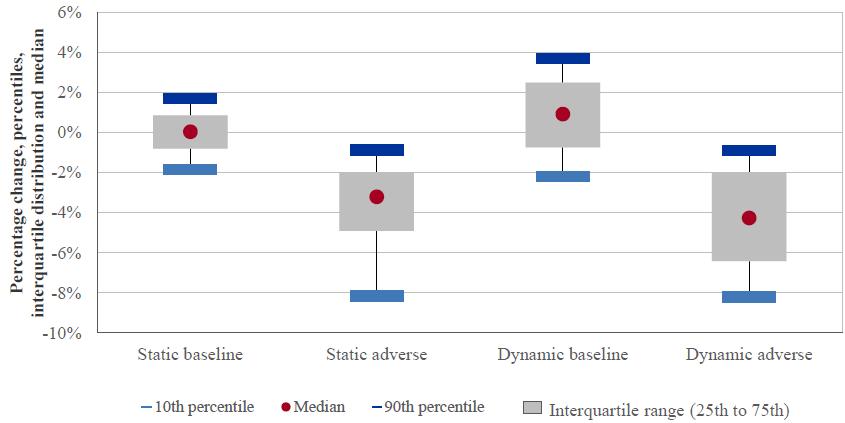
Figure 3 Comprehensive assessment capital shortfall by main components

Click to enlargeThe overall comprehensive assessment shortfall is shown again in Figure 4, split by country of participating bank. It is presented in terms of country-level RWA, i.e. reflecting the significance of the shortfall relative to the size of the banks included in the exercise and showing the direct impact on banks' CET1 ratio.
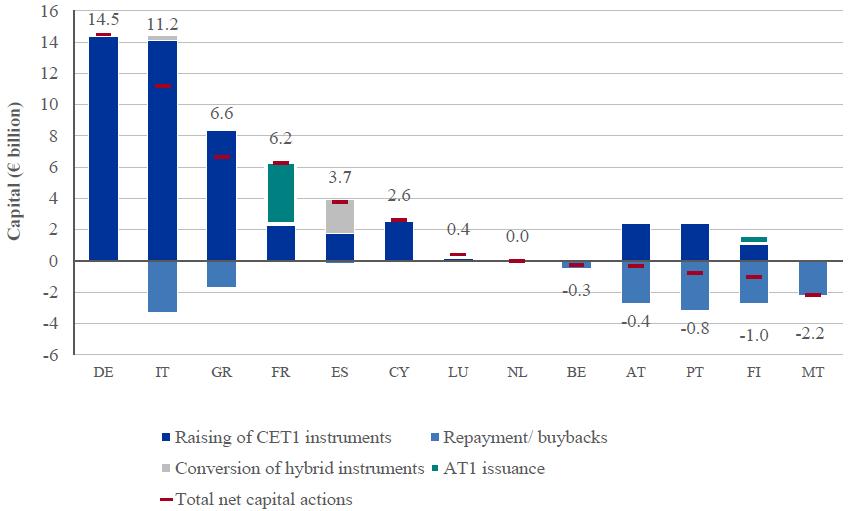
Figure 4 Comprehensive assessment capital shortfall by country of participating bank
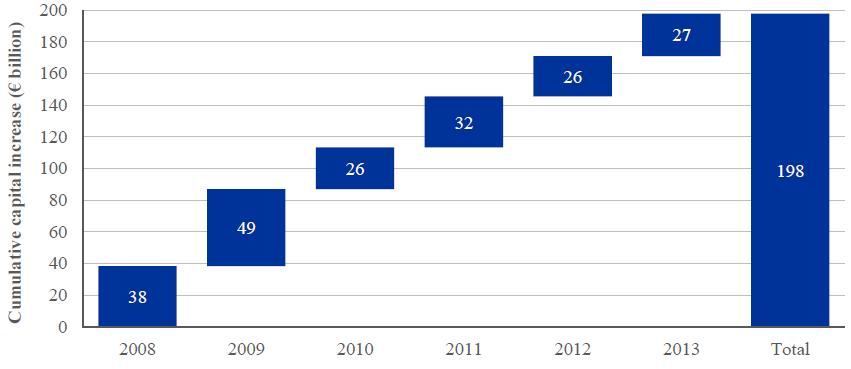
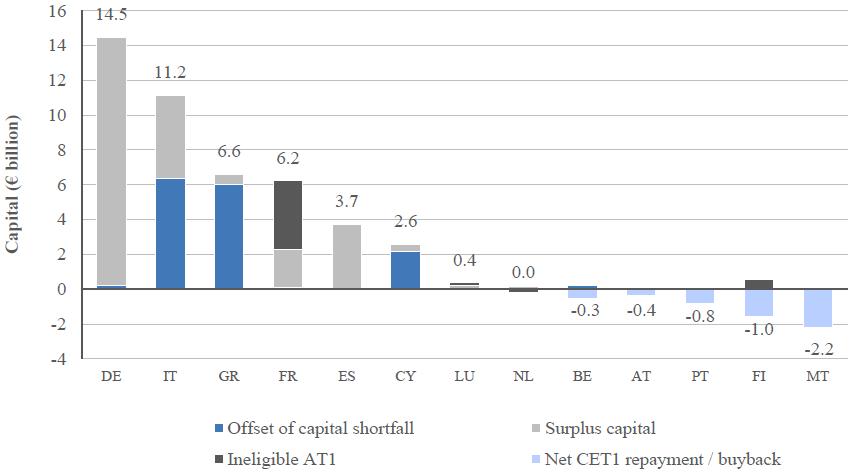
Click to enlargeThis capital shortfall identified by the comprehensive assessment can be placed in the context of capital recently raised by the participating banks. Between the onset of the financial crisis in 2008 and 31 December 2013, capital in excess of �200 billion has been raised by banks participating in the exercise. Since 1 January 2014, a further �57.1 billion has been raised which is not counted in the results above, but which will be considered as mitigation of the shortfalls found.
On a bank level, the capital needs identified are presented below, along with the capital raised by each institution since 31 December 2013 |10| and the remaining capital shortfall. For each of the 25 institutions identified in Table 1, a capital plan will be submitted to the respective JST within two weeks of the publication of this document, detailing how the capital shortfall will be filled. The JSTs will check that any such plans are sound and include the capital raising already undertaken by the participating banks with shortfalls. |11|
When all of the capital that has been raised already (net of capital instrument buyback) is offset against the shortfalls, �9.5 billion |12| remain to be filled, distributed across 13 banks. Two banks within this list that have a shortfall on a static balance sheet projection |13| will have dynamic balance sheet projections (which have been performed alongside the static balance sheet assessment as restructuring plans were agreed with DG-COMP after 1 January 2014) taken into account by the JSTs in determining their final capital requirements. Under the dynamic balance sheet assumption, one bank has no shortfall and one bank has practically no shortfall.
Table 1 Participating banks with a shortfall Bank Name CET1 ratio starting point CET1 ratio post AQR CET1 ratio baseline scenario CET1 ratio adverse scenario Capital shortfall (� billion) Net eligible capital raised (� billion) Capital shortfall post net capital raised (� billion) Eurobank |1| 10.6% 7.8% 2.0% -6.4% 4.63 2.86 1.76 Monte dei Paschi di Siena 10.2% 7.0% 6.0% -0.1% 4.25 2.14 2.11 National Bank of Greecei 10.7% 7.5% 5.7% -0.4% 3.43 2.50 0.93 Banca Carige 5.2% 3.9% 2.3% -2.4% 1.83 1.02 0.81 Cooperative Central Bank -3.7% -3.7% -3.2% -8.0% 1.17 1.50 0.00 Banco Comercial Portugues 12.2% 10.3% 8.8% 3.0% 1.14 -0.01 1.15 Bank of Cyprus 10.4% 7.3% 7.7% 1.5% 0.92 1.00 0.00 Oesterreichischer Volksbanken-Verbund 11.5% 10.3% 7.2% 2.1% 0.86 0.00 0.86 permanent tsb 13.1% 12.8% 8.8% 1.0% 0.85 0.00 0.85 Veneto Banca 7.3% 5.7% 5.8% 2.7% 0.71 0.74 0.00 Banco Popolare 10.1% 7.9% 6.7% 4.7% 0.69 1.76 0.00 Banca Popolare di Milano 7.3% 6.9% 6.5% 4.0% 0.68 0.52 0.17 Banca Popolare di Vicenza 9.4% 7.6% 7.5% 3.2% 0.68 0.46 0.22 Piraeus Bank 13.7% 10.0% 9.0% 4.4% 0.66 1.00 0.00 Credito Valtellinese 8.8% 7.5% 6.9% 3.5% 0.38 0.42 0.00 Dexia |2| 16.4% 15.8% 10.8% 5.0% 0.34 0.00 0.34 Banca Popolare di Sondrio 8.2% 7.4% 7.2% 4.2% 0.32 0.34 0.00 Hellenic Bank 7.6% 5.2% 6.2% -0.5% 0.28 0.10 0.18 Munchener Hypothekenbank 6.9% 6.9% 5.8% 2.9% 0.23 0.41 0.00 AXA Bank Europe 15.2% 14.7% 12.7% 3.4% 0.20 0.20 0.00 C.R.H. - Caisse de Refinancement de l'Habitat 5.7% 5.7% 5.7% 5.5% 0.13 0.25 0.00 Banca Popolare dell'Emilia Romagna 9.2% 8.4% 8.3% 5.2% 0.13 0.76 0.00 Nova Ljubljanska banka |3| 16.1% 14.6% 12.8% 5.0% 0.03 0.00 0.03 Liberbank 8.7% 7.8% 8.5% 5.6% 0.03 0.64 0.00 Nova Kreditna Banka Maribor|3| 19.6% 15.7% 12.8% 4.4% 0.03 0.00 0.03 Total 10.0% 8.4% 7.2% 2.1% 24.62 18.59 9.47 1. These banks have a shortfall on a static balance sheet projection, but will have dynamic balance sheet projections (which have been performed alongside the static balance sheet assessment as restructuring plans were agreed with DG-COMP after 1 January 2014) taken into account in determining their final capital requirements. Under the dynamic balance sheet assumption, these banks have no or practically no shortfall taking into account net capital already raised.
2. Taking into account the orderly resolution plan of this institution, which benefits from a State guarantee, there is no need to proceed with capital raising following comprehensive assessment results.
3. The impact on 2014 of the restructuring measures already taken to improve structural profitability and the maintenance of retained earnings in banks will cover the shortfalls identified.
The calculation of CET1 used within the comprehensive assessment and reflected above has been performed based on the existing legal requirements and national transitional arrangements, with the notable exception of the removal of the prudential filter on unrealised gains and losses on sovereign exposures in available-for-sale (AFS), for which an EBA-defined harmonised phase-in has been applied. |14| These national discretions over transitional arrangements introduce variation in the current definition of capital used across banks and countries. The resulting divergences will gradually diminish over the coming years as transitional arrangements are phased out. In the meantime, the ECB recognises the need to improve the consistency of the definition of capital and the related quality of CET1 capital. This will be an issue for the SSM to address as a matter of priority. The disclosure of the impact of the transitional provisions on CET1 allows for an objective comparison, where the impact of the national options is neutralised.
The remainder of this report is structured as follows:
- Context of the exercise: objectives, guiding principles and how to interpret results.
- Scope of the exercise and methodological overview: the banks subject to the exercise; what it does and does not aim to address; a high-level view of its approach.
- Quality assurance: process and analysis performed to ensure consistent and accurate results.
- Aggregate outcomes of the comprehensive assessment.
- Outcomes of the AQR and further analysis: review of the detailed drivers of the AQR results.
- Outcomes of the stress test and further analysis: review of the detailed drivers of the stress test results.
- Capital measures taken by participating banks: capital quantity and composition of participating banks' capital, including the treatment of the deductions and the related quality of CET1 capital.
1.4 COMPREHENSIVE ASSESSMENT IN NUMBERS
The exercise was comprehensive in scope:
- 19 participating countries.
- 130 participating banks.
- 81.6% of total SSM banking assets covered.
- More than 6,000 experts involved in ECB and NCA bank teams.
The exercise was comprehensive in nature:
- Over 800 individual portfolios examined.
- Over 119,000 debtors analysed in detail.
- Over 170,000 collateral items revalued.
- Over 850 provisioning and CVA models challenged.
- Over 5,000 securities revalued.
2 NATURE OF THE COMPREHENSIVE ASSESSMENT
This chapter explains the rationale for the comprehensive assessment, its components, describes how it was executed and finally introduces some key features of the exercise that the reader should be aware of when interpreting the results.
In October 2013, the ECB announced that it would conduct a comprehensive assessment of the euro area banking system in conjunction with participating national competent authorities (NCAs) responsible for banking supervision |15|, to be completed prior to the Single Supervisory Mechanism (SSM) assuming its supervisory responsibilities and duties for the significant euro area banks on 4 November 2014. |16| This was required by Article 33(4) of the Council Regulation (EU) No 1024/2013 (SSM Regulation) which entered into force in early November 2013.
The comprehensive assessment represents a key step forward for the SSM by providing a consistent and objective assessment of the health of banks' balance sheets and their solvency prior to the handover of responsibility. More generally, the goal of the exercise is to help prevent further burdens on taxpayers by strengthening the resilience of the financial sector to future crises. Furthermore, the exercise aims to facilitate banks' provision of credit to the European economy by reducing the uncertainty over their solvency. To this end, the objectives of the comprehensive assessment are threefold:
1. Repair - identifying and implementing any necessary remedial actions that are required to safeguard solvency in the near term.
2. Transparency - enhancing the quality of information available on the condition of banks to facilitate a more accurate assessment of their solvency.
3. Confidence building - assuring stakeholders that banks will be fundamentally sound and trustworthy after the identified remedial actions are implemented.
This report, in association with the detailed bank level results disclosed separately, aims to inform the reader of the process, governance and results of the comprehensive assessment.
The exercise comprised two pillars, namely the asset quality review (AQR) and the stress test.
The AQR aimed to review the carrying value of assets on the participating banks' balance sheets as of 31 December 2013. The end result was an indication of the need for additional provisions for losses on exposures on banks' balance sheets, leading to prudently calculated AQR-adjusted capital ratios, which allowed for the meaningful comparison of all participating banks on a like-for-like basis.
Based on the AQR-adjusted balance sheet, the stress test examined the resilience of banks against two separate scenarios - a baseline and adverse scenario - starting in 2014 and running to the end of 2016. Under both scenarios, the solvency ratio of each bank was analysed over that period to understand bank sensitivities given prescribed stressed economic conditions. The baseline scenario was provided by the European Commission and reflected then-prevailing official macroeconomic forecasts while the adverse scenario represented a severe economic downturn triggered by a materialisation of the main economic risks identified by the European Systemic Risk Board (ESRB).
A number of parties were involved in the execution of the comprehensive assessment.
- Participating banks were responsible for fulfilling their obligations to the NCA, providing data and running the stress test.
- NCAs were responsible for all national project management activities, making sure that the banks fulfilled their responsibilities, performing initial quality assurance and reporting to the ECB. The NCAs appointed NCA bank teams comprising NCA staff and external auditors, property appraisers and valuation advisers who provided a third party perspective. This composition for the NCA bank teams brought expertise and independence, given that neither the bank's statutory auditor nor its day-to-day supervisor were involved in the completion of that bank's AQR.
- At the ECB, the comprehensive assessment was conducted under the lead of a project manager, who oversaw the execution of the entire exercise in cooperation with the heads of national steering committees. In carrying out his tasks, he was assisted by a Central Project Management Office (CPMO) and a joint stress testing quality assurance structure that was established in cooperation with the Directorate General Macro-Prudential Policy and Financial Stability. The CPMO was the central coordination point for the exercise; it monitored the progress by NCAs and their constituent banks and executed the final quality assurance on the asset quality review (with the specific support of seven country teams - see Section 4.1.1). The stress testing governance structure was composed of a horizontal review unit and a central country review unit divided into various country teams. The former was tasked with conducting quantitative data checks and running the top-down stress test tool, including sensitivity analyses. The latter conducted an in-depth analysis of bottom-up stress test results and communicated with NCAs. The ECB was assisted by an external consultant in the design of the AQR and stress test methodology and the conduct of the comprehensive assessment as a whole.
- Supervisors outside of the SSM assisted the ECB in the completion of the exercise for any subsidiaries of SSM banks located outside of the SSM which qualified for inclusion in the comprehensive assessment.
- The ECB worked closely with the EBA to complete the stress test pillar of the comprehensive assessment.
The two components of the comprehensive assessment were executed by these bodies in different ways, reflecting the nature of each exercise.
- The AQR was executed by the NCA bank teams, following a methodology designed and published by the ECB. |17| Results were submitted by the NCA bank teams to the NCAs which reviewed the work of their NCA bank teams and submitted them to the ECB for consideration and collation. Central quality assurance was performed and requests made by the ECB of NCAs and the NCA bank teams to investigate certain results - further details of this process can be found in Section 4.1. Both the ECB and NCAs were supported by external advisors (including auditors, consultants and appraisers) who brought expertise and independence to the review.
- The stress test was executed by the banks themselves, following a methodology designed and published by the EBA along with a baseline scenario founded on the European Commission's Winter 2014 forecast and an adverse scenario developed by the ESRB in cooperation with the NCAs, the EBA and the ECB. Results were submitted for review to each bank's respective NCA, and then to the ECB. Therefore, although the ECB retained the final versions, the results were in all cases initially created by the bank. The banks' stress test submissions were subject to a thorough quality assurance process by NCAs and the ECB. In cases where their stress test outcomes were not considered appropriate in view of the EBA methodology and judged against ECB benchmarks |18|, banks were requested to adjust and resubmit their results. Finally, the AQR and stress test were integrated through the "join-up" process (outlined in Section 3.2), centrally executed by the ECB in accordance with the published methodology. The tool used to perform the join-up calculation was shared with both the banks and NCAs; the NCAs and ECB independently calculated the result in parallel and discussed the outcome in order to corroborate the final result.
- Following completion and finalisation of the joined-up comprehensive assessment result, a "supervisory dialogue" process was conducted between the participating banks and their Joint Supervisory Teams (JSTs). During the supervisory dialogue meetings, partial and preliminary results of the comprehensive assessment were shared and discussed. The banks were given 48 hours following the meeting to provide comments and questions to the ECB. The banks were also required to resubmit their final stress test templates within 96 hours following the supervisory dialogue meetings if any further adjustments were deemed necessary. Further information is in Section 4.3.
- After disclosure of the results of the comprehensive assessment, the capital actions required of the banks will be assessed and monitored by the respective JSTs. Banks identified as having capital shortfalls will be required to take remedial actions and to submit capital plans within two weeks of the public disclosure of the results detailing how the shortfalls will be covered. Capital plans must show how any shortfalls will be addressed within six months for those identified in the AQR or the baseline stress test scenario, and within nine months for those identified in the adverse stress test scenario. Further information on this is given in Chapter 8.
- The JSTs will also define the process for, and track the incorporation of, remedial actions required of each bank, as well as the findings that need to be reflected in forthcoming accounts following the comprehensive assessment in line with the applicable accounting frameworks.
- The 2014 Supervisory Review and Evaluation Process (SREP) will be used to further embed the results of the comprehensive assessment, with these results forming an input to the capital adequacy assessment alongside the national SREP and existing capital plans. As a result of this process, significant credit institutions (the banks under direct supervision by the ECB in the SSM |19|) that have a shortfall in the comprehensive assessment will have the outcome of the comprehensive assessment as a floor for the SREP capital decision.
2.4 CHARACTERISTICS OF THE COMPREHENSIVE ASSESSMENT
A number of characteristics of the comprehensive assessment should be borne in mind when considering the results.
The comprehensive assessment was a prudential rather than accounting exercise. Although current accounting (IFRS or national GAAP) and prudential rules were considered as binding and were observed strictly, the outcomes of the comprehensive assessment will not necessarily be reflected directly in banks' accounts following the exercise.
In some cases where more than one approach was consistent with accounting rules the comprehensive assessment prescribed a favoured approach following prudential and economic logic. Hence a number of situations in which AQR-adjustments have been made do not indicate that the original bank accounts failed to meet with accounting standards.
The comprehensive assessment sought to maintain a level playing field across the 130 participating banks by providing guidance on a range of important inputs such as non-performing exposure (NPE) definition, impairment triggers, provisioning approaches for going concern NPEs, collateral valuation, point-in-time collective provisioning, and credit valuation adjustment (CVA) calculation where possible. Such guidance was not, however, possible in all areas. The emphasis on objective data and indicators based on data in the AQR allowed for a more consistent approach across countries and banks; the AQR represents a substantial step forward in harmonising such definitions in the euro area.
NCAs were aided in this by the published methodology |20| which included numerous "ECB thresholds", supplemented by a central frequently asked questions (FAQ) and helpdesk process, as well as the thorough review of any outliers or anomalies during the central quality assurance process. These ECB thresholds provided additional prescription to practices in a number of areas in which accounting standards allow a range of approaches but did not contradict those standards. These ECB thresholds are not expected to be used for accounting purposes following the comprehensive assessment, and where their application has led to AQR-adjustments it is the responsibility of participating banks to assess whether those adjustments have to be reflected in their statutory accounts. That said, the comprehensive assessment will form the basis for extensive follow-up work beyond addressing capital shortfalls.
Nevertheless, a number of findings from the AQR do stem directly from adjustments in which the previous practice of participating banks was explicitly non-compliant with accounting practice. |21| Participating banks are expected to assess these issues and reflect accounting breaches in their accounts. This process will be monitored by the Joint Supervisory Teams of the banks in question.
The comprehensive assessment involved central oversight in both methodology definition and quality assurance for consistency and transparency. Not only was a substantial methodological manual and body of additional clarifying support provided, but all significant departures from the prescribed methodology (e.g. in response to material country/bank specific circumstances) required written approval from the ECB which was only granted in exceptional circumstances. Central quality assurance was enabled by gathering large quantities of data across all countries and banks during the execution of the AQR, and by collecting and assessing the results of the stress tests performed by the banks themselves. Where data reflected divergent approaches, the ECB checked that the methodology was being adhered to, although specific circumstances were taken into account where appropriate. Further details of the quality assurance approach can be found in Chapter 4.
The AQR was conducted using a general principle that an approach would be adopted only where objective data was available to justify it. Whenever such data was not available a generally conservative fall-back assumption was used and applied consistently across the SSM. An example of this is the use of loss emergence periods in the collective provisioning work block. Loss emergence periods have a direct impact in provisions required for performing loans. A rebuttable supposition of 12 months was employed, which could only be lowered where granular, objective data was analysed by the NCA bank team and approved by the ECB to show that a shorter period was appropriate.
The AQR was a targeted, risk-based exercise. The results therefore cannot be extrapolated to portfolios that were not selected for review. With 130 banks in-scope, covering more than �22.0 trillion of assets and �16.4 trillion of loans |22|, a file-by-file review of all exposures was not possible within the AQR. Nevertheless, all portfolios of the participating banks were considered for inclusion, on a consistent set of metrics, during the first phase of the AQR. The final portfolio selection was performed by both the ECB and the respective NCA and aimed to cover those portfolios with the highest chance of material misstatements. The selection was designed so that the majority of credit risk-weighted assets (cRWA) |23| and the majority of material portfolios |24| by count were covered in detail. Because the selection was risk-based in this way, it was likely to constitute a biased sample of portfolio misstatement levels and therefore it would be inaccurate to extrapolate findings to un-selected portfolios. Following sampling, more than 119,000 debtors were analysed with millions of data items collected during the credit file review and about 170,000 collateral items valued, allowing the ECB to perform granular analyses. Furthermore, 765 collective provisioning challenger models and over 100 CVA challenger models were built, 5,000 level 3 cash positions re-valued and over 100 complex valuation models reviewed.
The stress test is a forward-looking exercise that provides insight into the ability of a bank to withstand pre-defined adverse economic conditions. It should be noted that the stress test is not a forecast of future events, but rather a prudential gauge of participating banks' resilience under severe but plausible macro-economic conditions. For example, a number of restrictive rules were imposed by the stress test methodology that constrict the responses of the participating banks to stress (such as the static balance sheet assumption, which for example does not allow the banks to deleverage as they may otherwise in an adverse scenario). These rules enhance the prudential nature of the exercise. The stress test was performed in close cooperation with the EBA. The EBA published the stress test methodology, scenarios and disclosure templates which were used by the ECB when performing the stress test pillar of the ECB's comprehensive assessment.
3 SCOPE OF THE EXERCISE AND METHODOLOGICAL OVERVIEW
The purpose of this chapter is to outline the scope of the comprehensive assessment, namely the 130 banks identified by the ECB to be reviewed and the risks to be covered in the AQR and stress test. The chapter also provides a brief methodological overview of the AQR and stress test as a summary of the detailed methodological documents released by the ECB and, in the case of the stress test, the EBA. |25|
The ECB has undertaken a comprehensive assessment of 130 credit institutions, financial holding companies or mixed financial holding companies with total assets of �22.0 trillion at the end of 2013, accounting for 81.6% of total banking assets in the SSM. These banks were identified based on significance criteria referred to in Article 6(4) of the SSM Regulation. In general, a bank in an SSM Member State was included if any of the following criteria applied:
- The total value of the bank's assets exceeds �30 billion.
- The ratio of the bank's total assets to GDP of its country of establishment exceeds 20%, unless the total value of their assets is below �5 billion.
- The institution is among the three largest credit institutions in a participating SSM Member State, regardless of size.
In addition to the simple application of these criteria, the ECB also took into account changes that might have occurred between the start of the exercise and the commencement of supervision; by applying a 10% margin of deviation to the above thresholds, it included borderline banks in the comprehensive assessment. A full list of in-scope banks and banks due to be subject to SSM Regulation can be found in Appendix 9.1.
A key requirement of the comprehensive assessment was that it considered the "highest level of consolidation in participating Member States" in the assessment of whether banks met the above criteria. Numerous banking groups included in the list have established subsidiaries in other participating Member States that would themselves meet the criteria on a sub-consolidated or solo basis. The latter are not listed separately unless they are among the three largest credit institutions in a participating Member State. In all cases the comprehensive assessment was carried out at the highest level of consolidation of the entity subject to the review as listed in the Appendix. |26|
Each of the 130 banks subject to the comprehensive assessment was examined within the AQR. A subset of 76 banks was included in the AQR's fair value exposure review, a detailed examination of mis-valuation risk within the most complex fair valued instruments. This list was determined using absolute and relative criteria such as the overall size of the trading book, the size of level 3 fair value financial instrument positions (including those in the banking book) and other relevant risk metrics.
All participating banks were included in the stress test exercise conducted in cooperation with the EBA. |27| The 130 participating banks can be separated into three groups with respect to the balance sheet assumption used in the stress test.
- Non-restructuring banks: the EBA methodology prescribes that the stress test was performed under a static balance sheet assumption, in the absence of an agreed restructuring plan with the European Commission. This required banks to apply a zero growth rate of the total balance sheet and unchanged business mix across the time horizon of the exercise. |28|
- Restructuring banks (approved before 31 December 2013): banks which are currently implementing a restructuring plan approved by the European Commission (Directorate General of Competition, DG COMP) that was agreed before 31 December 2013 were allowed to apply a dynamic balance sheet assumption. Implementation of a dynamic balance sheet reflects the implementation of the material changes to the business model of the bank that typically includes some mix of asset disposal, organic deleveraging, and risk reduction.
- Restructuring Banks (approved after 31 December 2013): banks which received DG-COMP's approval for a restructuring plan in the course of 2014 were required to produce stress test templates under the static balance sheet assumption. These banks were also allowed to prepare separate templates under the dynamic balance sheet assumption, and the results of the dynamic balance sheet assumption are also presented in the ECB disclosure template.
Table 2 Balance sheet used for the stress test Number of banks Disclosure of stress test results Supervisory response Static balance sheet 101 banks Stress test results are disclosed based on the static balance sheet assumptions. Supervisory response based on the lowest CET1 under the static balance sheet assumptions. Dynamic balance sheet 24 banks Stress test results are disclosed based on the dynamic balance sheet assumptions. Supervisory response based on the lowest CET1 under the dynamic balance sheet assumptions. Static and dynamic balance sheet assumptions 5 banks - in the case of Alpha Bank, Eurobank Ergasias, National Bank of Greece, Piraeus Bank in Greece, and Allied Irish Banks in Ireland, the results of the static balance sheet review are considered and reported. However, due to the acceptance of restructuring plans after 31 December 2013, an extra tab in the disclosure template will show the results of a dynamic balance sheet review. Stress test results are disclosed based on the static balance sheet assumption. The impact of the dynamic balance sheet assumptions are separately shown in the disclosure templates. Though the capital shortfall is based on the static balance sheet, the impact of restructuring/ the dynamic balance sheet will be taken into account in the supervisory response. 3.1.1 ADDITIONS AND WITHDRAWALS
The 130 banks in-scope for the comprehensive assessment differs from the originally selected 128 institutions |29| in the following ways.
- Three Lithuanian institutions were included in the final sample (AB DNB Bankas, AB SEB Bankas, Swedbank AB) in order to allow them to join the SSM once Lithuania adopts the euro from 1 January 2015.
- Banco Espirito Santo (Portugal) was removed from the selected institutions due to its resolution by the Banco de Portugal. It has not been possible to include the results of the comprehensive assessment for the successor institution, Novo Banco (Portugal), due to inability to conduct the exercise on time.
- Unicaja completed the acquisition of CEISS during the comprehensive assessment, and therefore one integrated disclosure template has been published for the new entity.
- Two disclosure templates for Wustenrot & Wurttembergische AG have been released for the two banking entities of the group, Wustenrot Bank AG Pfandbriefbank and Wustenrot Bausparkasse AG.
- It should also be noted that the 130 banks that performed the comprehensive assessment are not the same as the "significant credit institutions" that will be supervised directly by the ECB when it assumes supervisory responsibility. A number of banks reviewed during the comprehensive assessment have been classified as "less significant" institutions; these will continue to be directly supervised by the national competent authorities, while the ECB will exercise its indirect supervisory function. |30|
3.2 OVERVIEW OF THE METHODOLOGY
The ECB published the methodology for Phase 2 of the AQR on 11 March 2014. The EBA published the common methodology and scenario for the stress test on 29 April 2014, and following this on 8 August 2014 the ECB published guidance for the stress test quality assurance and join-up exercise. |31| Summaries of these methodologies follow below.
3.2.1 AQR METHODOLOGY
The AQR was composed of two phases. Phase 1 involved the process of portfolio selection; Phase 2 comprised nine interlinking work blocks with the final output of an AQR-adjusted CET1 ratio to be compared to the threshold of 8%.
Figure 5 Schematic of AQR work blocks
Click to enlargePhase 1
0. Portfolio selection: this was designed to focus the detailed analysis of the AQR on those portfolios most likely to have a material misstatement on a bank's balance sheets. The risk-based approach identified portfolios where the AQR adjustments could have a material impact on CET1. For each bank, at least 50% of credit RWA (cRWA) and "half of the material portfolios |32|" were selected to be analysed through the in-depth approach in Phase 2. Further detail on the process of portfolio selection is provided below.
Phase 2
1. Processes, policies and accounting review (PP&A): bank processes, policies and accounting practices have a key impact on the carrying values of assets in banks' balance sheets and, hence, were reviewed. Key topics covered included: application of fair value hierarchy; accounting classifications (e.g. as available-for-sale); high level qualitative approach to the CVA calculation; provisioning approach; treatment of NPEs and forbearance. |33|
2. Loan tape creation and data integrity validation (DIV): the credit analysis (sample selection and collective provisioning challenger model creation) was based on a "loan tape" provided by the bank. This loan tape included basic account information such as segment classification, missed payments status and identifiers of the loan/entity. The data was required to be of sufficient quality to perform the required analysis, which necessitated automated checks of the data set and a review of consistency across internal IT systems.
3. Sampling: given the volume of analysis involved it was not viable to review all exposures in every portfolio within the scope of the credit file review. Therefore, risk-based sampling was conducted in a manner that meant the sample chosen was both large enough, and representative enough, to allow for robust analysis and later projection back to cover the entire portfolio. The size of the sample depended on: the homogeneity of the portfolio, the risk of the portfolio, the total number of debtors and the level of debtor concentration. Samples were generally in the range of up to 20% of total exposure in a portfolio depending upon size and concentration. The approach to sampling was consistent with best practice as defined by adherence to ISA 530.
4. Credit file review (CFR): the credit file review involved NCA bank teams working on an exposure by exposure basis to verify that each credit exposure had been correctly classified in the bank's systems (e.g. correct regulatory segment, NPE status, impairment status) and that, if a specific provision was required, it had been set at an appropriate level. The CFR covered all loans, advances, financial leases and other off balance sheet items including specialised asset finance such as shipping and project finance.
5. Collateral and real estate valuation: a key input to determining appropriate carrying amounts is the valuation of collateral. Generally, the majority of collateral which did not have a third-party valuation conducted after 1 January 2013 was re-valued for all debtors selected in the sampling. The results of these valuations were used as inputs to the credit file review and collateral valuation components. To ease the burden of reappraisals, some use of valuations by independent internal units were allowed in particular circumstances described in detail in the AQR Manual.
6. Projection of findings of credit file review: findings of the credit file review were then projected to the unsampled part of the portfolio. Specifically, projected metrics were mainly impairment provisions and NPE reclassifications. |34| Projection of findings was applied to homogeneous pools of exposure within each portfolio called "strata" (in line with audit guidelines); portfolios were stratified based on the riskiness and exposure size of debtors. In order to prevent overstating the projection of single credit file review findings, a number of safeguards were implemented in the projection methodology (e.g. flagging of anomalies, common risk stratum based projection - using results from the whole risk bucket rather than just from the stratum, and overrides - in rare cases where results from the sample were felt to be unrepresentative which had to be approved centrally by the ECB).
7. Collective provisioning analysis: smaller, homogeneous, impaired exposures are typically provisioned using a collective provisioning approach - that is, a point-in-time statistical model of incurred loss. Similarly, incurred but not reported (IBNR |35|) and other general provisions are usually set using collective models. Therefore in order to verify that provisioning levels were appropriate it was critical that collective provisioning models were fully aligned with the letter and spirit of accounting rules (IAS |36| 39 or nGAAP |37|). This was performed using a comparison of banks' practices to provisioning levels suggested by a unified, simplified challenger model.
8. Level 3 fair value exposures review: for banks with material level 3 exposures, a thorough revaluation of the most important exposures was carried out on a selective basis - i.e. not all banks were analysed. For banks with material level 3 exposure, a revaluation of the most important securities was carried out. For the banks with material trading books, a qualitative review of trading book core processes (model validation, credit valuation adjustment, other fair value adjustments, independent price verification, P&L analysis and new product approval) was carried out, combined with a review of the most important derivative pricing models which price level 3 exposures (measured based on metrics such as level 3 gross mark-to-market). Additionally, a CVA challenger model was used to assess the banks' CVA calculation in detail.
9. Determination of AQR-adjusted CET1 ratio for use in ECB stress test and definition of remediation activities for banks following the comprehensive assessment: in order to correctly account for all AQR adjustments, an "AQR-adjusted CET1 ratio" was calculated for each bank. This AQR-adjusted CET1 ratio was calculated according to the Single Rulebook, fully reflecting Capital Requirements Regulation (CRR) / Capital Requirements Directive IV (CRD IV) |38| rules (and taking into account the initial transitional arrangements decided by individual jurisdictions), and was checked in detail by each NCA.
Netting rules applied in the AQR
The results of the AQR work blocks are not additive i.e. the sum of the results of each work block do not add to the total outcome. When comparing individually assessed AQR-provisions from the credit file review and the projection of findings, and collectively assessed AQR-provisions from the collective provisioning assessment with the provisions recognised by participating banks, each portfolio was assessed on its own merit. This means that no netting between under- and over-provisioned portfolios was conducted. Furthermore it was determined that total provisions could not be reduced as a result of the AQR, and netting would occur within a portfolio only to a minimum of zero. Both of these rules reflect the prudential nature of the AQR methodology and introduce conservatism when assessing appropriate provisioning levels.
Additional details on how the credit file review was performed The credit file review (CFR) was designed to determine if exposures were performing or non-performing and to set the correct provisioning level for non-performing exposures.
In the AQR, this was performed on a large number of selected credit files of a bank's portfolio, using a risk-based sampling process. (This meant that those files that were either non-performing, large in exposure or considered at risk were selected in much greater quantity than smaller or less risky exposures). In total, the credit file review was performed on more than 119,000 loan files.
The credit file review was performed by NCA staff and/or independent audit firms, the so-called NCA bank teams. Members of these teams were only allowed to undertake the review if they were not the regular day-to-day supervisor or statutory auditor of the bank.
The CFR consisted of three components: data preparation, classification review and review of individual provisioning.
The data preparation involved collecting and verifying the information for the credit file review. Information was gathered by the bank and then provided to the NCA bank team in a standardised template. In total, banks provided more than 6 million data items in template form.
As a next step, banks provided the documentation on all selected debtors. In some cases this included hundreds of pages of loan documentation, providing information on the loan terms and characteristics, the credit memos, the business rationale behind extending the credit, the utilisation history of the facility, historical financials for the debtor, latest updates and appraisals on the borrower / the pledged collateral, information on eventual external guarantors and the latest covenants tests if applicable.
The work for the NCA bank teams then began in earnest with the performance of the classification review. A key component of this was to determine whether the exposure was performing or not. The documentation and recent information on the debtor were analysed for impairment triggers such as missed payments, evidence of bankruptcy or financial difficulty.
If a trigger was present, the teams checked whether a disruption of cash flow to the bank was to be expected or if the debtor would be able to honour all obligations to the bank on time. Debtors with expected impact on cash flow were (re)classified to NPE. Central benchmarking of impairment triggers and reclassification treatment led to equal treatment across banks and countries.
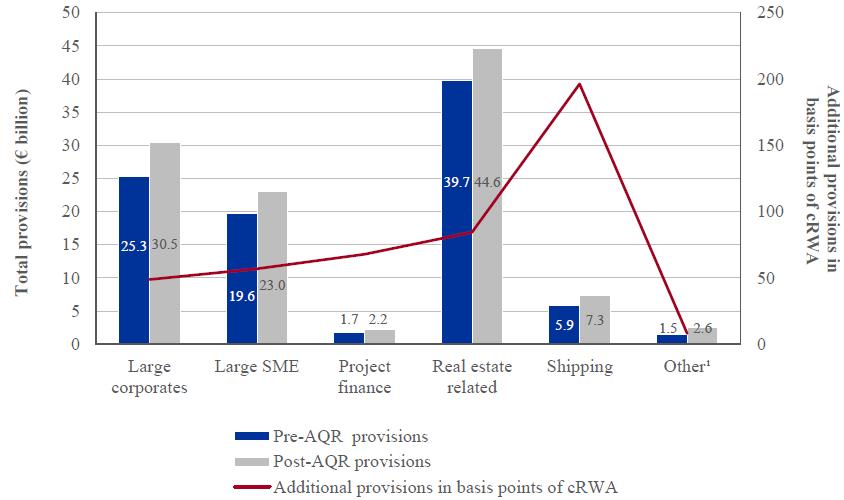
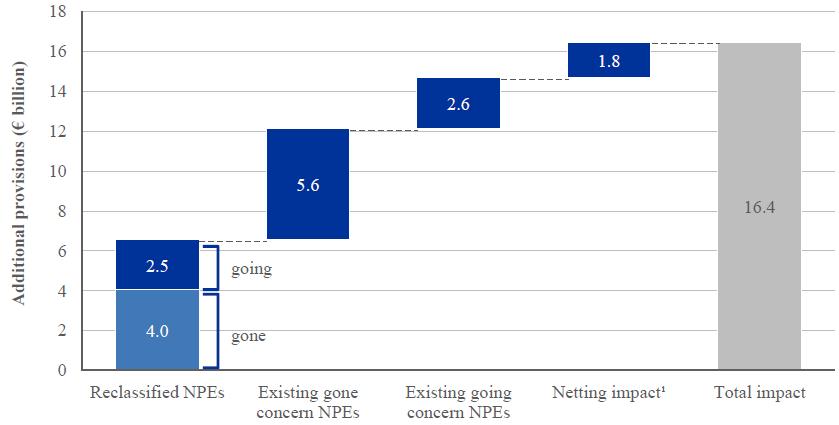
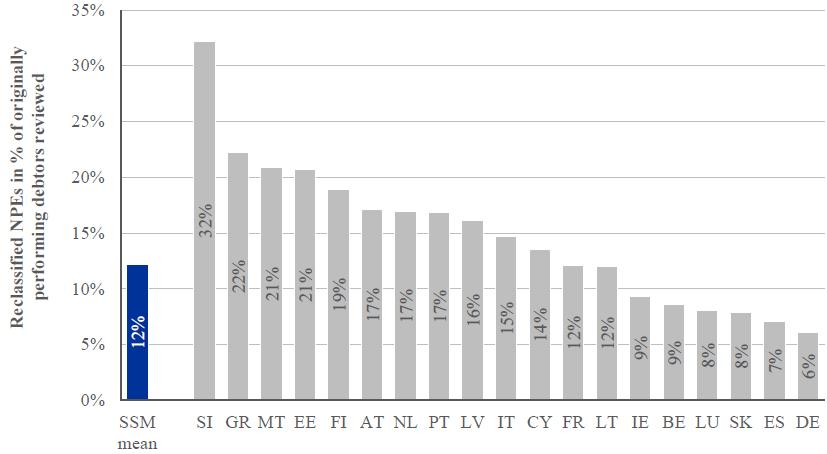
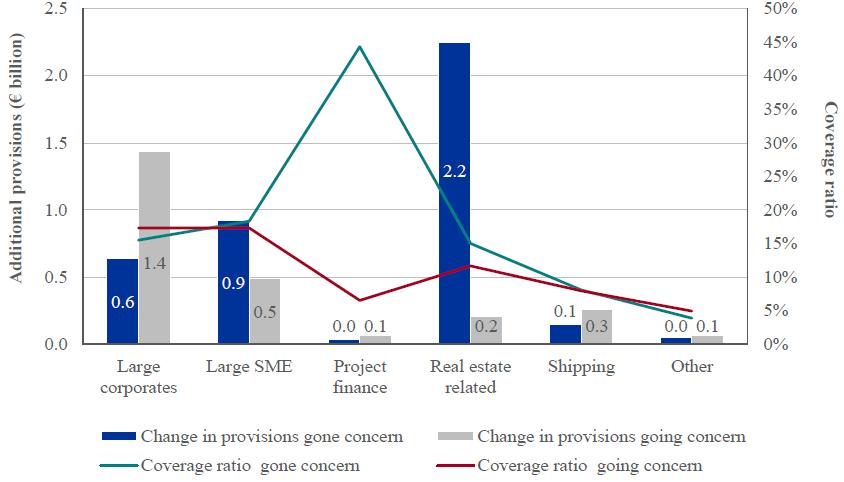
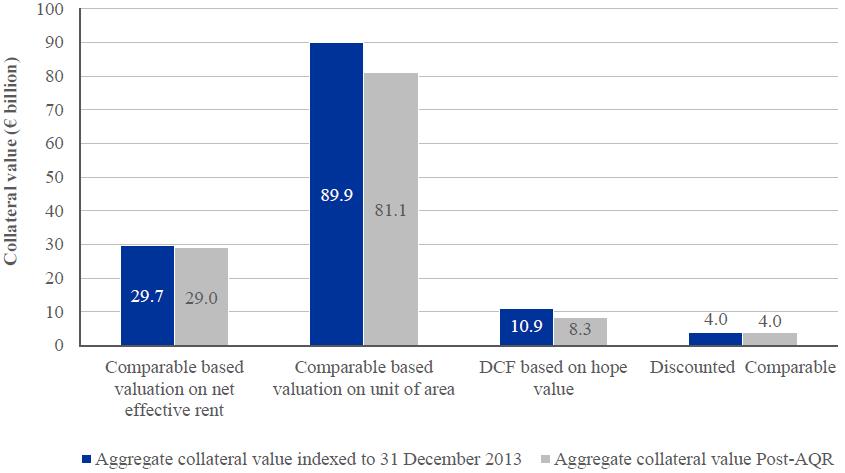
In total, the credit file review led to �81.3 billion of new NPEs across participating banks (post-projection) On all NPEs for corporate debtors, i.e. existing and reclassified, a review was performed to decide whether the provision that the bank holds against the exposure is appropriate. The review followed a present value of cash flows approach. The NCA bank teams first needed to decide if provisioning should be based on a "going concern" approach (i.e. the entity will continue to generate cash flows) or a "gone concern" approach (i.e. the assets of the company will need to be liquidated). Provisioning levels were then set based on the difference between the present value of cash flows and the exposure amount. This included the updated collateral valuations performed in the AQR. Again, the strict and prescriptive methodology and central benchmarking of provisioning levels led to equal and comparable results across banks and countries.
Portfolio selection for the review of provisioning levels
The ECB followed a risk-based selection approach in order to determine the portfolios that would be reviewed in the AQR. Out of the 130 banks participating in the exercise, 15 required special treatment as described later in this section ("Special cases"). In total, more than 1,300 portfolios were selected through the process described below which, after grouping and adjustments, resulted in 818 portfolios in the scope of the exercise.
Data gathering and portfolio definition
As a first step, a consistent data set covering all assets of each participating bank was gathered including standardised default data and other contextual information such as average risk weighting, coverage ratios by time in default and recent supervisory assessments. A data set of similar structure was gathered for level 3 fair value exposures. Based on these, assets were split into portfolios which were defined using a specific AQR approach to provide consistency.
Risk-based selection approach
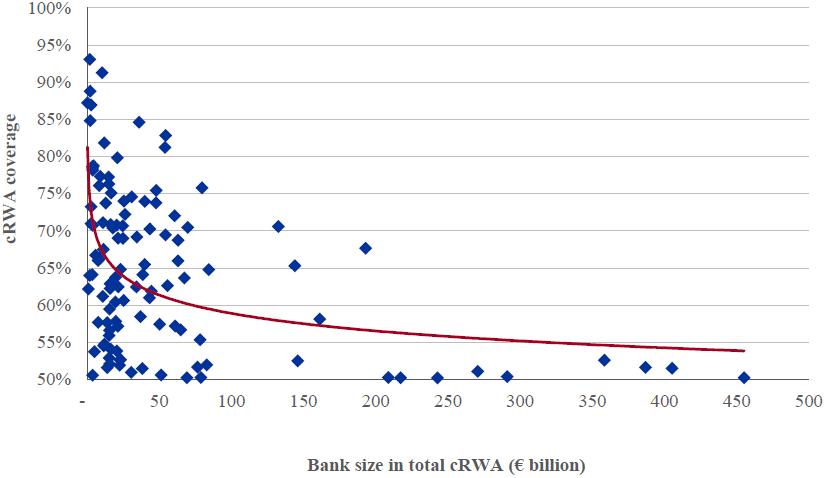
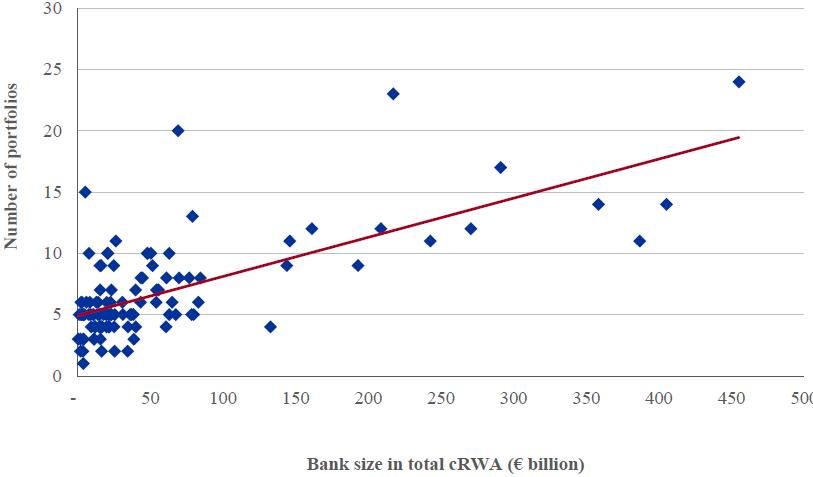
The portfolios were selected for detailed analysis following a risk-based approach, the aim being to cover those portfolios with the highest chance of material misstatements compared to available capital. Therefore the results of the exercise cannot be extrapolated to unsampled portfolios. This involved the consideration by the respective NCA and the ECB of asset type, collateral coverage, supervisory history and current provision coverage, among other factors. For each bank, at least 50% of credit RWA and "half of the material portfolios" were selected. This led to larger and more complex banks having slightly lower proportions of credit RWA selected, but overall higher numbers of portfolios selected.
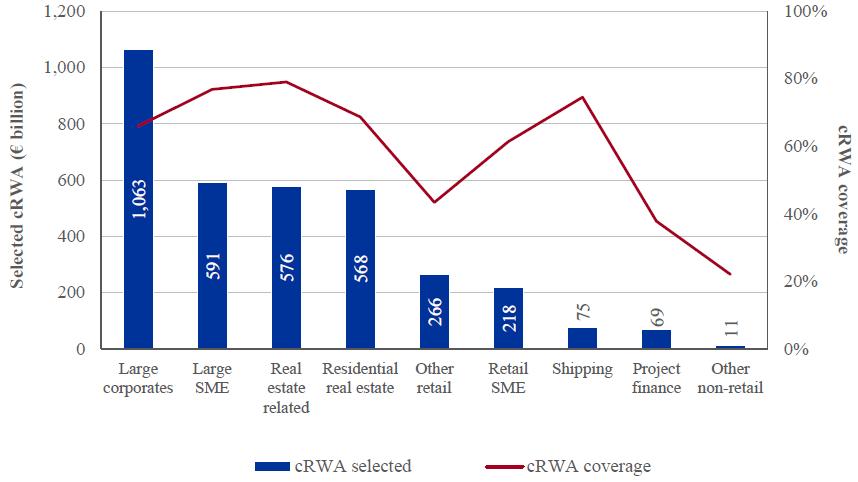
Figure 6 Illustration of risk-based portfolio selection, credit RWA coverage
Click to enlargeFigure 7 Illustration of risk-based portfolio selection, number of portfolios

Click to enlargeSpecial cases
Of the 130 participating banks, 15 cases required special treatment falling into three categories.
- Institutions with no banking credit risk: these institutions were only subject to the policy, processes and accounting (PP&A) review and, in two cases, the level 3 revaluation of non-derivative assets and derivative pricing model review. The 7 institutions which fell into this group are:
- RCB Bank Ltd
- Banque Centrale de Compensation
- C.R.H. - Caisse de Refinancement de l'Habitat
- Clearstream Banking
- RBC Investor Services Bank (performed non-derivative revaluation)
- UBS (Luxembourg)
- NWB Bank (performed non-derivative revaluation)
- Institutions with minimal banking credit risk: these institutions were exempt from the 50% of credit RWA and "half of material portfolios" selection criteria. The full AQR methodology was nonetheless applicable, but only for those items with credit risk. The 5 institutions in this group were:
- The Bank of New York Mellon
- Landwirtschaftliche Rentenbank
- State Street Bank Luxembourg
- Deutsche Bank (Malta)
- BNG Bank
- Institutions with very large intra-group exposure: institutions falling into this category were still subject to the two portfolio selection criteria, however in these cases the credit RWA coverage percentage was allowed to be calculated on a base RWA figure excluding the intra-group exposures. If this calculation approach was taken, intra-group exposures were not allowed to be selected as a portfolio. The 3 banks with high intra-group exposure were:
- Nordea Bank Finland
- Merrill Lynch International Bank
- RBS NV
Representativeness
Apart from a sufficient share of credit RWA of each bank, the selection approach aimed to cover a representative share of the entire universe of exposures. To that end, a significant share of credit RWA of all AQR asset classes was selected.
Figure 8 Selected exposures by asset class
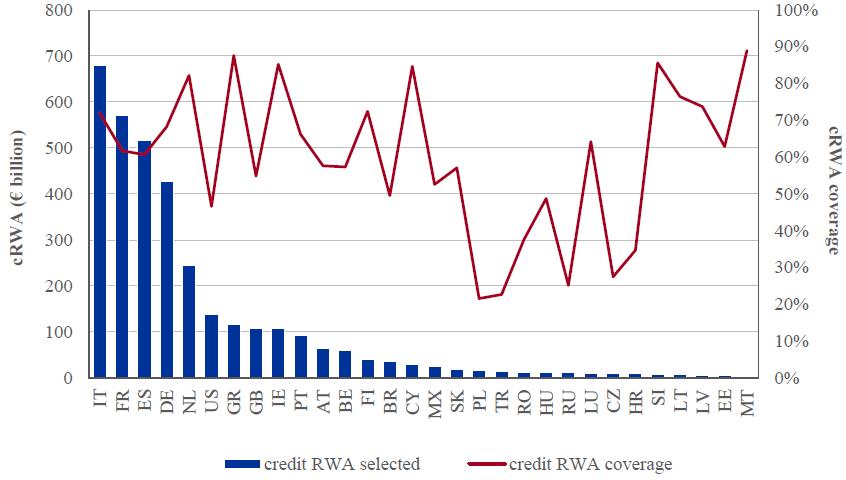
Click to enlargeWhere particular asset classes or geographies were assessed to hold more risks, higher selection coverage was targeted e.g. the shipping sector. In addition, the portfolio selection covered more than 50 geographies inside and outside of the SSM.
Figure 9 Selected exposures by debtor geography
Click to enlargePortfolio selection for the fair value exposures review
The method for the selection of banks included in the AQR fair value exposures review was designed to focus the exercise on the most risky portfolios on banks' balance sheets, where the AQR adjustments of fair values could have a material impact on the CET 1 ratio.
For banks with material level 3 exposures, a revaluation of the most significant positions was performed (for many banks this was a single banking book portfolio held under the fair value option). For banks with the most important trading books, an AQR review of the trading book was conducted, consisting of a qualitative review of core trading book processes, and a quantitative review of the most important derivative pricing models. |39|
All 130 participating banks involved in the AQR were also in-scope for the CVA challenger model review outlined in Section 6.2.3.2.
Details of participating banks for each section of the review can be found in the Appendix.
3.2.2 STRESS TEST METHODOLOGY
The stress test exercise focused on projecting the solvency ratio (CET1 ratio) of the participating banks under two macroeconomic scenarios, namely a baseline scenario and an adverse scenario (see Section 3.2.3). The stress test covered a horizon of three years from 2014 to 2016.
The capital threshold for the ECB stress test exercise is defined in terms of Common Equity Tier 1 (CET1) in accordance with CRR/CRD IV capital definition including transitional arrangements during the time horizon of the stress test (i.e. as per December 2013, December 2014, December 2015 and December 2016). |40| The minimum capital threshold for the baseline scenario is a CET1 ratio of 8%, thereby in line with the minimum capital threshold for the ECB AQR. The minimum capital threshold for the adverse scenario is a CET1 ratio of 5.5%.
The stress test exercise was performed under a static balance sheet assumption with the objective of achieving simplicity as well as cross-bank consistency and comparability. This implies a zero growth rate assumption for the balance sheet and the constant maturity profile of the bank's assets and liabilities over the horizon of the stress test confirmed by replacing maturing instruments with similar financial instruments in terms of type, credit quality and maturity. Exceptions to the static balance sheet assumptions were generally granted to the banks with restructuring plans.
Both the banking book and the trading book (including off-balance sheet items), as well as income and expenses, were subject to stress. The following risk dimensions were covered by the ECB stress test exercise. |41|
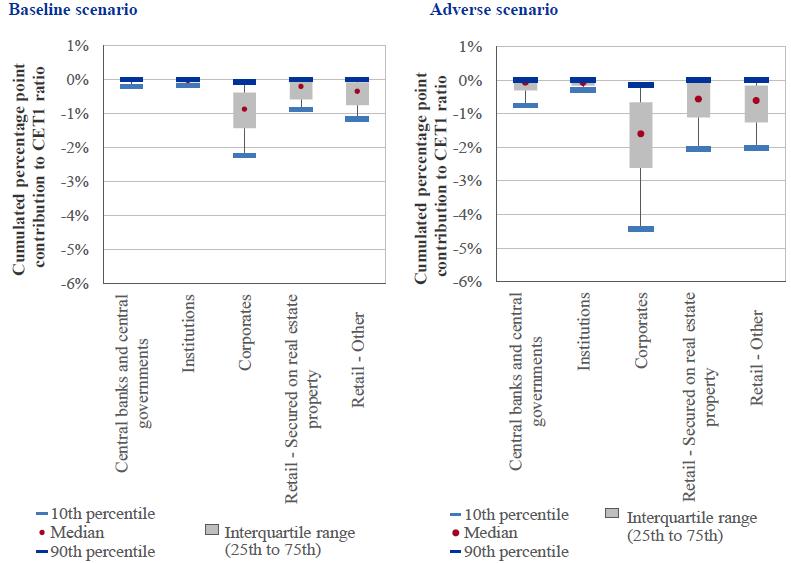
- Credit risk covered all counterparties (e.g. sovereigns, institutions, corporates and households) and all positions exposed to risks stemming from counterparty default (e.g. loans and securities). Credit risk was assessed through the impact of the macro-economic scenarios on default and loss parameters (probability of default and loss given default) thereby affecting both the profit and loss (P&L) account and RWA.
- Market risk covered all positions exposed to risks stemming from the changes of market prices, including counterparty credit risk. Market risk was to be assessed by applying a common set of stressed market parameters to positions held-for-trading, available-for-sale and positions at fair value through the Profit & Loss account, including sovereign positions in these accounting categories.
- Cost of funding and interest income affected all interest bearing assets and liabilities. The projected interest rates reflected re-pricing effects for new business (i.e. positions that replace the maturing positions) and changes in the reference rates for the floating rate items. Banks reflected the changes in their domestic sovereign bond spreads in the funding costs and pass on increased funding costs to customers. However, the pass-through was subject to certain constraints as banks were required to assume an asymmetrical pass through of interest rate changes on the asset and liability side respecting the caps and floors described in paragraphs 172 and 173 of the EBA methodology.
- Sovereign risk positions were treated depending on the exposure and accounting category. Sovereign exposures held at amortised cost (i.e. from the regulatory banking book) were stressed through PDs and LGDs based on rating notch downgrades provided by the ECB and ESRB. Sovereign exposures held at fair value were subject to the market risk parameters and haircuts (only for direct exposures i.e. exposures arising from immediate borrower basis) provided by the ECB and ESRB. The methodology prescribes a gradual phasing-out of prudential filters for all exposures (including sovereign) held as available-for-sale (AFS) in accordance with "minimum" transitional requirements set out in the CRR. Specifically, with respect to the preferential treatment of sovereign debt, 20% of the unrealised losses on assets in the AFS portfolio will not be filtered out in 2014, 40% in 2015 and 60% in 2016.
- Securitisation risk positions were stressed depending on the accounting treatment of a specific position. Risk weighted assets on all securitisations were subject to the increase in risk weights reflecting severe rating downgrades and based on three risk buckets: low, medium and high risk. Banks were asked to project impairments on exposures held at amortised cost. Exposures held at fair value were marked down in line with the market risk approach.
- Non-interest income and expense paths were projected using internal models, subject to the constraints set out in the EBA methodology, which are generally related to the recent historical evolution of this income type (2013 levels were used as a floor).
The stress test was performed by the banks in a constrained bottom-up fashion, under the macroeconomic scenarios and stress test methodology prescribed by the EBA in cooperation with the ECB.
Besides the static balance sheet assumption, the EBA methodology prescribed approaches to securitisations and sovereign risk, as well as a series of caps and floors on net trading income, net interest income and RWA.
In order to monitor the adequate application of the prescribed stress test methodology and scenarios, a quality assurance process was implemented following the submission of the stress test results by the banks. A review of the banks' bottom-up stress test results was performed on a stand-alone basis by the ECB quality assurance team in cooperation with NCAs. Further details on the ECB quality assurance process concerning the ECB comprehensive assessment results can be found in Chapter 4.
The join-up of the stress test and AQR results
Given that banks' stress test credit risk projections are driven by historical experience of default and impairment flows, AQR findings that relate to observed default and impairment flows should have an impact on forward-looking projections. For instance, if a bank estimated a PD for a portfolio of 1%, but the AQR showed it had underestimated the amount of defaults it experienced during 2013, then the real PD it should have applied may be higher than the 1% estimated by the bank.
Furthermore, AQR findings relating to the fair value of assets also have a bearing on future projections. For instance, if a bank incorrectly values a bond, it will also incorrectly stress the valuation of the bond (given the underlying valuation model is incorrect).
Finally, a series of other AQR-related findings have a direct bearing on the appropriateness of bank's stress test projections. For instance, in the AQR, NCA bank teams set an "auditor allowable amount" for deferred tax assets (DTAs) reliant on future profitability based on the income generating capacity of the bank and the local tax law. |42| In some cases, banks breached this amount when projecting DTA formation in the stress test results.
To address these issues, AQR findings were used to adjust each bank's relevant projections (e.g. PD and LGD parameters) so that relevant line items in the stress test fully reflected the findings from the AQR - this process was termed the "join-up". In particular, this allowed for the following effects to be adjusted for on a granular basis.
- Underestimation of PDs due to NPE misclassification identified in the AQR.
- Underestimation of LGD due to coverage ratio changes in the AQR.
- Double counting of losses that the bank classed as future losses but were included as incurred losses in the AQR.
- Fair value (including AFS) assets' valuations inappropriately stressed due to inappropriate valuation models used.
- DTA formation over the stress test exceeding the auditor allowable amount.
- Inappropriate application of tax rates, out of line with EBA methodology.
The join-up of AQR and stress test results was carried out in accordance with the comprehensive assessment stress test methodology, published by the ECB on 8 August 2014. |43| The work was conducted following the completion of the stress test. The process of joining the AQR and stress test outcomes involved centrally-led calculations (both by the ECB and the NCAs).
3.2.3 THE BASELINE AND ADVERSE SCENARIOS
The stress test exercise consisted of two macroeconomic scenarios, namely a baseline scenario and an adverse scenario. The baseline scenario was provided by the European Commission. The adverse scenario for the stress test was proposed by the European Systemic Risk Board (ESRB) in close collaboration with NCAs, the ECB and the EBA, and finally approved by the EBA Board of Supervisors.
The baseline scenario was based on the European Commission winter forecast, extended to cover the third year of the stress test (i.e. 2016), and was meant to reflect the most plausible scenario. |44|
The adverse scenario captured the prevailing view of current risks facing the financial system in the EU, as identified by the ESRB. It provides forward-looking paths for key macroeconomic and financial variables for all EU countries and a large number of non-EU countries, expressed in deviations from the baseline. The adverse scenario was designed to reflect the systemic risks that were assessed as representing the most pertinent threats to the stability of the EU banking sector: (i) an increase in global bond yields amplified by an abrupt reversal in market participants' risk perception, especially towards emerging market economies; (ii) a further deterioration of credit quality in countries with weak demand; (iii) stalling policy reforms jeopardising confidence in the sustainability of public finances; and (iv) the lack of necessary bank balance sheet repair to maintain affordable market funding. |45|
On average in the euro area, the adverse scenario leads to deviation of euro area GDP from its baseline level by -1.9% in 2014, -5.1% in 2015, and -6.6% in 2016. The euro area unemployment is higher than its baseline level, by 0.3 percentage points in 2014, by 1.2 percentage points in 2015, and by 2.2 percentage points in 2016. For most advanced non-euro area economies, including Japan, the UK and the US, the scenario results in a negative response of GDP ranging between 5% and 7% in cumulative terms compared to the baseline.
Furthermore, while the adverse scenario does not strictly embody a prolonged deflationary environment, it does entail material downward pressures on inflation. Thus, the scenario leads to annual inflation rates for the euro area below the baseline rates by 0.1 percentage points in 2014, by 0.6 percentage points in 2015, and by 1.3 percentage points in 2016. The implied adverse inflation rates amount to 1.0% in 2014, 0.6% in 2015 and 0.3% in 2016.
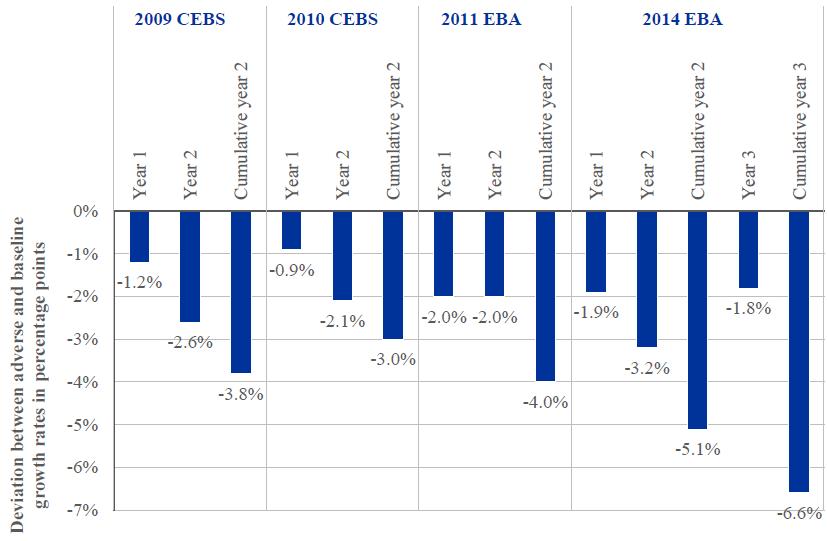
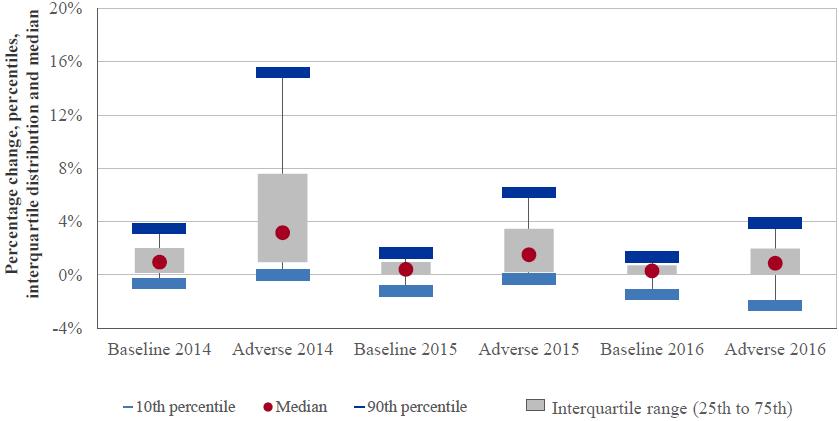
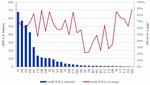
In comparison with past EBA and CEBS |46| EU-wide stress test exercises, the scenario for the 2014 EBA exercise was more severe, e.g. in terms of impact on GDP compared to the baseline. For instance, the difference between adverse and baseline GDP growth rates was around 5.1 percentage points at the end of the second year of the 2014 stress test exercise compared to between 3 and 4 percentage points in the previous three EU-wide exercises (see Figure 10). Also, as mentioned, in the current stress test there is a third year that contributed to the rigour of the exercise.
Figure 10 GDP impact across CEBS/EBA EU-wide stress test exercises in the euro area, deviation between adverse and baseline

Click to enlargeMoreover, in terms of overall severity, the magnitude of the cumulative shocks in the EBA stress-test exercise is broadly in line with those of the 2014 USA Federal Reserve's CCAR |47| adverse scenarios. Overall, in terms of peak level deviations from baseline GDP, the EBA stress test adverse scenario lies roughly in between the CCAR "adverse" scenario and the CCAR "severely adverse" scenario. Thus, over the nine-quarter horizon of the 2014 CCAR, the cumulated deviation from baseline GDP level reaches a maximum of 5.2% under the "adverse" scenario and a maximum of 8.9% under the "severely adverse" scenario. In the EU exercise, the maximum deviation of EU aggregate GDP from baseline over the 12 quarters amounts to 7.0%. Furthermore, when comparing the CCAR scenarios with the adverse scenario of the EBA 2014 stress test it has to be remembered that the starting points and the baseline scenarios differ in that they are generally substantially weaker in the euro area compared to the US.
3.3 RISKS NOT ADDRESSED IN THE COMPREHENSIVE ASSESSMENT
In broad terms, the carrying value of all assets was within the scope of the AQR, along with the calculation of the solvency ratio but with the exclusion of the calculation of risk weighted assets. Specifically, some further exposures were excluded from the review for various reasons.
- All positions accounted for at fair value except those classified as level 3 - these are the most illiquid and hard-to-value positions, with valuation reliant on unobservable model inputs. These were selected to concentrate resources on the instruments most likely to exhibit significant mis-valuation. Positions classified as level 1 or level 2 were excluded with the exception of any identified as inappropriately classified during the PP&A review performed at the start of the AQR, as explained in Section 6.1.3.
- All non-financial assets apart from investment and foreclosed property, and all liabilities (apart from those within scope of the fair value review).
- Provisions, other than those held for financial assets. For example, litigation provisions or provisions for operational losses were not reviewed.
Within the stress test, the prime objective was the projection of the solvency ratio, so most material sources of profit and loss were addressed, with the most notable exception being liquidity risk.
Other risk types that were accounted for in the stress test but not assessed in detail were:
- Operational risk including non-compliance and rogue trading risk.
- Litigation risk.
- Risks explicitly not considered under the current capital regime such as pension longevity and discount rate risk, exposure to improvement in own credit rating, legal reserves, and conduct reserves.
- Risks associated with regime change to existing items, where the new regime has not yet been agreed upon e.g. new accounting rules in IFRS 9.
Litigation provisions Conduct fines and litigation-related losses have become an increasingly material source of losses for banks globally, and a number of high profile cases (notably related to LIBOR fixing, FX, mis-selling of derivatives to public sector entities and sanctions compliance failures) remain open with further potential implications for euro area banks.
In the context of the comprehensive assessment, provisioning policies for legal risk were assessed and appropriate remedial actions requested for banks with identified deficiencies. The stress test focuses on macro-economic stress impacts and fines were not systematically projected over the horizon. The reasons for this are that future fines are highly uncertain and there is little relevant historic data to link the level of fines to conditions envisaged in the scenario. Indeed, there are concerns over whether historic data is relevant at all. In a bank-led exercise there is therefore limited room for consistent calculations; approximations would endanger the level playing field.
Given the materiality of some recent fines, the topic of litigation losses and legal risk will be high on the agenda for the ECB and NCAs. The transparency of the results presented in this report will allow market participants to take their own perspectives on the issue.
This chapter first describes the quality assurance that was performed nationally by NCAs and centrally by the ECB to deliver the comprehensive assessment in a consistent manner. While the processes differed slightly between each component, the aim was always the same: to maintain the quality and credibility of the results of the comprehensive assessment while harmonising the methodology across all participating banks. Central NCA and ECB oversight and challenge of submitted results was present throughout each component of the exercise.
The quality assurance conducted for the comprehensive assessment was very significant, requiring substantial effort from all participants - the 130 participating banks, the 19 NCAs, and the ECB. This chapter provides an overview of the magnitude of the work undertaken to achieve results of sufficient quality for both the AQR and the stress test.
The ECB and the NCAs worked together to conduct a robust quality assurance (QA) exercise during the AQR. Parts of the QA relied on the expert judgement of the NCAs and the ECB, and also drew on discussions in which the NCA bank teams were invited to explain their results where the ECB raised questions.
This sub-section outlines the process of quality assurance conducted on the AQR, including an overview of the types of checks conducted.
4.1.1 QUALITY ASSURANCE PROCESS
The QA process involved a "three lines of defence" model put in place by the ECB at the inception of the exercise |48| to guarantee the accurate and timely delivery of Phase 2. In addition, the banks themselves made significant efforts to supply data and other requested information to the necessary standard on time.
- The first line was the NCA bank teams, composed of NCA staff, independent auditors, appraisers, and/or other support professionals who were themselves on the ground conducting the exercise and interacting with the banks as required. Their role was to execute the AQR in line with the AQR Manual and supplementary guidance provided by the ECB, drawing upon data provided by the banks. The independence of the NCA bank teams was a defining feature of the exercise and guarantor of its integrity. The principle that no bank's NCA bank team should include external advisors that were recently the statutory auditors of that bank, nor NCA staff involved in the bank's day-to-day supervision, was followed throughout. Some 5,000 experts were involved in the first line execution of the AQR.
- The second line was the central NCA teams independently performing quality assurance on the work of the NCA bank teams and liaising with the ECB. NCAs were responsible for reviewing outputs provided by the banks at a debtor level to check for consistency across banks in the country. The ECB provided guidance on how NCA quality assurance teams should be organised, in particular requesting an operating model with a "four eyes principle" i.e. a double-checking policy to sign off results. NCAs were also expected to escalate quality assurance issues to the ECB by means of a shared "issue log" that was accessible by NCAs and the ECB. More than 1,000 experts were involved in the second line quality assurance of the AQR which greatly contributed to creating a level playing field throughout the SSM.
- The third line was the ECB, reviewing and challenging outcomes using an SSM-wide perspective to gain confidence that the methodology was applied consistently, as well as engaging with NCAs to investigate specific issues as required. This perspective benefited greatly from the quantity of data that was gathered by the ECB to allow comparison of results and generate a level playing field by using centralised benchmarks to support cross-country and internal consistency. Some 100 experts were involved in the third line quality assurance of the AQR, and the Supervisory Board together with the Governing Council of the ECB arbitrated concerning contentious quality assurance issues. In general, the ECB communicated with NCAs, but in exceptional circumstances also directly with NCA bank teams and the banks themselves.
In addition, there were seven "country teams" positioned between the second and third lines of defence. These were composed of around 30 members of the ECB spread across the 18 SSM NCAs, |49| with each team covering from one to four NCAs depending on the size and complexity of the relevant banks. Country teams visited their NCAs between four and twelve times during the exercise and were involved in all communication between NCAs and the ECB, guaranteeing that a view of each country's specificities was reflected.
Figure 11 AQR quality assurance model
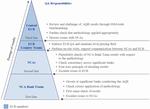
Click to enlargeThe role of the country teams was to be familiar with the progress and issues of their respective NCAs and to assist the central ECB team in maintaining a level playing field across the SSM. This was achieved through:
- Understanding their NCAs' governance process and QA function in a comparative context, escalating issues with them to the NCA and the ECB.
- Preforming spot checks on application of the methodology on specific files and portfolios.
- Conducting direct conversations with banks and NCA bank teams as required to verify results, particularly if they appeared to be anomalous.
- Checking that all QA issues raised by the ECB were resolved.
4.1.2 QUALITY ASSURANCE CHECKS PERFORMED BY THE ECB
Data collection for the comprehensive assessment was done through a number of templates provided by the ECB, on which quality assurance was conducted.
Figure 12 Overview of AQR quality assurance checks
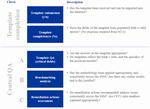
Click to enlargeDuring the process, the ECB gathered extensive data sets that facilitated granular checking of adherence to the methodology and consistency across NCAs. For example, 6 million data items were gathered for the credit file review, 10 million on the collateral valuation and 3 million on the collective provisioning work block. The analysis performed on this data allowed the ECB to identify areas of systematically different judgement, assess the impact, and engage with NCAs directly to change approaches.
The quality of results was improved by providing detailed feedback on unexpected data items, unfilled fields and outlier submissions, as well as reviewing issues escalated by the NCA country teams.
- More than 119,000 credit files were reviewed. Of these, the ECB provided line-byline feedback for around 50,000 problematic files, and reviewed (accepted or rejected) 28,000 justifications received from NCAs. The remaining 22,000 files were adjusted by NCA bank teams following ECB feedback.
- 170,000 collateral revaluations were submitted. Of these, the ECB provided line-by-line feedback for 66,000 problematic revaluations and engaged with the NCAs in 18,000 cases where the NCAs provided justification (accepting or rejecting them).
- For the projection of findings work block, 28 different QA checks were put in place, which helped to identify 3,200 portfolio-level issues, of which 1,900 were addressed through template resubmissions and the rest through discussions between NCAs, the ECB and country teams.
Granular analysis allowed the ECB to scrutinise the results of each work block on a bank, asset class and country level. Areas where expert judgement was provided by NCA bank teams or where there could be potential errors in the implementation of the methodology were challenged on a line-by-line basis by the ECB, requiring NCAs to justify specific results following ECB benchmarking. Areas in which calculated parameters were outside of expected ranges (e.g. probability of impairment and loss given impairment within collective provisioning) were identified for future analysis.
The most significant metrics benchmarked were the following, applied on a cross-SSM, cross-bank (especially within NCA) and portfolio level:
- Collateral haircuts applied for gone concern, non-performing debtors across major asset segments (real estate related, SME and large corporate).
- Collateral valuation assumption ranges on the country and bank level.
- Proportion of going concern cases with negative or very high implied EBITDA multiples and low provisioning levels.
- Levels of post-review NPEs with zero or low provision.
- Proportions of debtors with several impairment triggers hit where the debtor remains performing.
- Use of anomaly flagging (anomalies are unrepresentative debtors removed from projection of findings) and the impact of overrides.
- Collective provisioning probability of impairment.
- Collective provisioning cure rates.
- Collective provisioning loss given loss rates.
- Bank CVA figures relative to challenger model results - in particular when using banks' own exposure data.
4.1.3 CORRECTION OF MAJOR QUALITY ASSURANCE ISSUES
During the AQR, the ECB gathered detailed information on the results of each work block which allowed the central identification of erroneous application of methodology and interim results requiring further challenge. Where more contentious issues arose, the ECB engaged in bilateral discussion with NCAs and NCA bank teams to understand the exact application of the methodology in each case. Additional analysis was often presented by NCAs and NCA bank teams to justify the results. In cases of disagreement, central ECB QA staff proceeded with special on-site visits, challenged decisions on a line-by-line level, conducted targeted benchmarking, and/or requested new approaches. The following diagram outlines the process by which the more contentious issues were resolved, always with the aim of reaching consensus between the ECB and NCAs.
Figure 13 Quality assurance correction process

Click to enlargeIn cases of persistent disagreement, the ECB Governing Council would take the final decision.
4.1.4 IMPACT OF QUALITY ASSURANCE ON LEVEL PLAYING FIELD
The overriding purpose of the QA process was to maintain a high level of quality as well as a level playing field for all NCAs and banks undertaking the comprehensive assessment. As outlined above, the process of the QA was a very demanding exercise which relied on all participants in the comprehensive assessment, starting from the banks gathering information for the NCA bank teams through to the final layer of checking at the ECB. The following examples are presented to illustrate the beneficial impact of QA on maintaining the level playing field.
Manual, helpdesk and FAQ process
To provide consistent application of methodology, a prescriptive AQR Manual |50| was published, with an additional 28 circulars and 12 newsletters released by the ECB to all NCAs to address important issues that arose during execution of the exercise. To supplement this, the ECB also implemented a frequently asked questions (FAQs) and helpdesk process. In total, 3,792 FAQs providing clarification of the Manual and circulars were answered, and an additional 2,107 question responses and quality assurance issues were communicated, reviewed and resolved via the helpdesk. Finally, hundreds of hours of conferences were conducted with NCAs, NCA bank teams and banks to explain the methodology and facilitate experience sharing across the SSM with the aim of supporting the level playing field.
Example QA impact: credit file review As part of the central QA in the credit file review, the ECB performed comparative analyses of a number of quality assurance metrics on an SSM and country level. In cases where banks significantly deviated from the national and SSM average, the ECB requested the NCA to review the specific cases and provide further information. Among the quality assurance metrics examined were, for example, the treatment of impairment triggers for performing debtors, and me implied EBITDA multiple of non-performing debtors treated under the going concern approach.
Regarding impairment triggers, the ECB scrutinised instances in which debtors remained performing and two or more impairment triggers were hit. In these cases the ECB requested justification for the performing status of debtors and required banks to reconsider the classification, especially when the most serious impairment triggers such as "90 days past due" or "forbearance" were hit. This resulted in the reclassification of numerous performing debtors to the non-performing category. As a case study to illustrate this process, Figure 14 shows that before the ECB performed QA on the credit file review results, one bank was both significantly above the SSM and country average in terms of the relative number of performing debtors with two or more impairment triggers hit. In order to maintain a level playing field across all banks in the SSM, the ECB engaged in rigorous discussions with the NCA and challenged the explanations provided for the classification of debtors. This led to the reclassification to NPE for a number of cases where two or more impairment triggers were hit, although the specificities of individual cases were taken into account. The result of this process was a more consistent picture with no extreme outliers, as shown in Figure 14.
Figure 14 Example where two or more impairment triggers hit and debtor remains performing, as percentage of total performing debtors pre- and post- QA

Click to enlargeImpairment triggers include: Debtor is classified as defaulted according to Article 178 of CRR, equity reduced by 50% within a reporting period due to losses, debtor has requested emergency funding with the significant bank, a material amount past due to public creditors or employees, Current debt service coverage ratio is below 1.1, > 90 days past due on any facility at the debtor level (subject to materiality criteria), covenant breach not waived by the bank, ISDA Credit Event declared, all exposures that would be defined as forborne NPE as defined in EBA/ITS/2013/03, debtor has filed bankruptcy application, any legal entity within the group of connected clients of the debtor (incl. subsidiaries of the debtor) has filed bankruptcy application.
Another area of scrutiny during QA was the review of collateral haircuts applied on physical assets. Collateral haircuts are liquidation costs that reduce future proceeds from collateral execution. As exhibited below, the ECB benchmarked the market price haircuts of different banks for a specific asset class (e.g. real estate or large corporate collaterals) against each other and compared them to the country and SSM average. In all cases in which the haircut was significantly lower than discounts applied in other banks of the NCA and/or the SSM, the ECB challenged the bank's valuation model and requested an adjustment wherever haircuts did not seem to appropriately reflect market conditions. As illustrated in Figure 15, there were a number of instances where collateral haircuts were harmonised across the NCA and the SSM and the variance of assumed liquidation costs reduced. Figure 15 Example of the impact of credit file review QA on the haircut applied to the large corporate aggregate market value of collateral in one Member State

Click to enlargeNote: The exhibited number of banks are not necessarily exhaustive for the respective NCA.
4.2 STRESS TEST AND JOIN-UP QUALITY ASSURANCE
The stress test QA process is presented in detail in the ECB stress test methodology. |51| The ECB and the NCAs worked together to conduct a robust QA exercise for the stress test phase of the comprehensive assessment based on this methodology as well as the guidance published by the EBA. |52|
The QA process involved thorough analysis by expert teams based on granular data. Each bank provided around 300,000 individual data points, totalling approximately 40 million data points. Data quality issues were fixed in the QA process to reach stress test results of sufficient quality.
The purpose of the ECB quality assurance exercise was to check that banks were consistently applying the prescribed methodology and translating the impact of the baseline and adverse scenarios on their balance sheet in an appropriate manner.
The QA process was designed to:
- Maintain a level playing field - without a robust QA process, more conservative banks would be penalised relative to those that took a less prudent approach.
- Focus on material issues - the QA process was designed to quickly focus on areas where the bank's stress test results may materially differ from expected results.
The join-up combined the stress test and the AQR so that relevant AQR findings were appropriately integrated into the final stress test calculation. The join-up results were calculated using a join-up tool developed by the ECB which was field-tested with both NCAs and banks. The inputs to this calculation were selected templates from the stress test and AQR, both of which had already undergone extensive QA as described in this document.
The rest of this sub-section outlines the process of stress test quality assurance conducted by the ECB, including an overview of the types of checks, the correction process and the overall impact.
4.2.1 QUALITY ASSURANCE PROCESS
Stress test quality assurance process
The stress test phase of the comprehensive assessment involved the following elements:
- Independent quality assurance checks performed at the NCA level, validating that the bottom-up stress test conducted by the banks themselves was performed according to the EBA and ECB methodological guidance. The checks performed were designed by the individual NCAs and included, but were not restricted to, checks on data quality, template integrity, and consistency between the templates and explanatory notes provided by the banks. In addition, NCAs were also heavily involved in coordinating quality assurance feedback from the ECB to the banks under their jurisdiction.
- Reviews and challenges of outcomes by the ECB, using an SSM-wide perspective to support a consistent and prudent application of the methodology aimed at creating a level playing field across all banks. ECB-led QA involved checks across multiple dimensions (e.g. data quality, defined tests, qualitative assessment) and engaged NCAs and, where necessary, banks in resolution discussions. At the height of the QA process, 100 ECB staff were devoted to the stress test.
Join-up quality assurance process
There are several areas where the join up calculation, although mechanistic in nature, was unable to take into account all possible idiosyncrasies of each bank participating in the exercise. As such, there was a need to integrate specific QA to assess the appropriateness of results calculated in the join-up, and to agree on the final results for each bank. Join-up results were calculated by both the NCAs and the ECB, independently performing the calculation using a join-up tool developed by the ECB. This tool was distributed to NCAs for field-testing, whereby NCAs could provide feedback and questions; it was also sent to the participating banks, who had the opportunity to raise questions to the ECB. QA was focussed on identifying and agreeing the results whenever the NCA calculation and the ECB calculation initially differed (e.g. due to alternative model parameter choices).
4.2.2 QUALITY ASSURANCE CHECKS PERFORMED BY THE ECB
Stress test quality assurance checks performed by the ECB
The ECB conducted a series of quality assurance checks across many dimensions in an effort to achieve consistency throughout the SSM.
- Data quality and template integrity - these checks aimed to identify nonsensical or missing template inputs in an automated and conservative manner, allowing NCAs and banks the opportunity to correct these errors and improve data quality and results.
- Quantitative checks - so-called "RAG tests" |53| were defined in the ECB stress test methodology. |54| These tests, though automated and applied according to the methodology, were subject to prioritisation based on materiality according to potential impact of the issue on the bank's CET1 ratio. The ECB shared results of the RAG tests over the course of the exercise and provided feedback to NCAs and banks in six rounds. Further information on these checks are detailed below, while a full description can be found in the published methodology. |55|
- Qualitative checks - in addition, the ECB also identified qualitative issues which could not have been detected by either of the categories above. These often included, but were not restricted to, inconsistencies identified between banks' explanatory notes about their submitted stress test results or restructuring plans (if applicable) and their stress test template submissions, and misinterpretations of the capital definition and EBA methodology.
The quantitative RAG test checks defined in the ECB methodology covered all major risk types and other key elements of the stress test results, including: credit risk, market risk, securitisations, net interest income and other pre-provision profit. "Red", "amber" and "green" thresholds were defined. Guidance on how to interpret each of these categories is provided below for reference:
- "Green" implied coherence with the EBA methodology and that modification was not necessarily required i.e. those which did not trigger any pre-defined amber or red thresholds.
- "Amber" results were subject to an "explain or comply" test for which the thresholds for "explain" were laid down clearly and required objective evidence (e.g. two economic cycles to demonstrate low sensitivity of a credit portfolio to interest rate effects). If the bank could not demonstrate that its results were sufficiently conservative and could not meet the standards of evidence as specified by the ECB, it was requested to "comply" and adjust its results.
- "Red" results indicated clear breaches of EBA methodology and banks were required to resubmit revised results.
With the exception of the qualitative checks described above, all checks were performed using automated tools which produced standardised reports for each bank's stress test templates. These reports formed the basis for the QA interactions. All tests and checks for the stress test quality assurance were prescribed and conducted by the ECB. |56| In addition, the QA efforts benefited from statistical benchmarks provided by the EBA.
4.2.3 CORRECTION OF MAJOR QUALITY ASSURANCE ISSUES
One element of the quality assurance was a comparison of the stress test results with the ECB's top-down benchmark model, with modules relating to the key elements of the stress test: credit risk, market risk, securitisations, net interest income and other pre-provision profit. These benchmarks were used as indications of deviations and by no means provided full evidence of the evolution of the main balance sheet items under stress at an individual bank level.
Both the ECB and NCAs were engaged in the correction process for amber and red test results. The ECB, leading the centralised QA process, ensured that all such test results were assessed in a harmonised manner, and that the requests for corrective action were similarly harmonised in the interest of a level playing field. NCAs were responsible for the interactions with the banks and implementation of the corrective action when deemed necessary. Amber checks were prioritised by those with the most material impact on the CET1 capital ratio, and then by the more material parameters and portfolios.
For banks with exemptions to the static balance sheet assumption (due to DG Competition-approved restructuring plans), the same checks and the same process as described above were implemented. However, these were adapted to reflect the dynamic nature of the exercise, in particular as follows:
- Some of the RAG tests would not apply to the same extent (e.g. red flags would become amber, or amber flags would no longer be applied) based on the restructuring plan. These were typically addressed through the same quality assurance described above.
- Some additional ECB guidance was provided that set limits on what improvements could be assumed via the restructuring plans in both the baseline case and adverse scenarios. Additional information was requested to verify compliance with these limits. The ECB followed up on these issues through additional qualitative checks.
4.2.4 IMPACT OF QUALITY ASSURANCE ON LEVEL PLAYING FIELD
The overarching purpose of the QA process was to build quality in submissions and maintain a level playing field for all NCAs and banks undertaking the comprehensive assessment. The QA was a very demanding exercise, and relied on many of the participants in the comprehensive assessment. The banks provided numerous template iterations, NCAs performed their own QA exercises, and there was a final layer of review at the ECB.
The stress test QA led to a revision of the bottom-up stress test results in comparison to the first submissions, addressing the raised concerns. In areas of disagreement, banks were subject to an "explain or complain" requirement. Reflecting the fact that the EBA exercise was a bottom-up stress test exercise, the QA process had defined standards of evidence, as outlined in the ECB stress test methodology, that banks would have to meet in order to justify material divergences from expected values. When bank explanations were rejected, they were asked to comply with the requirements of the methodology.
QA was performed over multiple rounds, with banks submitting updated templates for further testing and analysis. Comparing the first clean data submission to the final stress test results shows that the overall impact of QA moved the aggregate CET1 ratio across all participating banks down by 0.6 percentage points. To maintain a level playing field, where banks did not comply, and no explanation was provided to the satisfaction of the ECB, a quality assurance adjustment (QAA) was defined by the ECB in conjunction with the NCAs to prescribe required adjustments to specific items. This was shared with the bank as part of the supervisory dialogue process, and applied to 26 banks which made the updates as required.
Manual and helpdesk
To complement that application of EBA methodology, the ECB published further guidance which described the QA process and RAG checks that were to be applied. A number of methodology clarification papers were also produced on specific topics to support banks and NCAs. To supplement this, the ECB and EBA also implemented a helpdesk process which involved answering nearly 1,500 questions, and a further 235 join-up process questions were also answered. Conferences were conducted with NCAs and banks to explain the methodology and facilitate experience sharing across the SSM with the aim of supporting the level playing field.
Example QA impact: Credit loss evolution As part of the central QA in the credit file review, the ECB performed a number of analyses as specified in the ECB stress test methodology. Among the QA metrics examined was, for example, a comparison of the evolution of credit loss rates on performing exposures (i.e. the CR07 check, as specified in the methodology).
For this specific case, the evolution of the bank's expected loss estimate for each portfolio was compared to the benchmark evolution which had been developed and shared with the banks prior to the start of the exercise. Where the evolution was materially different from the benchmark, the bank was provided with a report which specified the item(s) of concern, the magnitude of the concern and the change that would be required to move within an acceptable range. Some of the flags were implemented by the banks ("comply"), while for others the bank chose to submit an explanation for the deviation addressing the standards of evidence in the ECB stress test methodology. In the case of the CR07 check, the standards of evidence included a description of the bank's stress testing model, underlying data sources and performance statistics. Explanations were either accepted or rejected by the NCA and ECB, with the banks asked to make the necessary adjustments for rejected explanations.
The final element of quality assurance for the comprehensive assessment was the process of the supervisory dialogue. The supervisory dialogue meetings were discussions of partial and preliminary results prior to the final disclosure of full bank results. In total 129 supervisory dialogue sessions were held in Frankfurt for all participating banks |57| over the two weeks from Monday 29 September to Friday 10 October 2014. These took the form of in-person discussions involving ECB representatives (including the ECB JST coordinators, ECB senior management, and content experts selected for specific banks), NCA representatives, and a delegation from the bank itself.
The purpose of the supervisory dialogue process was to get final confirmation of comprehensive assessment inputs from banks, as well as clarify any potential misunderstandings or issues the banks may have had with the data discussed. Another goal was to provide banks with a first impression of their AQR and stress test results to allow them to begin preparing their market response. Banks were provided with the documents that were discussed 24 hours prior to the meeting. This document contained preliminary impact numbers for the stress test and a partial view on both AQR and join-up impacts as well as further detail on the key drivers behind comprehensive assessment outcomes for the bank in question. The partial and preliminary nature of supervisory dialogue materials was guaranteed by only selecting a subset of 1-6 portfolios for discussion, while results for the remaining portfolios were neither discussed nor included in meeting materials.
Supervisory dialogue meetings represented an important step in engaging with the banks and allowing them to raise comments or questions to the ECB. Banks engaged with ECB and NCA representatives during the discussions and the ECB provided banks with the opportunity to register further questions in a 48-hour window following their meeting. In total, the ECB received and responded to more than 530 questions. A number of these questions and comments were deemed of lower priority and will be addressed by JSTs following disclosure of the comprehensive assessment results as part of the supervisory process.
5 AGGREGATE OUTCOMES OF THE COMPREHENSIVE ASSESSMENT
This chapter first shows the aggregate change in available and required capital that was projected by the comprehensive assessment under the adverse scenario, and then details the capital shortfall that arises after comparing this against the relevant thresholds.
5.1 PROJECTED CAPITAL CHANGE UNDER THE COMPREHENSIVE ASSESSMENT
The comprehensive assessment adverse scenario capital impact across the 130 banks is �262.7 billion, as can be seen in Figure 16 below. This includes projected capital depletion of �215.5 billion, representing 22% of total CET1 capital held by the banks at 31 December 2013 |58|, and an increase in RWA of �858.6 billion. This capital impact reflects the results of both the AQR and the stress test.
The AQR required changes to asset carrying values of �47.5 billion, which led to depletion of capital of �33.8 billion after tax effects and portfolio guarantee offsets were taken into account. Additionally, RWA were increased by �12.7 billion, mainly due to the deferred tax assets (DTAs) that arose due to the tax effects. This led to an increase in required capital of �1.0 billion (converting RWA into CET1 at the baseline scenario threshold rate of 8.0%). The results of the AQR are discussed in detail in Chapter 6.
The stress test adverse scenario resulted in a further depletion of capital of �181.7 billion. Moreover, RWA increased by �858.6 billion throughout the scenario (which includes the AQR impact on RWA). Applying the relevant threshold of 5.5%, this increase in RWA led to an increase in required capital of �47.2 billion. This results in the overall impact of � 262.7 billion stated above. Further details on this projection, as well as the comparison to the baseline scenario, is shown in Chapter 7.
Note that this does not represent the capital shortfall, due to excess capital being held by many banks, but rather the adjustments to available CET1; the shortfall is described in the next section.
Figure 16 Comprehensive assessment adverse scenario impact on capital
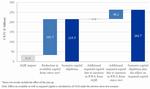
Click to enlargeFigure 17 shows the same impacts in terms of CET1 ratio (again on an aggregate level across the system). This demonstrates the mean reduction in CET1 ratio of 3.4%.
Figure 17 Comprehensive assessment adverse scenario impact on capital ratios
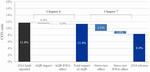
Click to enlarge5.1.1 DISTRIBUTION OF THE COMPREHENSIVE ASSESSMENT IMPACT
As shown in Figure 18 the absolute capital impact under the adverse scenario is greatest in France, Italy and Germany.
Figure 18 Comprehensive assessment projected adverse scenario impact on capital by country of participating bank

Click to enlargeThe distribution of impact on CET1 ratio for the participating banks is shown below. As shown above the mean impact is 3.4% of CET1 while the median CET1 ratio saw a 4.0% reduction from 12.4% to 8.3%.
Figure 19 Development of CET1 ratio distribution by participating bank

Click to enlarge5.2 SHORTFALL IDENTIFIED BY THE COMPREHENSIVE ASSESSMENT
Each bank in the comprehensive assessment was required to retain an 8% CET1 ratio after accounting for the effect of AQR results on their year-end 2013 balance sheet. Each bank was also required to maintain an 8% CET1 ratio at each year-end during the baseline stress test scenario, and a 5.5% CET1 ratio at each year-end during the adverse stress test scenario.
As discussed in Section 5.1, the total projected change in capital from the comprehensive assessment is �215.5 billion. Moreover, the RWA increase by �858.6 billion throughout the scenario to 2016, increasing the capital requirements. Offsetting this impact is the excess capital held by the participating banks i.e. CET1 capital held in excess of the comprehensive assessment thresholds. Taking into account capital buffers, a total shortfall against the defined capital thresholds for all 130 banks of �24.6 billion remains. |59|
Figure 20 Comprehensive assessment shortfall by main components
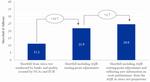
Click to enlargeAs shown above the total shortfall can be disaggregated into the main components of the comprehensive assessment by identifying:
- Shortfall from the bottom-up stress test - this is the aggregate shortfall (under both baseline and adverse scenarios, measured against their respective thresholds) using only the bottom-up stress test results as submitted by banks, after quality assurance and any quality assurance adjustments requested by the ECB.
- Shortfall adding AQR starting point adjustments to the bottom-up stress test- this is the aggregate shortfall (under the baseline and adverse scenarios, as well as the standalone AQR result measured against their respective thresholds) using only the bottom-up stress test results with the initial available capital modified by the AQR result.
- The full comprehensive assessment shortfall - this is the aggregate shortfall as presented at the beginning of this chapter, measuring against all applicable thresholds and using stress test results with full reflection of AQR adjustments in initial available capital and projected asset performance (i.e. the join-up effects).
5.2.1 DISTRIBUTION OF THE COMPREHENSIVE ASSESSMENT SHORTFALL
The distribution of capital shortfalls is shown below on a country level, again providing a disaggregation into the main components of the exercise. Here, the shortfalls are shown proportional to the total RWA at the country level.
Figure 21 Capital shortfall by component of the comprehensive assessment by country of participating bank

Click to enlargeThe �24.6 billion capital shortfall is proportionally highest in Cyprus, Greece, Portugal and Italy. In total, 25 banks have a comprehensive assessment capital shortfall, as shown in Figure 22. |60|
Figure 22 Capital shortfall by country of participating bank
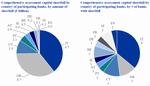
Click to enlargeAs shown in Figure 23, higher shortfalls were identified for small to mid-sized banks, and the banks with DG Competition-approved restructuring plans which used a dynamic balance sheet assumption in the stress test as per the EBA methodology.
Figure 23 Capital shortfall grouped by bank stress test balance sheet type and RWA size group

Click to enlargeA capital shortfall has been identified for 25 banks, representing about 20% of all banks subject to the comprehensive assessment. Further detail on the distribution of capital shortfall (and the absence thereof) can be found in Figure 24 below.
Figure 24 Capital shortfall bank distribution
Note: Positive numbers imply a shortfall for the participating banks. 
Click to enlargeThis chapter provides detail on the key outcomes of the AQR. First, in Section 6.1, the harmonisation of key asset quality metrics is addressed. This was both part of the preparation of the AQR and a key output of it. Second, in Section 6.2, the AQR adjustments are discussed in detail. Finally, in Section 6.3, the more qualitative outcomes of the accounting and policy reviews conducted as part of the AQR are presented.
6.1 HARMONISATION OF ASSET QUALITY METRICS
As part of the AQR, a substantial amount of preparation was necessary to get a complete and coherent data set for the later stages of the review. This was achieved through the data integrity validation process performed on the loan tapes gathered for use in the AQR. Additionally, the ECB worked to harmonise asset quality metrics:
- NPE status: NPE definitions vary across the SSM and a reasonable level of standardisation was required so that asset quality results were comparable, and that intermediate steps of the AQR (such as selecting a sample for detailed review) were effective - to this end, the EBA simplified NPE definition (as explained in section 6.1.1) was applied across all banks.
- Fair value hierarchy: as only level 3 exposures (i.e. those without liquid markets for which pricing models rely upon unobservable parameters) were reviewed in the AQR, it was imperative to check that the classification of those exposures was accurate.
6.1.1 NPE DEFINITIONS
Across the SSM, participating banks' definitions of NPE varies materially. Therefore, in order to achieve comparability, the AQR imposed a standard definition of NPE. This definition was a simplified version of the final draft implementing technical standards (ITS) on forbearance and non-performing exposures published by the EBA on 21 October 2013. |61| According to this simplified approach |62| any debtor with one or more facilities that fulfil any of the following criteria was marked as non-performing:
- Every material |63| exposure that is 90 days past-due even if it is not recognised as defaulted or impaired.
- Every exposure that is impaired (respecting specifics of GAAP vs. IFRS banks).
- Every exposure that is in default according to CRR (i.e. "unlikely to pay").
The EBA ITS definition of NPEs is applicable to all participating banks and came into force in September 2014 with first reporting on 31 December 2014. Therefore, by applying the EBA ITS simplified approach, |64| the AQR applies a consistent but technically feasible definition in line with most recent guidelines. |65|
The figure below shows the difference in bank NPE definitions vs. the EBA simplified approach discovered during the PP&A review:
Figure 25 Bank internal NPE definition compared to key EBA ITS simplified NPE approach
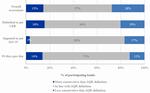
Click to enlargeThe change in NPE definition was verified through the data integrity validation process, and then checked on a file-by-file basis during the credit file review (CFR) for residential real estate and all non-retail asset classes. Any changes to NPE status were then projected to the unsampled portion of the portfolio. As such, after the AQR, NPE definitions across the euro area countries for the participating entities were much more harmonised. The result is illustrated below in Table 3.
Due to the fact that on average banks' internal definitions were less conservative than the simplified EBA approach, the application of the simplified approach led to an increase in NPE stock of �54.6 billion from �743.1 billion to �797.7 billion. The CFR and the projection of findings led to an additional increase in NPE of �81.3 billion, resulting in a total increase �135.9 billion to �879.1 billion of post-CFR NPEs across the participating banks as a result of the AQR. The impact of the application of the EBA simplified approach and the credit file review on the stock of NPEs varied amongst debtor geographies, with overall increases among SSM debtor geographies ranging from 7% to 116%.
Table 3 Impact of application of EBA ITS simplified NPE approach and the credit file review by AQR asset class Asset class NPE internal definition (� billion) EBA NPE pre-CFR (� billion) % delta definition EBA NPE post-CFR (� billion) % delta CFR total % delta AQR Residential Real Estate 118.5 127.9 8.0% 134.6 5.2% 13.6% Retail SME 79.8 83.1 4.2% 83.1 0.0% 4.2% Other Retail 55.6 56.2 1.1% 56.3 0.1% 1.2% Large SME 146.3 155.6 6.4% 173.9 11.7% 18.8% Large Corporates 101.6 116.8 14.9% 135.4 15.9% 33.3% Real Estate Related 199.8 210.1 5.1% 236.5 12.6% 18.4% Shipping 26.0 27.9 7.3% 35.4 26.6% 35.8% Project Finance 6.0 6.4 5.5% 7.9 24.3% 31.2% Other non-retail 9.5 13.7 44.2% 16.0 17.3% 69.1% SSM 743.1 797.7 7.3% 879.1 10.2% 18.3% 6.1.2 APPLICATION OF THE FAIR VALUE HIERARCHY
All exposures held at fair value are assigned a level in the fair value hierarchy which classifies them on the basis of the inputs to their valuation, following IFRS 13:
- Level 1: quoted prices in active markets for identical assets or liabilities that the entity can access at the measurement date.
- Level 2: inputs other than quoted market prices included within level 1 that are observable for the asset or liability, either directly or indirectly.
- Level 3: unobservable inputs.
The AQR only performed revaluations on exposures with level 3 inputs in their valuation, which are considered the most complex. Also, banks are obliged by IFRS 13 to disclose the volume of fair value exposures they have at each of these levels. Hence, to maintain the accuracy of the AQR's fair value exposure review, a prior review of the level classification for each participating bank was performed.
The review of this in the AQR comprised two steps, both executed via the PP&A review. The first step was a review of policies in place that are required to accurately identify fair value hierarchy levels, resulting in the following findings:
- Only 67% of banks have a clear policy to define an "Active Market".
- Only 72% of banks have a clear policy to define level 3 inputs, although a higher number (85%) of banks appear to have a clear policy which defines "level 3".
A review of a number of specific instruments (selected due to the expected proportion of level 3 exposures (e.g. rainbow options)) was then conducted to check for misclassified exposures. The results of this review are shown in Figure 26.
Figure 26 Bank classification of derivative and non-derivative holdings under the IFRS 13 fair value hierarchy

Click to enlargeAny situation in which the NCA bank team disagreed with the participating bank's classification was then considered for selection in the fair value exposures review, and is recorded in the fair value exposures in the bank level disclosures of the comprehensive assessment.
6.2 AQR ADJUSTMENTS TO ASSET CARRYING VALUES
The total adjustment to asset carrying values as a result of the AQR was �47.5 billion. This is shown by country of participating bank in the chart below:
Figure 27 Gross AQR adjustment by country of participating bank

Click to enlargeAcross the SSM, the mean AQR CET1 net change ranged from -0.2% to as much as -2.9%. On the bank level, in the most extreme case the net AQR impact was -5.8%.
This section provides a detailed discussion of the drivers of the �47.5 billion adjustment, disaggregating the result into its three major components: |66|
1. Additional provisions resulting from the non-performing non-retail debtors from the risk-based sample that were individually assessed and then projected to the rest of the portfolio.
2. Additional provisions identified through the collective provisioning assessment of all performing exposures and non-performing retail exposures. |67|
3. Impacts from the fair value exposures review.
Figure 28 Impact of the AQR by component
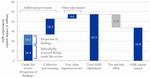
Click to enlargeEach component of the AQR had several drivers which are discussed in more detail in the following sections - first the individual specific provisioning assessment (credit file review, collateral valuation and projection of findings) is discussed in Section 6.2.1, followed by the collective provisioning assessment in Section. 6.2.2, and finally the fair value exposure review in Section 6.2.3. |68|
Table 4 Summary of AQR adjustment by component AQR component Adjustment Section Individually assessed provisions �26.8 billion 6.2.1 Credit File Review �16.4 billion 6.2.1.1 CFR - reclassified NPEs �6.5 billion 6.2.1.1 CFR - non-reclassified NPEs treated under gone concern �5.6 billion 6.2.1.1 CFR - non-reclassified NPEs treated under going concern �2.6 billion 6.2.1.1 CFR - netting impact �1.8 billion 6.2.1.1 Projection of Findings �10.3 billion 6.2.1.2 Collectively assessed provisions �16.2 billion 6.2.2 Collective Provisioning - specific provisions �6.1 billion 6.2.2 Collective Provisioning - IBNR �10.1 billion 6.2.2 Fair Value exposures �4.6 billion 6.2.3 Level 3 non-derivative revaluation �1.2 billion 6.2.3.1 CVA Challenger model �3.1 billion 6.2.3.2 Level 3 derivative pricing model review �0.2 billion 6.2.3.3 Total AQR adjustment �47.5 billion 6 6.2.1 INDIVIDUALLY ASSESSED PROVISIONS
6.2.1.1 Credit file review
Following the review of all 119,120 |69| sampled debtors across the SSM, the overall impact of the credit file review was an increase in provisions of �16.4 billion |70| from �93.7 billion to �110.2 billion. Given that only provisions for NPEs were reviewed, all provisioning adjustments under the credit file review were specific.
This increase in provisions by asset class is shown below.
Figure 29 Summary of impact of provisions by asset class

Click to enlargeNote: Other includes other non-retail debtors as well as debtors that were either reclassified from corporate to retail or vice versa during the CFR. Moreover all debtors for which information for a detailed review were unavailable were allocated to the asset segment "Other".
The overall impact derives from 40,518 NPE debtors, which can be split between those debtors reclassified to non-performing, and those that were existing NPEs. The impact can also be split on the provisioning approach applied - the largest overall change was driven by gone concern debtors given this approach is implicit of a more severe situation for the relevant debtors.
- Reclassified NPEs (i.e. exposures reclassified from performing to non-performing) - the reclassification of credit files from performing to non-performing lead to provisions of �6.6 billion, which can be split as �2.5 billion for going concern debtors and �4.0 billion from gone concern debtors. |71|
- Existing NPEs (i.e. non-reclassified exposures that remained non-performing) - �8.1 billion of impact was due to the deterioration of existing NPEs.
- For gone concern debtors under threat of liquidation, for which the collateral valuation work block was relevant, provisions increased by �5.6 billion.
- For going concern debtors, the NCA bank teams investigated the cashflow valuation of the debtor and adjusted provisions as appropriate, a �2.6 billion increase in total. |72|
Figure 30 Impact of the credit file review by driver
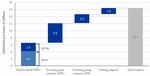
Click to enlarge1 Due to the prudential nature of the AQR methodology, the minimum provision change for a portfolio due to the AQR is zero, as explained in section 3.2.1. This netting impact occurs by combining the results of the individual and collective provisioning assessments, i.e. after the credit file review. The analysis presented in the rest of this section, however, is based on debtor-level information through the credit file templates before netting occurs. The netting impact of �1.8 billion is the difference between the final outcome, i.e. after netting, and the standalone credit file review outcome. Parts of this netting can also be attributed to unavailable information on the provisioning approach of the debtor (i.e. gone or going).
Key drivers of the results of the credit file review
The review of individually impaired credit files |73| first involved a classification assessment to identify the debtors that remained non-performing or required reclassification to NPE.
Reclassified NPEs
�6.6 billion of additional provisions was due to the reclassification of 6,094 of debtors representing 12.2% of total debtors that were originally classified as performing. As shown in Figure 31, across the SSM, the participating country average proportion of reclassified debtors ranged from 6% to 32%. On the bank level average, the range is 0% to 43%.
Figure 31 Number of reclassified NPEs by country of participating bank
Click to enlargeNote: The number of originally performing and reclassified NPEs includes also debtors that were either reclassified from corporate to retail or vice versa and have undergone a full CFR review.
A review of the impairment triggers hit for reclassified NPEs shows that the most common impairment triggers that were hit were forbearance and a debt service coverage ratio of less than 100%. As per Table 5, in approximately 6% of cases when the key impairment triggers were hit, the NCA bank teams specifically noted that reclassification occurred due to misalignment with accounting practice.
Table 5 Distribution of impairment triggers for reclassified NPEs Trigger Times hit % of reclassified debtors % due to accounting error Forborne NPE 2,677 43.9% 6.2% DSCR <1 2,238 36.7% 6.5% Connected client impaired 938 15.4% 7.5% PD = 1 787 12.9% 2.3% Days past due >90 493 8.1% 6.9% Bankruptcy 355 5.8% 6.2% Covenant breach 339 5.6% 6.5% Within the reclassified debtors, 4,152 were treated under the gone concern approach and led to �4.0 billion of additional specific provisions; 1,797 were assessed as going concern with �2.5 billion additional provisions. |74| Across the SSM, participating country average coverage ratios for reclassified gone concern NPEs ranged from 2% to as high as 32%, while going concern exhibited a coverage ratio between 0% and 37%. On the bank level, coverage for reclassified NPEs under gone concern ranges from 0% to 61%, for going concern NPEs from 0% to 85%.
The total provisions and the coverage ratios that were found for reclassified debtors are shown below, split by provisioning approach and asset class:
Figure 32 Change in provisions and coverage ratio by asset class for reclassified NPEs

Click to enlargeExisting NPEs
For the 34,424 debtors that remained NPE, the provisioning approach assessment determined that 26,692 debtors were to be treated under the gone concern and 5,600 under going. |75| The total adjustment amounted to �8.1 billion, split between �5.6 billion for gone concern and �2.6 billion for going concern.
Figure 33 Change in provisions and coverage ratio by asset class for going and gone concern existing NPEs

Click to enlargeFor gone concern debtors, corporate, SME, and real estate related exposures were particularly impacted given the bearing of collateral revaluations (as discussed in detail below in "Other drivers of the results of the credit file review").
For going concern debtors, the NCA bank teams investigated the cashflow valuation of the debtor and adjusted provisions as appropriate. The majority of the result was driven by large corporates (�1.2 billion increased provisions and 3.1 coverage ratio percentage points increase) and shipping (�0.8 billion and 7.2 coverage ratio percentage points increase), given their propensity for being treated on a going concern basis due to more stable cashflows.
In general, the increase in coverage ratio for gone concern existing NPEs was larger than for going concern debtors, reflecting the implication that gone concern cases face more severe conditions whereby collateral liquidation is the more likely workout strategy.
Figure 34 Pre- and post-AQR coverage ratio by asset class for going and gone concern existing NPEs

Click to enlargeOther drivers of the results of the credit file review
Collateral and real estate valuation
The collateral and real estate valuation work block was run during the credit file review process and was relevant for NPE gone concern debtors for which collateral liquidation was the more likely workout strategy i.e. collateral valuation reductions led to increased provisions. The total value of collateral for existing NPE gone concern debtors decreased by 10% and provisions increased by �5.6 billion. As collateral coverage was an important driver of required provisioning levels for non-performing exposures under the gone concern approach, the review of bank internal valuations for collateral assets was essential for the assessment of appropriate provisioning levels in the credit file review. In addition, the work block provided updated real estate property values and appraisal haircuts to be used in the loss given loss (LGL) calculation for residential real estate portfolios in the collective provisioning work block. To that end, the valuations of all physical collateral items for sampled debtors were reviewed. The main portion of reviewed collateral consisted of real estate and shipping assets, with other items including aircraft and "other" assets ranging from machinery, tools and vehicles to artwork. Throughout the review, approximately 170,000 collateral items with a total value of �367 billion were investigated. A qualifying previous appraisal was available for around 65,000 collateral items; for the purpose of the AQR, this appraisal was indexed to 31 December 2013. For the remaining 105,000 items, no qualifying reappraisal was available and a full revaluation was carried out as part of the AQR.
Outcome of the collateral valuation work block
Across the SSM, collateral values were adjusted downwards by �39 billion representing an approximate 10% decrease compared to previous bank internal valuations. This decrease was driven by a change in price indices |76| as well as by changes due to AQR revaluations. Figure 35 illustrates the impact of both effects on the aggregated collateral value. For collateral items that required a reappraisal, the total adjustment can be split into a change in property value due to indexation and an incremental change as a result of the revaluation.
Figure 35 Collateral valuation adjustments throughout the AQR

Click to enlargeThe collateral value reduction most severely affected commercial real estate (CRE) properties and land, both in absolute and relative terms.
Figure 36 Collateral value reduction for selected real estate property types

Click to enlargeNote: Positive numbers imply a collateral value reduction.
The majority of real estate collateral valuation adjustments stem from collateral located in the Mediterranean and Central Europe, both in absolute and relative terms. However, whereas the adjustment for Central European collaterals almost exclusively stems from a change in price indices, Mediterranean collaterals were further adjusted through AQR-revaluations.
Figure 37 Collateral value adjustment by location of real estate collateral |77|
Click to enlargeDrivers of valuation adjustments
An important factor influencing the severity of collateral value adjustments was the quality (completeness and accuracy) of the information available to the banks and NCA bank teams. Figure 38 shows the aggregated relative adjustment to collateral values by date of the last internal bank appraisal both for indexed and reappraised collaterals.
Figure 38 Real estate collateral valuation adjustment by year of last appraisal
Click to enlargeFigure 38 shows that the average relative adjustment increases with the age of the last reappraisal, indicating that collateral prices have on average fallen since 2005. Further, it shows that the average haircut applied on top of the indexation also increases with the age of the last appraisal. Hence, whereas for recent appraisals the indexation yielded relatively accurate results, it was less suitable for older appraisals driving the total adjustment made to collateral values.
Depending on the quality of information available, NCA bank teams applied different valuation methods. For residential real estate, for instance, a valuation based on net effective rent was conducted where sufficient information was available. In other cases a valuation based on comparable properties or on expected cash flows was conducted. Figure 39 splits the adjustment to bank internal valuations by the reappraisal method used; for cases where a valuation on net effective rent was conducted, the indexed bank valuations were found to be in line with NCA bank team reappraisals, whereas they were adjusted downwards significantly in cases where another appraisal method was used.
Figure 39 Real estate valuation adjustment by reappraisal type (only reappraised properties)

Click to enlargeAdditional detail on the review of shipping exposure
The ECB placed particular emphasis on the treatment of shipping exposure across the SSM given the divergent practices observed across banks and NCAs. Following the credit file review, a total of 21.3% of the shipping debtors reviewed were reclassified to non-performing, and the total amount of provisions increased from �5.9 billion to �7.3 billion (+25%). The countries with high levels of exposure to the sector are Germany, Italy, the Netherlands and Greece, and a breakdown of the �1.5 billion increase in provisions can be seen below.
During the AQR quality assurance, the ECB became concerned about the high sensitivity of certain German banks' CET1 ratios to long term cash flow assumptions used for provisioning of shipping loans. This sensitivity was due to particularly large amounts of non-performing shipping exposures valued under the going concern approach, where provisions were derived from discounted values of projected cash flows (in accordance with IFRS rules and the AQR methodology). With a view to the elevated level of uncertainty on the medium and long term development of the shipping markets, the ECB raised doubts on the reliability of these cash flow projections for the purposes of the AQR. After consultation with the NCA, the ECB imposed prudential buffers on the present values of projected cash flows used for calculating provisions on shipping portfolios of German banks. These prudential buffers were applied solely for the purpose of the AQR and do not constitute a judgment on the use of projected cash flows for accounting purposes.
Figure 40 Provision increases for the shipping industry by country of participating bank |78|
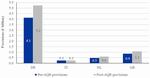
Click to enlarge6.2.1.2 Projection of findings
The findings of the sample from the credit file review were extrapolated to the unsampled population of each portfolio, which led to additional �10.3 billion of provisions. Findings were extrapolated both on required provisions and NPE classification.
AQR assessed provisions
For all non-retail portfolios, the change in provisions required for sampled debtors using the AQR methodology was projected to the unsampled portfolio populations. This was the main finding from the work block for non-retail portfolios. The effect of projection to the provisioning adjustments made during the credit file review can be seen below.
Figure 41 Impact of projection of findings on non-retail provisioning

Click to enlargeClassification adjustments
The incidences of change in performance status found during the credit file review i.e. the reclassification of an exposure from performing to non-performing or vice-versa, was also projected for both non-retail and RRE portfolios. This fed directly into collective provisioning calculations in several ways -detailed information is provided in section 6.2.2.
Key drivers of the results of the projection of findings
AQR assessed Provisions
Overall, the projection of findings resulted in an extra �10.3 billion of provisions on top of the findings from the credit file review, feeding directly into the calculation of the AQR-adjusted CET1 ratio of each bank. The amount of additional provisions from the credit file review of the sample compared to the projection of the sample varied widely by portfolio. The key driver of this variation was the portfolio type, for two main reasons:
- Sample coverage variation - large portfolio types naturally had a lower coverage rate, and hence a proportionally larger exposure on which to project.
- Variance in prudence of existing provisions - certain portfolio types were found in general to be less prudently provisioned against than others.
The following shows the absolute contribution from the sample and projection by type:
Table 6 Illustration of provisioning impact of the projection of findings split by portfolio type Asset segment Additional provisions CFR
(� billion)Projected additional provisions CFR
(� billion)Total additional provisions
(� billion)Large SME 3.6 5.6 9.1 Real estate related 5.4 2.3 7.7 Large corporates 5.5 1.6 7.1 Shipping 1.4 0.8 2.2 Project finance 0.4 0.0 0.4 Other non-retail 0.1 0.1 0.2 Total 16.4 10.3 26.8 Impact of classification adjustments
Overall, projection of findings identified an extra �35.3 billion of NPE exposure compared to that originally reported to the ECB. On top of �46 billion from the credit file review, this totals �81.3 billion. This was factored into the collective provisioning calculations as explained in further detail in the next section.
6.2.2 COLLECTIVELY ASSESSED PROVISIONS
The collective provisioning work block involved a review of participating banks' collective provisioning models, both qualitatively and quantitatively. This review applied to non-performing retail exposures (for which specific provisions are calculated) as well as to all performing exposures (for which incurred but not reported losses, IBNR |79|, is calculated). In total, 765 portfolios across most AQR asset classes |80| and more than 40 debtor geographies were in-scope for this work block.
As part of the qualitative review, NCA bank teams assessed the compliance of collective provisioning models employed by participating banks with relevant accounting standards. This included a review of the scope of each bank's model, its calibration, assumptions and expert judgement applied. Where bank models were found to be out of line with accounting standards, bank teams defined remedial actions to be implemented by participating banks during or after the AQR.
For the purpose of the quantitative review, NCA bank teams developed a so-called "challenger model" which was applied to all portfolios in-scope for this work block. For each portfolio, the outcome of the challenger model was compared to the provisions recognised by the bank. For 49% of the in-scope portfolios, the challenger model resulted in provisions below participating banks' provisions, whereas for 51% portfolios, the challenger model outcome exceeded the significant banks' provisions. Where the challenger model outcome significantly exceeded |81| the bank's provisions, further investigation was required and in many cases this resulted in additional collective provisions to be recognised for the purpose of the AQR.
Across all participating banks and portfolios, the collective provisioning work block identified the need for additional collective provisions of �16.2 billion, �6.1 billion of which represent additional specific provisions for retail debtors and �10.1 billion of which represent additional IBNR. In relative terms, across the participating banks, this translates into an increase in IBNR of roughly 23% and an increase in specific provisions of about 6%. The main drivers of the increases due to cases of significant deviation are explained later in this chapter.
Figure 42 Additional collective provisions by type of provision

Click to enlargeRetail NPE: Additional specific provisions resulting from collective provisioning
Specific provisions account for a significant part of participating banks' collectively assessed provisions. The following paragraphs provide more detail on the �6.1 billion of additional specific provisions identified as a result of the AQR and, afterwards, lists the most significant drivers impacting this result.
Outcome
Across the SSM, 95 retail portfolios held by 56 participating banks were found to have insufficient levels of specific provisions. In total this led to an increase in specific provisions of �6 billion. A significant majority (69%) of these additional provisions stemmed from residential real estate portfolios, followed by retail SME (18%) and other retail (13%). This pattern still largely holds when taking into account the relative size of the asset classes (as measured by credit RWA) - the most significant relative adjustment was made to residential real estate portfolios with an adjustment of about 74 basis points of credit RWA. Figure 43 illustrates aggregated additional specific provisions, both in absolute terms and relative to credit RWA for retail asset classes.
Figure 43 Additional specific retail provisions by asset class

Click to enlargeWhereas the above trend is observable in most debtor geographies, there are significant geography-specific differences. For instance, whereas in Greece more than 83% of additional specific provisions stems from residential real estate debtors, in a number of geographies, such as Ireland or Malta, there are no or few additional specific provisions on this asset class. Similarly, whereas in a number of geographies no additional specific provisions were identified on other retail debtors, this asset class had a significant impact in Germany. Figure 44 illustrates aggregated additional specific provisions in absolute and relative terms for SSM debtor geographies.
Figure 44 Additional specific provisions by debtor geography
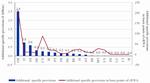
Click to enlargeDrivers
The challenger model provisions on defaulted exposures and, hence, additional specific provisions revealed by this work block are significantly impacted by a number of key drivers.
- NPE definition: As outlined in section 6.1.1, the stock of NPEs was significantly increased by the AQR, both through the consistent application of the EBA ITS simplified approach to defining NPEs, as well as through the credit file review. As a result, the basis for the calculation of specific provisions on retail debtors expanded, ultimately leading to an increase in specific challenger model provisions and, in many cases, to additional specific provisions to be recognised for the purpose of the AQR.
- Adjustment of RRE collateral values: For residential real estate portfolios, property values are an essential part of the loss given loss (LGL) calculation, as the expected loss is calculated using projected proceeds from a disclosure of the underlying property. As part of the collateral valuation work block, these properties were reappraised. On average, the work block resulted in residential real estate reappraisals that were 14% lower than the indexed bank internal valuations ('appraisal discount'). Where properties were reappraised, their updated value was taken into account in the collective provisioning LGL calculation directly. For properties that were not reappraised, the average appraisal discount of the portfolio was applied. On average the reduction of RRE property values led to an increase in LGL of approximately 12% and, hence, contributed to an increase in specific provisions.
- Cure rate parameters that are not point-in-time: In a number of cases, the banks' models use long term parameters which smooth the impact of recent events. Due to its point-in-time nature the challenger model fully reflects these events. Where banks exhibited only few cures in 2013, the year against which the challenger model parameters were calibrated, this led to lower cure rates and, ultimately, to an increase in IBNR.
- Credit file review: For sampled debtors a classification review was conducted as part of the credit file review. Where residential real estate debtors that were believed to have cured in 2013 were found to have remained non-performing, this led to a reduction of the cure rate applied in the challenger model for this portfolio and an increase in specific provisions.
All performing exposures: additional IBNR resulting from collective provisioning
This section provides more detail on the �10 billion of additional IBNR identified as a result of the AQR as well as the most significant factors driving this result.
Outcome
Across the SSM, for 327 portfolios held by 96 participating banks the challenger model revealed insufficient levels of IBNR, which led to an aggregated increase in IBNR of �10.1 billion. The majority of the additional IBNR stems from large SME (28%) and large corporate (23%). Taking into account the size of each asset class (determined by credit RWA), however, the most significant adjustment was made to retail SME (56 basis points), large SME (48 basis points) and shipping (47 basis points) portfolios. Figure 45 illustrates the aggregated additional IBNR, both in absolute terms and relative to credit RWA for AQR asset classes.
Figure 45 Additional IBNR by AQR asset class
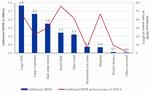
Click to enlargeAt a debtor geography level, the most significant increase in IBNR stemmed from Italian and Spanish debtors. Taking into account the relative size of the SSM debtor geographies, the most significant adjustment was made for Slovakian debtors, with an adjustment of 70 basis points of credit RWA. Figure 46 illustrates aggregated additional IBNR in absolute and relative terms for SSM debtor geographies.
Figure 46 Additional IBNR by SSM debtor geography
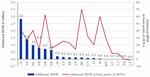
Click to enlargeDrivers
The challenger model provisions on performing exposures and, hence, additional IBNR revealed by this work block is significantly impacted by a number of key drivers.
- Credit file review: For all sampled debtors a classification review was conducted during the credit file review. In addition to the above mentioned reduction of cure rates for residential real estate debtors, this had an impact on the probability of impairment for both retail and non-retail portfolios. Where debtors that were believed to be performing at the end of 2013 were found to have defaulted in 2013, this increased the probability of impairment applied in the challenger model. In addition, for corporate debtors, the credit file review included a review of provisioning levels. Where provisioning levels for debtors that defaulted during 2013 were raised, this led to an increase in the loss given impairment (LGI), calculated as the coverage ratio of 2013 defaults, applied in the challenger model. Both of these effects led to an increase in the IBNR determined by this work block and, in many cases, to additional IBNR to be recognised for the purpose of the AQR.
- Probabilities of impairment (PI) that are not point-in-time: As for retail cure rates, in a number of cases the banks' models use long term parameters whereas the challenger model is fully point-in-time. Where banks exhibited a large number of defaults in 2013, this led to higher probabilities of impairment and, ultimately, in an increase in IBNR.
- Loss identification period (LIP): In the majority of cases the LIP employed in the challenger model exceeds the one employed by participating banks. This is partly driven by the prudential nature of the exercise and partly by the fact that in many cases an analysis of the bank's LIP revealed a high volatility of observed LIPs as well as loss events, i.e. the beginning of the LIP, not being identified correctly. As raising the LIP has a one-to-one impact on IBNR, this was an important driver of the additional IBNR resulting from this work block.
- Adjustment of RRE collateral values: The reduction in residential real estate property values raised LGL and led to an increase in IBNR.
- Exclusion of high-quality exposures: In some cases, banks had excluded certain high-quality exposures from the calculation of IBNR. As no exposure is excluded from the challenger model, this led to challenger model provisions in excess of banks' provisions and, hence, to additional IBNR.
6.2.3 FAIR VALUE EXPOSURES REVIEW
The AQR included a review of level 3 fair value |82| assets for participating banks which had material exposures within each of the three components of this section of the AQR, (namely non-derivative asset revaluation; CVA and derivative pricing models). The figure below provides an overview of the AQR impacts that resulted from each component in the fair value exposures review.
Figure 47 Impact of the AQR fair value exposures review by component
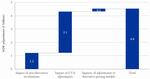
Click to enlargeConsistent with the overall risk-targeted approach of the AQR, the review of fair value assets was focused on level 3 which are of interest due to the uncertainty in their valuation. |83| The review assessed pricing methodology for both non-derivative and derivative exposures held at fair value, and included a comprehensive review of CVA, which included all derivative exposures. The overall results by component are discussed further below.
- Non-derivative positions were assessed through independent revaluations (capital depletion �1.2 billion). This review uncovered shortcomings in the pricing methodologies used by banks, as well as the absence of appropriate valuation adjustments in some cases.
- The AQR had a significant impact on CVA, resulting in a 27% increase in the reserves entities hold against counterparty defaults (�3.1 billion). The review uncovered issues relating to parameter estimation, as well as failure to calculate CVA on particular exposures.
- Complex derivative pricing models were also reviewed, and additional model reserves were required on 35 occasions, based on modelling errors or inappropriate assumptions within the pricing models (�0.2 billion).
Whilst the level of detail and effort involved in the fair value exposures review was significant, the overall impact of this part of the AQR was lower than that of other areas.
It should be noted first that the focus of this part of the review was on level 3 exposures held at fair value for participating banks - these are the most illiquid and hard-to-value positions, with valuation reliant on unobservable model inputs. The most significant holders of these Level 3 exposures were also the most sophisticated and most active institutions from a trading book / fair value perspective.
Further, in general, the review found that banks already held reserves and made conservative modelling assumptions in cases of uncertainty - this was assessed through detailed model-by-model review, third party valuations, and through benchmarking of bank valuations and modelling assumptions where possible across the set of banks within the scope of the review.
Although the review found that valuations were largely calculated in accordance with the principles of a "fair value" for those level 3 positions, based on prevailing market conditions at year-end 2013, the review did not investigate the possible impact of more severe stress scenarios beyond the requirements of a fair valuation e.g. widening / breaking of particular bases, drying up of liquidity in a particular asset class, or model assumptions no longer holding due to changes in market conditions. However, the stress test assessed the potential impact of stressing derivative holdings, including some specific elements for basis risk and non-linearity.
Furthermore, during the qualitative assessment of derivative pricing models, several related areas were assessed; these included an assessment of modelling assumptions and simplifications, the appropriateness of data sources and proxies, and the frequency and rigour of stress testing performed as part of validation and on-going monitoring.
It should also be noted that, in addition to the purely quantitative findings, a significant number of qualitative issues relating to valuation and control processes were found via the Core Processes Review, Derivative Pricing Models and PP&A components of the AQR. These will require remediation following the conclusion of the comprehensive assessment, and will be monitored by the JSTs.
Further detail is provided below on the results for each component of the review. Please also refer to Section 6.1.2 for details on the harmonisation of fair value hierarchy practices.
6.2.3.1 Level 3 non-derivative revaluation
The revaluation of securities involved over 5,000 positions worth �82.7 billion in total. The total AQR adjustment of �1.4 billion represented a total decrease in value of 1.7%. These adjustments were identified as a result of modelling errors in the pricing methodologies, as well as the absence of necessary valuation adjustments. |84| This impact was reduced to �1.2 billion due to the application of AFS prudential filters.
The table below displays the original value from the sampled positions by portfolio, and the size of the adjustments in absolute value and as a percentage of the original value.
Table 7 AQR impact of revaluations by asset class (total value examined in portfolio samples) |85| Asset class Bank's original valuation (� billion) AQR independent valuation (� billion) AQR adjustment (� billion) Adjustment (in % of original value) CET impact before tax and risk offsets (� billion) Real estate and other 18.1 17.5 -0.5 -3.0% -0.5 Bonds 13.1 12.7 -0.4 -3.1% -0.3 Private equity 14.5 14.3 -0.2 -1.4% -0.2 Securitisations 14.9 14.8 -0.1 -1.0% -0.1 Loans 22.2 22.0 -0.1 -0.6% -0.1 Total 82.7 81.3 -1.4 -1.7% -1.2 The impact was most significant for real estate and bonds. The drivers for these are discussed below.
- Revaluations of real estate held on the balance sheet had a significant downwards revaluation (3.0% on average), predominantly as a result of the use of inappropriate haircuts applied to the property market value.
- Bonds exhibited a large relative decrease (with an average of 3.1%). In particular, discounting spreads used by banks for municipal bonds were frequently regarded as inappropriate in the independent revaluations, which resulted in a 14% downwards adjustment in value on average for this type of bonds.
The figure below displays the distribution of impacts across the different entity types. The bar chart (left-hand scale) represents the size of AQR adjustments in � billion, and the line chart (right-hand scale) represents the relative adjustment with respect to the original value of the assets analysed.
Figure 48 AQR adjustment of revaluations grouped by RWA of participant bank

Click to enlargeThe figure above indicates that the largest AQR adjustments were concentrated on mid-sized entities. This is driven by smaller participating banks employing a more conservative approach to valuation of complex assets than medium sized participating banks, whereas the larger banks had a smaller adjustments as they applied more sophisticated valuation approaches.
Key drivers
The main sources of impact can broadly be divided into two cases.
1. Assets where an inappropriate pricing approach is employed
In the banks' original valuations, unadjusted indicative broker quotes or asset manager quotes were commonly used. The reliability of quotes is not straightforward to assess for level 3 exposures, especially if the quotes are out of date and are not verified appropriately. |86| On occasion, items were also held at cost on the balance sheet, which was inappropriate given their accounting classification as fair value positions.
2. Issues identified with the inputs or parameters used in the bank's pricing methodology
In cases where the approach to valuation was appropriate, |87| the main differences in value were identified as a result of an increase in spreads used for cash flow discounting, which resulted from a variety of factors:
- The independent revaluation used an alternative, more comparable, proxy for the evaluated position (based on industry, geography, rating, liquidity, etc.). |88|
- Original valuations did not always include adjustments to reflect differences between proxies used and the position in-scope. In particular, there was limited adjustment for illiquidity and other parameter uncertainty adjustments.
- Methodologies for the valuation of optionality features and embedded derivatives.
- The funding spread and cost of capital assumptions used.
- Inappropriate benchmark curves for cashflow discounting.
The table below summarises, per asset class, the main differences between bank valuations and the independent revaluations conducted during the AQR which were specific to that portfolio type. It also details the sources of AQR adjustments, whenever these were necessary.
Asset class Main source of differences / adjustments Bonds An increase in spreads used for cashflow discounting in the revaluation, resulting from alternative proxies and adjustments used in the revaluations, and differences in the funding spread. Real Estate Impairments identified in accrual accounted positions. A harmonisation in the application of haircuts. Private Equity Use of more recent documentation on the relevant investments, as well as the adjustment of "beta" assumptions. |89| Securitisations Differences in the discount spread used based on available market data, including adjustments to reflect liquidity and parameter uncertainty, as for the other securities. Cashflow estimation methodologies. |90| Loans Assumptions on timing for collection, collateral valuation and haircuts applied to collateral value. Alternative cost of capital and funding cost assumptions. 6.2.3.2 CVA Challenger model
All participating banks in the AQR were included in the CVA challenger model review (over 100 models were reviewed). The process included a template, which identified potential issues in the calculation methodology, parameters and portfolio coverage. The AQR impact from the CVA challenger model was �3.1 billion, corresponding to a 27% increase starting from a total CVA of �11.4 billion, and the majority of this adjustment related to the use of inappropriate PD and LGD parameters as seen below:
Figure 49 AQR impact of the CVA review and main drivers
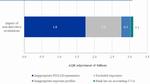
Click to enlargeThe distribution of CVA adjustments across entity groups is shown in Figure 50. The bar chart (left-hand scale) represents the size of AQR adjustments in � billion, and the line chart (right-hand scale) represents the relative adjustment with respect to the original value of the assets analysed.
Figure 50 AQR impact of the CVA review grouped by RWA of participating banks
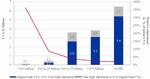
Click to enlargeThe figure reveals that smaller banks have larger relative AQR impacts, driven by less sophisticated or inadequate CVA calculations.
Key drivers
The main drivers of the impact are discussed below, ordered by materiality
Issue Additional details Inappropriate PD and LGD parameters used Use of historical calibrations to calculate PD and LGD parameters. LGD calibrations outside of the ranges used by market participants (where the LGD parameter was calibrated independently from PDs). Exposures excluded calculation Exclusion of specific counterparty / trade types from the CVA calculation without sufficient justification / calculation (e.g. trades under a CSA with non-zero threshold / non-daily margining). Inappropriate exposure profiles Exposures modelled incorrectly, for example, through non-conservative treatment of collateral agreements (exposures under CSAs). Simplifying assumptions such as use of flat exposure profiles and inappropriately short time horizons. Bank did not calculate accounting CVA Absence of accounting CVA calculation, or use of a proxy calculation suggesting that CVA was immaterial to justify exclusion (11 Banks), but where the AQR assessment resulted in some impacts. Note that an additional 30 participating banks did not calculate an accounting CVA, but did not have any impact from the AQR as their derivative exposure was deemed immaterial. 6.2.3.3 Level 3 derivative pricing model review
The level 3 derivative pricing model review assessed the robustness and accuracy of the most material pricing models used to value level 3 derivatives across the in-scope banks. Where deficiencies or limitations were identified in the valuation techniques, remedial actions were defined and additional model reserves were quantified by the NCA bank teams. The review resulted in an additional �223 million of reserves to be held for 35 models across 16 banks (from a total of 116 pricing models that were reviewed).
Overview of the results
The chart below shows, on the left hand side, a classification of models between: models for which no issues were quantified, models where issues were quantified but where no additional reserves were needed, and finally, models for which additional reserves were needed as a result of issue quantification. Note that models are also divided by the type of issue identified. On the right hand side, the additional reserve amounts are displayed, also by type of issue.
Figure 51 Models classified depending on outcome of the AQR review, and AQR impact of the derivative pricing model review, by type of issue

Click to enlargeKey drivers
The table below summarises the main issues identified which required additional model reserves:
Issue type Additional details Model assumptions Second order price variations not modeled. Simplifying assumptions in the modeling approach used, such as correlations parameters or volatility skew not modeled, with price having significant sensitivity to these parameters and extrapolation of surfaces not quality checked. Potential trade unwinds not modeled, nor reserves held against potential losses as a result of trade unwinds. Model calibration Model parameters not updated or estimated appropriately. Parameter uncertainty not captured in model reserves. For example, no sensitivities calculated to the use of proxies when the original variable is unavailable. Input data Variables used do not have sufficient granularity, frequency or data series are not long enough. Inadequate proxies used when the original variable is unavailable. There were also a number of occasions where model documentation was found to be insufficient. These issues required no additional reserves, but a remediation action was identified.
It should be noted that the total impact from the level 3 derivative pricing model review is lower than other components of the AQR. This is due to the fact that sensitivities to changes in parameters are often small (despite large gross notional positions, net exposures are small) and given the point in time valuation of assets in the AQR methodology. Also, level 3 exposures represent 6% of the total gross notional of all trades priced by the models in-scope as of 31 December 2013.
6.3 REMEDIAL ACTIONS TO BE IMPLEMENTED BY BANKS FOLLOWING THE COMPREHENSIVE ASSESSMENT
Following each work block, a template summarising the findings of the work block was completed by each NCA bank team. These templates included remedial actions to be completed by the banks following the comprehensive assessment (note that in some critical cases the harmonisation issues identified were addressed during the AQR). All issues identified will be followed up by the joint supervisory teams (JSTs) and will be used in supervision going forward. Some examples of issues identified are given below.
- Application of fair value hierarchy - participating banks found during the PP&A to fall outside of IFRS guidelines are required to document and implement a suitable policy.
- Treatment and identification of forborne exposures - JSTs will monitor where bank capabilities and treatment were found to be inadequate or inappropriate.
- Provisioning approach - poor coverage across ECB threshold impairment triggers resulted in remediation in the form of recommendations that the bank enhance its impairment process with respect to the impairment triggers not covered or only partially covered.
- Collective provisioning - qualitative review by bank teams of the banks' collective provisioning models' adherence to accounting standards revealed that some models were not in line with accounting standards and, as a result, remedial actions were defined which banks will be required to implement. More specifically, banks were asked to e.g.:
- Apply a clear distinction between individually and collectively provisioned exposures as well as between IBNR and specific provisions.
- Replace expert judgement currently applied with historically evidenced parameters (e.g. foreclosure period, appraisal haircuts).
- Provide justification and quantification of emergence periods applied for each segment IBNR provisioning.
- Use a loan's original effective interest rate for impairment calculation as opposed to the nominal or market rate.
- Determine a loan's fair value in line with IAS 39 when calculating loss rates based on cash recoveries.
- Data systems - a further outcome of the AQR was the discovery by a number of banks of the urgent need to improve data systems, particularly for those banks that had recently merged with or acquired other banks. EBITDA and cashflow data for going concern debtors was of conspicuously low quality, for example, and obtaining collateral information proved difficult for a number of banks. Note that within the AQR, conservative fall-back assumptions were used where data was unavailable or erroneous.
The trading book core processes review provided a qualitative assessment of the efficacy and appropriateness of processes used to estimate fair value and determined remedial actions for banks with material trading books. |91| Of the 26 participating banks, 19 were assessed as having poor or substandard practices in one or more sections of the review; below are some examples of remedial actions required as a result of the exercise.
- Upgrades in model validation - 35% of participating banks were required to upgrade their model validation documentation or procedures.
- Improvements in the CVA calculation - 50% of participating banks were scored overall as having poor or substandard practices in their CVA calculation, and methodological upgrades were required.
- Inclusion of fair value adjustments - 27% of participating banks were identified as having poor or substandard practices. This assessment related mainly to the absence of certain types of fair value adjustments, without documentation substantiating the decision and issues in the reporting and audit of other fair value adjustments.
- Independent Price Verification processes - 23% of participating banks were identified as having poor or substandard practice in some areas of their IPV process. Remedial actions were defined to address absence of thresholds, unclear perimeter of analysis, inappropriate procedures and poor documentation and timeliness for reassessments.
- Improvements in P&L attribution accuracy - 23% of participating banks were identified as having poor or substandard practice in some areas. The main issues identified were: absence of a formal policy and escalation process, shortcomings in the record keeping of the process, scope of the P&L analysis, escalation process, lacking IT capabilities and methodological weaknesses (e.g. absence of modelling of second order sensitivities).
7 STRESS TEST AND JOIN-UP WITH AQR OUTCOMES
This chapter discusses the outcomes of the stress test. The stress test results are analysed in detail, structured around the key drivers that impacted the outcome, including the join-up of the AQR findings.
7.1 OUTCOMES OF THE STRESS TEST
The stress test is the second component of the comprehensive assessment. This chapter describes the key findings that emerge from it, focusing on aggregate results for the participating banks with breakdowns across countries and key risk drivers.
In the comprehensive assessment, the stress test results have been adjusted to take into account the AQR findings (in a process known as the "join-up" |92|) for the baseline and adverse scenarios. The impact of the join-up is shown in detail in Section 7.2.4.
Please also note that in this section a reduction in CET1 ratio and CET1 capital over the stress scenarios is represented by a negative number.
7.2 QUANTITATIVE FINDINGS OF THE STRESS TEST BY KEY DRIVERS
This section contains three subsections. The first displays the aggregate findings by key risk drivers under both scenarios; the second provides a more detailed breakdown across a number of important dimensions; and the final subsection details the results of the join-up of AQR and stress test.
Note that this section only discusses the outcomes of the stress test. The change on the capital position of participating banks as at 31 December 2013 due to the AQR is not included in the analysis.
7.2.1 AGGREGATE IMPACT BY RISK DRIVERS UNDER THE BASELINE AND ADVERSE SCENARIOS
The aggregate impact of the stress test (including join-up) in terms of percentage point changes between year-end 2013 and year-end 2016 in the average CET1 ratio of participating banks is an increase of 0.2 percentage points under the baseline and a decrease of 3.0 percentage points under the adverse scenario (see Table 8).
Overall, the impact on CET1 capital over the three-year stress test horizon amounts to an increase of �43 billion under the baseline and to reduction of �181 billion under the adverse scenario. These net effects combine various offsetting effects between the impact on banks' loss absorption capacity and the impairments arising under the stress test scenarios.
Table 8 Total impact by stress test component Stress test component Stress test effect on CET1 (� billion) Section Baseline Adverse Net interest income (NII) �760 billion �686 billion 7.2 Net fee and commission income �377 billion �362 billion 7.2 Net trading income �25 billion �6 billion 7.2 Sovereign FVO/AFS �-1 billion �-28 billion 7.2 Admin. and other expenses �-865 billion �-865 billion 7.2 Loan losses �-209 billion �-378 billion 7.2 Taxes, dividends and other �-45 billion �38 billion 7.2 Total CET1 impact (� billion) �43 billion �-181 billion 7.2 Total CET1 ratio change (percentage points) 0.2% -3.0% 7.2 of which: Join-up CET1 impact (� billion) �-6 billion �-12 billion 7.3 Figure 52 presents the aggregate impact of the stress test on CET1 capital, broken down by countries under the adverse scenario. In terms of � billion amounts, the impact ranges from close to zero in a few smaller countries, to a reduction of approximately �30-35 billion in France and Italy. In relation to risk weighted assets, the CET1 capital impact under the adverse ranges from between 0% in Slovakia and the Baltic states, to approximately a 10% reduction in Slovenia.
Figure 52 Impact of the stress test on the aggregate CET1 capital by country under the adverse scenario in � billion and in percentage of RWA
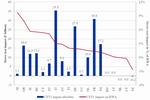
Click to enlargeThe aggregate impact of the stress test by risk driver under the baseline scenario is shown in Figure 53. In the baseline, SSM banks' average CET1 ratio is projected to increase from 11.4% in the fourth quarter of 2013, to 11.6% by the end of 2016. The overall improvement in the solvency position under the baseline mainly reflects the projected accumulation of pre-provision profits (3.2 percentage point contribution to the change in the CET1 ratio) which more than offsets the projected loan losses (-2.5 percentage point contribution). The average development of participating banks' solvency positions, however, masks variations across individual institutions and countries.
Figure 53 Aggregate stress test impact by risk driver under the baseline scenario

Click to enlargeUnder the adverse scenario, participating banks' average CET1 ratio is projected to decrease from 11.4% in the fourth quarter of 2013, to 8.4% by the end of 2016. This corresponds to a decline of the average CET1 ratio between year-end 2013 and year-end 2016 of 3.0 percentage points (see Figure 54).
The key drivers of the CET1 ratio impact are an increase in loan losses (-4.5 percentage point contribution to the change in the CET1 ratio) and lower pre-provision profits compared to the baseline, primarily driven by lower NII under stress (corresponding to a reduced positive contribution to the CET1 ratio of 1.0 percentage point). The 'Administrative and other expenses' risk driver also impacts the overall results; however, they remain largely unchanged between the baseline and adverse scenario, mainly reflecting staff and other administrative costs, that, regardless of the scenario, have a negative impact on banks' loss absorption capacity. Sovereign exposures in the available-for-sale (AFS) and fair value option (FVO) portfolios contribute a small negative amount to the outcome.
Figure 54 Aggregate stress test impact by risk drivers under the adverse scenario

Click to enlarge7.2.2 STRESS TEST IMPACT BY RISK TYPE ACROSS THE PARTICIPATING BANKS
The following figures present the evolution of the key risk type drivers of the stress test impact in more detail and show how these are distributed across banks.
Figure 55 shows that loan losses across banks are driven by both the corporate and retail portfolios, under the baseline and adverse scenarios. Under the baseline scenario, the median CET1 percentage point reduction due to losses in the corporate sector is 0.9%, and in the retail segments is 0.2% to 0.3%. The results under the adverse scenario are, however, more severe, with a median CET1 percentage point reduction of 1.6% in corporate and 0.5% to 0.6% in the retail segments.
Figure 55 Decomposition of loan losses across portfolios and banks under the baseline and adverse scenario
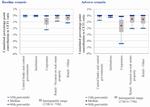
Click to enlargeThe net interest income development across banks over the scenario horizon is shown in Figure 56. In line with the adverse scenario, the impact of the market interest rate shocks is frontloaded. While the picture is heterogeneous across banks, the median decline in net interest income is larger under the adverse than the baseline scenario. Moreover, the distribution of changes in net interest income across banks is generally wider under the adverse scenario.
Figure 56 Net interest income development across banks under the baseline and adverse scenario
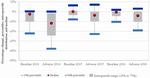
Click to enlargeNet fee and commission income developments over the scenario horizon show a wide distribution across banks for the first year (2014) for both baseline and adverse scenarios, tightening considerably for the second and third years of the stress test horizon (see Figure 57). The median drop under the adverse scenario is 2.7% for the first year, and close to zero for all other years.
Figure 57 Net fee and commission income development across banks under the baseline and adverse scenario
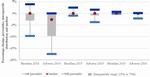
Click to enlargeSovereign losses on AFS and FVO portfolios under the adverse scenario vary widely across banks in 2014 with very large impacts, positive and negative, for some banks (see Figure 58). In comparison, changes in sovereign losses are more subdued under the baseline scenario and the remainder of the adverse scenario horizon.
Figure 58 Sovereign losses on AFS and FVO portfolios across banks under the baseline and adverse scenario
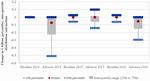
Click to enlargeRisk-weighted assets experience net growth across the horizon, albeit at a declining rate over the course of the projection horizon (as shown in Figure 59). Note that for banks under the static balance sheet assumption, the nominal balance sheet size remains the same by design. Under the baseline, risk-weighted assets for the median bank grow 1.0% in 2014 and somewhat slower in 2015-16. Under the adverse scenario RWA growth is 3.2% in 2014 and again less pronounced in subsequent years amounting to 0.9% in 2016.
Figure 59 RWA development across banks under the baseline and adverse scenario
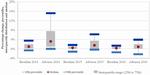
Click to enlargeAdministrative and other operating expenses in general did not change over the scenario horizon, regardless of the scenario (see Figure 60). The stress test methodology prescribes that non-interest expenses, including administrative and other operating expenses, were floored at their 2013 level. |93|
Figure 60 Development of administrative and other operating expenses as an aggregate across banks under the baseline scenario

Click to enlargeWhen comparing banks that used a static balance sheet and those that used a dynamic balance sheet assumption, it is noticeable that dynamic balance sheet banks are less heavily affected under the baseline scenario. |94| By contrast, under the adverse scenario larger CET1 ratio declines are observed for banks under a dynamic balance sheet assumption. This could reflect that restructuring banks for which the dynamic balance sheet assumption applies are generally weaker and more vulnerable to stress.
For banks under a static balance sheet assumption, the stress test results in a 0.05 percentage point increase in the CET1 ratio under the baseline and a 3.2 percentage point decline under the adverse scenario compared to the end-2013 CET1 ratio (see Figure 61). In comparison, for banks under a dynamic balance sheet assumption, the baseline scenario results in a 0.9 percentage point increase in the median CET1 ratio, and a 4.3 percentage point decline in the median CET1 ratio under the adverse scenario compared to the end-2013 CET1 ratio.
Figure 61 Distribution of changes to CET1 ratios across banks following a static vs. dynamic balance sheet assumption under the baseline and adverse scenarios

Click to enlarge7.2.3 JOIN-UP RESULTS
Following the completion of quality assurance for the AQR and stress test, the stress test was adjusted in the join-up to take into account the A QR findings. As described in Section 3.2.2 and in Section 4.2, the join-up is calculated in a largely automatic manner, while taking into account AQR findings |95| and bank-specific circumstances.
The main element of the join-up relates to credit risk for which AQR adjustments to probability of impairment (PI) and loss given impairment (LGI) parameters are used to adjust stress test starting point credit risk parameters (i.e. point-in-time probability of default, PD PIT, and point-in-time loss given default, LGD PIT). In addition to the starting point adjustments given by the AQR, the forward-looking projections provided by banks in the stress test are also adjusted via an upward or downward shift in the projected PD and LGD paths. |96|
The aggregate impact of the join-up on the year-end 2013 CET1 capital for the baseline and adverse scenarios amounts to -�6 and -�12 billion, respectively (see Table 8).
As expected, the join-up impact is highly correlated with the magnitude of AQR findings (see Figure 62). The strongest join-up impact in terms of RWA (c. 0.5% of RWA) is thus observed for banks for which the AQR had a major impact (e.g. more than 2% of RWA). For banks with small or negligible AQR findings, the join-up effects were on average similarly small (below 0.2% of RWA).
Figure 62 Join-up impact by bank in relation to AQR adjustments
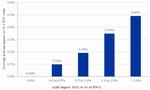
Click to enlargeFigure 63 shows the join-up impact under the adverse scenario by country in � billions and in percentages of RWA, respectively. In absolute terms, join-up effects range between close to zero and �3.3 billion under the adverse scenario. The effects are largest in the biggest SSM countries (e.g. Germany, France and Italy). Relative to RWA, join-up effects are sizeable for those countries that have a significant AQR adjustment, such as Slovenia and Cyprus. The relative impact ranges from -0.1% of RWA to 1.5% of RWA.
Figure 63 Total absolute and relative impact of join-up by country of participating bank under the adverse scenario

Click to enlargeThe main driver of this reduction is credit risk-related adjustments due to AQR changes to Pis and LGIs (see Figure 64 and Figure 65). The CET1 capital impact given by these adjustments to credit risk parameters amounts to �8.5 billion under the baseline and to �11.2 billion under the adverse scenario. The additional impairment flow from financial assets also gives rise to an offsetting tax benefit of approximately 30% of losses. There are also additional tax effects that have an impact during the join-up - the largest of the additional effects is the adjustment to ensure that DTA formation aligns to the maximum allowable amount of DTAs, set by the NCA bank teams during the AQR. Finally, there are a number of other effects, including the application of a floor on incurred but not reported (IBNR) coverage (following the ECB stress test methodology |97|), and dividend adjustments in-line with adjusted net income.
Figure 64 CET1 impact of join-up by type (credit vs. other effects) under the baseline scenario

Click to enlargeFigure 65 CET1 impact of join-up by type (credit vs. other effects) under the adverse scenario

Click to enlargeThis chapter covers the capital actions taken by the participating banks prior to and over the course of 2014 and discusses the composition of banks' capital by detailing the deductions to CET1 capital that will be phased-in over the coming years and discussing the treatment of deferred tax assets across the SSM.
There are a number of measures participating banks have taken in the past in order to strengthen their balance sheets and increase their solvency. Among others, these include the issuance of new capital such as Common Equity, Additional Tier 1 capital including contingent convertibles (CoCos), retained earnings and a reduction of risk-weighted assets (RWA) through asset sales or portfolio clean ups. As explained in more detail below, the ECB has been restrictive in disclosing only those measures taken during 2014 (1 January to 30 September) in the bank-level disclosure templates that constitute actual new issuances of common equity or contingent convertible instruments that comply with the published conditions that must be fulfilled in order for these instruments to count towards the coverage of capital shortfalls.
Nevertheless, it should be noted that other forms of balance sheet strengthening undertaken by banks since last year are also relevant as they correspond to frontloaded actions taken to face the comprehensive assessment and constitute an indicator of the credibility and success of the exercise.
This section will provide more detail on the actions undertaken by significant banks with regard to the issuance of new capital. To that end, the following sections will first discuss the capital actions undertaken prior to 2014 that impact the CET1 starting point and, second, the recent issuances conducted in 2014, which are not taken into account when determining the shortfall identified in the comprehensive assessment as stated in Chapter 5, but will be available to reduce or fully cover it, subject to JST review. Finally, the standards by which bank capital plans will be judged following the comprehensive assessment will be elaborated on.
8.1.1.1 Overview of historical capital actions prior to 2014 which impact the CET1 starting point
Since the onset of the financial crisis, banks have undertaken a number of actions which contribute to the solvency of the banking system. In the period from 2008 to 2013, the largest 30 participating banks alone raised a total of �198 billion in equity |98|. The figure below shows the cumulative aggregated equity increase over this period.
Figure 66 Cumulative aggregated equity increase 2008-2013
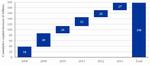
Click to enlargeSources: SNL, banks' financial reports, press releases and ECB calculations and analysis
As the comprehensive assessment was conducted based on a balance sheet date of 31 December 2013, all of the above capital increases are fully reflected in its outcome.
8.1.2 OVERVIEW OF EVENTS IN 2014 WHICH IMPACT THE CAPITAL SHORTFALL
In the period between January 2014 and the finalisation of the comprehensive assessment, banks undertook a number of capital actions which are not included in the comprehensive assessment results but will be included in their capital plans and can potentially be used to offset any shortfalls identified. These capital actions will be judged against the ECB's guidelines regarding the eligibility of capital instruments to be used in the exercise as outlined at the end of this section.
Aggregated overview of capital actions undertaken by banks in 2014
Across the SSM, banks have undertaken a number of actions prior to the announcement of the comprehensive assessment results. Mostly, banks have improved their capital base by issuing Common Equity Tier 1 (CET1). In addition, a smaller number of banks have raised Additional Tier 1 (AT1), which can be eligible to cover shortfalls arising from the stress test adverse scenario in certain circumstances discussed below.
In total, 54 banks have undertaken capital actions (both increasing and reducing capital) in the period from January to September 2014, raising a total of �57.1 billion in capital. This increase almost exclusively stems from the issuance of CET1 eligible capital instruments. In comparison, the conversion of hybrid instruments and raising of AT1 only occurred to a limited extent. Moreover, there was an offsetting impact of �16.6 billion due to the repayment or buy-back of capital instruments. Together these actions led to a net capital increase of �40.5 billion which equates to a median increase in banks' pre-comprehensive assessment CET1 ratios of 1.0 percentage points. |99|
Figure 67 Breakdown of capital actions undertaken by significant banks in 2014
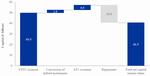
Click to enlargeAs can be seen, the majority of the capital actions relate to CET1 issuance. Across the SSM, 44 banks raised �49.9 billion CET1 over the course of 2014, as shown below on a country level. In comparison, only 5 banks raised AT1 instruments totalling �4.6 billion.
Figure 68 CET1 issuance by country of participating bank, including issuances between 1 January and 30 September 2014

Click to enlargeThese capital actions do not translate one-for-one into a reduction of the capital shortfall under the comprehensive assessment. This is because not all of the banks that have raised additional capital have a capital shortfall identified in the comprehensive assessment, and some cannot use the full amount of AT1 because of the constraints outlined below; the total shortfall discussed in Chapter 5 is thus offset by �15.2 billion, as illustrated in the figure below.
Figure 69 Aggregated capital actions undertaken by participating banks in 2014
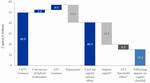
Click to enlarge1 Surplus capital: amount of capital that is not being used due to the absence of a capital shortfall
2 AT1 threshold effect: AT1 that is not eligible for use in the comprehensive assessment due to the constraints described in Section 8.1.
"Surplus capital" represents the amount of capital that is not being used to offset a capital shortfall, either because it was raised by a bank with no capital shortfall or because it was raised in excess of the capital shortfall. The ATI issuance largely did not meet the criteria outlined below and therefore did not offset the comprehensive assessment shortfall.
The figure below shows the net capital raised as well as the above two effects on a country level for all participating banks that undertook capital actions in 2014.
Figure 70 Capital actions by participating bank, 1 January to 30 September 2014
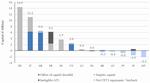
Click to enlargeThe capital actions undertaken thus reduce the shortfall identified by the comprehensive assessment to �9.5 billion, see figure below.
Figure 71 Impact of capital actions on the aggregated capital shortfall

Click to enlargeIt should be noted that the capital actions referred to in this section are limited to instrument issuance and conversion. As such, they do not represent the full range of factors with a potential impact on the regulatory capital ratios, which will be addressed in the capital plans to be drawn up by banks with a capital shortfall and judged by the JSTs following the principles outlined below.
Summary of principles concerning eligible instruments to cover capital shortfalls There are a number of specific constraints on eligibility of capital instruments that can be used to address shortfalls arising from the comprehensive assessment which apply to any capital raised during 2014 or after.
Shortfalls revealed by the AQR and the baseline stress test scenario may only be covered by CET1 capital instruments. Shortfalls arising from the adverse stress test scenario may be covered using Additional Tier 1 (AT1) capital instruments, subject to constraints given the trigger point of the instrument's conversion or write-down.
The use of AT1 instruments is limited to a maximum of 1% overall RWA as of 31 December 2013, subject to the following restrictions that mean shortfall is mainly covered by higher quality instruments:
Instruments with a trigger below 5.5% CET1: 0% of overall RWA. Instruments with a trigger at or above 5.5% and below 6% CET1: up to 0.25% overall RWA. Instruments with a trigger at or above 6% and below 7% CET1: up to 0.5% overall RWA. Instruments with a trigger at or above 7% CET1: up to 1% overall RWA. Existing convertible instruments that are subject to unconditional pre-defined conversion into CET1 within the stress test horizon are recognised without limitation for the coverage of shortfalls, as long as (i) a certain and mandatory conversion will take place at a fixed date, (ii) these instruments cannot be redeemed before the conversion date and (iii) there is no uncertainty regarding the conversion into CET1.
Actions other than issuance of capital instruments are to be judged by JSTs based on their impact on loss absorbency. For example, asset sales and their impact on the profit and loss, RWA and deductions from CET1 are eligible as exceptional measures only where they can be clearly identified as being distinct from normal business operations. Typically, large asset sale programmes for clearly separated portfolios (e.g. disposal of securitisation portfolios) and sales of subsidiaries will fall into this category. The impact of deleveraging or restructuring plans (previously agreed with the European Commission) will be taken into account. Reductions of risk-weighted assets due to Pillar 1 risk model changes and switches in Pillar 1 approaches will not be deemed eligible for addressing a capital shortfall, unless these changes were already planned and approved by the competent authority before the disclosure of the comprehensive assessment results.
8.1.3 SUBMISSION AND IMPLEMENTATION OF CAPITAL PLANS
In cases where a bank's capital ratio, as determined following the comprehensive assessment, falls short of the relevant thresholds, banks will be requested to take remedial actions and to submit capital plans within two weeks of the public disclosure of the results detailing how the shortfalls will be filled. Capital shortfalls will be expected to be covered within six months for those identified in the AQR or the baseline stress test scenario, and within nine months for those identified in the adverse stress test scenario. The periods of six or nine months will start from the release of the comprehensive assessment results in October 2014. Where a bank has a capital shortfall in more than one part of the exercise, the maximum capital shortfall will determine the final CA capital shortfall that needs to be covered. The source of this maximum (AQR, baseline or adverse) determines also the timeframe allowed to address the gap.
JSTs will assess all capital plans in terms of their adequacy and credibility. If a capital plan is found not to be adequate or credible, the ECB will decide on possible supervisory measures according to Article 16 of the SSM Regulation.
Measures included in capital plans are subject to the constraints described in the previous section (e.g. eligible capital). In line with the November 2013 ECOFIN statement, capital shortfalls should in a first instance be covered by private sources. If this is revealed not to be sufficient or in the absence of access to sources of market financing, appropriate arrangements for recapitalising banks will be mobilised, including where appropriate resolution mechanisms and, if needed, through the provision of public funds (backstops). Any public support provided will be subject to the EU state aid rules. These rules ensure that the recourse to public backstops is significantly reduced through appropriate burden sharing arrangements.
Note that restructuring plans will be taken into account by the JSTs when assessing the capital requirements. For banks with a restructuring plan that was agreed before 31 December 2013, the impact of mandatory restructuring is directly reflected in capital shortfalls in most cases. However, for those banks with a restructuring plan agreed in 2014, both static and dynamic balance sheets were submitted. In these cases, the capital shortfall is based on the static balance sheet, but the impact of the dynamic balance sheet will be taken into account in the assessment of capital plans by the JSTs as a mitigating element. |100|
The supervisory measures required as an outcome of the comprehensive assessment will be implemented as one of the decisions taken under the annual Supervisory Review and Evaluation Process (SREP) for 2014. After the submission of the SREP decision to the banks, the JSTs will start to monitor the implementation of the capital plans by way of a continuous dialogue with the banks, involving existing colleges of supervisors wherever appropriate.
As part of this monitoring process, the JSTs will closely track the incorporation, in line with the applicable accounting frameworks, of the AQR findings that need to be reflected in banks' forthcoming accounts. As previously discussed, not all adjustments will be reflected in accounts. However, those that are prudential in nature (as well as non-quantitative remedial actions) will also be monitored by JSTs in ongoing supervision.
Whether a capital plan is required or not, the JSTs will review the conclusions of the comprehensive assessment for all banks and their statutory auditors in order to assess whether they are comfortable with the way the AQR results have been incorporated into the accounts or deducted from the risk absorbing capital of the banks. If necessary, it is also possible to consider the use of available prudential measures to complement the accounting treatment.
Additional information on the leverage ratio |101| Whilst this section focuses on the capital quantity of participating banks, this box provides information on an alternative metric to measure solvency, the leverage ratio as incorporated by the CRR.
The years preceding the financial crisis were characterised by an excessive build-up of institutions' exposures in relation to their own funds. Risk-based own fund requirements are essential to ensure sufficient own funds to cover unexpected losses. However, the crisis has shown that those requirements alone are not sufficient to prevent institutions from taking on excessive and unsustainable leverage risk.
The leverage ratio is a new monitoring tool which will allow competent authorities to assess the risk of excessive leverage in their respective institutions. Implementation of the leverage ratio requirements has begun with bank-level reporting to national supervisors of the leverage ratio and its components from 1 January 2013, and will proceed with public disclosure starting 1 January 2015.
See below the leverage ratios for the participating banks, prior to the impact of the AQR. |102|
Figure 72 Bank-level leverage ratios by country of participating banks
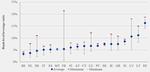
Click to enlargeThe Basel Committee on Banking Supervision will continue to test a minimum requirement of 3% for the leverage ratio during the parallel run period (i.e. from 1 January 2013 to 1 January 2017). The final calibration, and any further adjustments to the definition, will be completed by 2017, with a view to migrating to a Pillar 1 (minimum capital requirement) treatment on 1 January 2018. As the figure below shows, 14 institutions fall below this established threshold before the AQR impact.
Figure 73 Leverage ratio bank distribution

Click to enlargeNote that the AQR reduces leverage ratios by 0.33% on average, |103| and moves 3 banks below the threshold that were above prior to the exercise.
The capital shortfall identified in the comprehensive assessment is based on the Common Equity Tier 1 (CET1) capital ratio. The concept of CET1 capital was introduced by the Basel III framework and implemented in the EU in CRR/CRD IV.
The CET1 definition aims to increase the quality, consistency and transparency of the capital base by requiring it to be made up largely of common equity and by including a number of regulatory deductions for specific items. Those deductions are generally subject to phase-in rules, i.e. they become effective in a gradual fashion over a defined time frame, at the end of which they apply fully. These phase-in transitional arrangements are generally subject to competent authority discretions, leaving significant room for divergence across Member States during the transitional period.
The comprehensive assessment has been performed taking the transitional arrangements as decided by Member State competent authorities as a given. This is however subject to the notable exception of the prudential filter on unrealised gains and losses on sovereign exposures in available-for-sale (AFS) portfolios, which has been applied on an EBA-defined harmonised basis. |104|
Notwithstanding this element, there is a need to improve the consistency of the definition of capital and in particular the treatment of the deductions and the related quality of CET1 capital. This will be an issue for the SSM to address as a matter of priority. This section aims to enhance transparency on capital composition by first discussing the magnitude, distribution and drivers of transitional adjustments, and second by detailing the treatment of deferred tax assets across countries and participating banks.
The disclosure of the impact of the transitional provisions on CET1 allows for an objective comparison, where the impact of the national options is neutralised.
8.2.1 TRANSITIONAL ADJUSTMENTS TO CET1 CAPITAL
The impact of the transitional adjustments on available CET1 capital can be calculated by comparing banks' CET1 capital as per the transitional arrangements at a given reference date with the amount of CET1 they would hold if a fully-loaded CET1 definition were applied.
As at 1 January 2014, the CET1 impact of total transitional adjustments across all participating banks amounts to �126.2 billion. The figure below shows this on a country level, both in absolute terms and relative to aggregate RWA. Variations are significant and the relative numbers demonstrate that, in some jurisdictions, transitional adjustments account for significant amounts of CET1 capital, exceeding 2% of RWA at the country level in 6 cases.
Figure 74 Total transitional adjustments by country of participating banks as of 1 January 2014 |105|
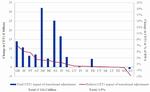
Click to enlargeNote: Based on transitional arrangements projected by the banks included in the EBA disclosure template; Calculated based on a fully implemented CRR/CRD IV definition of Common Equity Tier 1 capital including 60% of unrealised gains/losses from Sovereign Exposure in AFS portfolio.
When moving from the transitional arrangements to a fully-loaded CET1 definition, the median CET1 ratio across participating banks decreases from 12.4% to 11.1% at1 January 2014 (pre-AQR) and from 8.3% to 7.7% for 2016 under the adverse scenario. Note that the gap between the ratio under transitional arrangements and the ratio under the fully loaded CET1 definition narrows significantly from 2014 to 2016, as the progressive phase-in reduces the size of the transitional adjustments.
The main drivers of these adjustments relate to different deductions from CET1 and the phase-in rules applied to those. Two general observations can be made before entering into more detailed analyses:
- Competent authority discretions with respect to phase-in rules applied at the national level currently constitute a country-specific driver of the magnitude of the transitional adjustments. At the bank level, the impact of transitional adjustments strongly depends on balance sheet composition.
The figure below provides an overview of the CET1 impact of transitional adjustments across SSM Member States relative to RWA. It can be observed that within countries banks are affected differently by the transitional adjustments. This is driven by significant differences in the amounts of deductible items that individual banks hold on their balance sheets. In 6 countries, the impact on CET1 for banks experiencing the largest adjustment exceeds 5% of RWA.
As the figure also shows, there are individual banks which currently experience a negative capital effect from transitional adjustments. This is driven by substantial amounts of unrealised gains in AFS portfolios, which are subject to a phased-out prudential filter, meaning that the amount of those gains that is recognised in CET1 increases over time, with the 2014 definition of CET1 being more restrictive in this regard than the definitions applicable in the following years. |106|
Figure 75 Bank-level impact of transitional adjustments to CET1 |107|
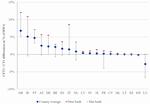
Click to enlargeNote: Based on transitional arrangements projected by the banks included in the EBA disclosure template; Calculated based on a fully implemented CRR/CRD IV definition of Common Equity Tier 1 capital including 60% of unrealised gains/losses from Sovereign Exposure in AFS portfolio.
As mentioned above, transitional adjustments are largely driven by the phase-in rules applicable to different CET1 deductions required by CRD IV. In general, the most important deductions in this context are those related to goodwill and other intangible assets, holdings of participations in other financial sector entities, the Internal Ratings-Based (IRB) shortfall and deferred tax assets.
Under fully-loaded CRR rules, banks are required to deduct 100% of goodwill and other intangible assets from CET1 capital. The same applies to the IRB shortfall (negative amounts resulting from the calculation of expected loss amounts laid down in Articles 158 and 159 of the CRR, for institutions calculating RWA using the IRB approach).
Holdings of the CET1 instruments of financial sector entities where those entities have a reciprocal cross holding with the institution that the competent authority considers to have been designed to inflate artificially the own funds of the institution are also to be deducted in full. For holdings of such instruments where the institution does, or does not, have a significant investment in those entities, the applicable amounts to be deducted are to be calculated according to further specifications and thresholds outlined in the CRR.
Competent authorities may permit financial conglomerates not to deduct the holdings of own funds instruments of a financial sector entity in which the parent or institution has a significant investment for the purposes of calculating own funds. The permission is only admissible if certain conditions as defined in Article 49(1) of the CRR, such as the requirement that the entity is supervised as a conglomerate, are fulfilled. |108| The holdings in respect of which deduction is not made shall qualify as exposures and shall be risk-weighted in accordance with CRR. In addition, the transitional provisions in CRR allow competent authorities under certain conditions to permit institutions not to deduct equity holdings in insurance entities that do not exceed 15% of the CET1 instruments issued by that insurance entity as of 31 December 2012 until 31 December 2022. The equity holdings which are not deducted shall qualify as exposure and be risk-weighted at 370%.
For all of the deductions described above, Article 478 of the CRR specifies that "competent authorities shall determine and publish an applicable percentage" of the deduction that is to be applied, within the ranges below:
Table 9 Phase-in percentages applicable to the majority of CET1 deductions Year 2014 2015 2016 2017 Phase-in range 20-100% 40-100% 60-100% 80-100% As the table shows, it is possible that only 20% of a deduction from CET1 applies at the starting point of the comprehensive assessment, depending on the percentage set by the respective competent authority. The minimum phase-in has actually been chosen in the majority of Member States. On the other hand, a significant number also already apply the deductions in full (i.e. 100%) as of 2014. The capital benefit from transitional adjustments arising from low phase-in amounts will gradually decrease over the coming years until the deductions must be applied in full.
As regards deferred tax assets (DTAs), CRR draws a distinction between three different types of DTAs, which will be discussed in detail in the following section.
According to Article 36(l(c) CRR DTAs that rely on future profitability shall be deducted from CET1. The amount of DTAs may be reduced by the amount of the associated deferred tax liabilities (DTLs) if certain conditions as defined in Article 38(3) CRR are met. DTAs that rely on future profitability and arise from temporary differences need to be deducted from regulatory capital if they exceed certain thresholds. DTAs that meet certain conditions related to their convertibility into a tax credit and their offsetting against tax liabilities are considered not to rely on future profitability and thus are not required to be deducted from CETl. These deferred tax assets are then assigned a risk weight of 100%.
The ranges of phase-in percentages for the deduction of DTAs that rely on future profitability and were created after 1 January 2014 are identical to those shown for the other deductions above (minimum of 20% in 2014, 40% in 2015, 60% in 2016 and 80% in 2017). For DTAs that rely on future profitability and existed before 1 January 2014 (i.e. all those on banks' balance sheets at the starting point of the comprehensive assessment), Article 478 of the CRR allows for a more lenient phase-in, according to the percentages shown in the table below. This implies that, in some jurisdictions, DTAs relying on future profitability that existed at the starting point of the comprehensive assessment are not deducted at all from CET1 in 2014 based on the phase-in percentage set by the competent authority. This is in fact the case for the majority of Member States which apply the minimum percentages shown in the table below. Cross-country heterogeneity arises again from the fact that a substantial number of other Member States, however, apply the full deduction (100%) already starting in 2014.
Table 10 Phase-in percentages applicable to the deduction of DTAs that rely on future profitability and existed prior to 1 January 2014 Year 2014 2015 2016 2017 2018 2019 2020 2021 2022 2023 Phase-in range 0-100% 10-100% 20-100% 30-100% 40-100% 50-100% 60-100% 70-100% 80-100% 90-100% 8.2.2 TREATMENT OF NATIONAL DISCRETIONS IN THE COMPREHENSIVE ASSESSMENT
In using CET1 as defined in CRR/CRD IV as the relevant capital definition, the comprehensive assessment takes the competent authorities choices previously made at the national level with regard to discretions granted in the CRR as given, in particular with respect to the phase-in rules. However, their implications for the stringency of capital requirements in the transition period to the full application of the deductions (and, hence, the horizon of the comprehensive assessment) cannot be ignored.
Within the limits of the framework in place, the comprehensive assessment thus relied on the most stringent interpretation of CRR rules possible given the constraints of national rules. The most significant choice in this regard was the treatment of modifications of transitional arrangements undertaken after their initial adoption. Such modifications in individual jurisdiction - complementing or changing the content of the initial transitional arrangements -were not taken into account for the calculation of the comprehensive assessment results. This applied, for instance, to national decisions not to fully deduct goodwill or holdings of own funds instruments of a financial sector entity according to Article 49(1) of the CRR or Article 471(1) of the CRR that were taken after the initial CRR implementation in a given Member State. In some jurisdictions, the CRR rules were put in place after 1 January 2014, but with an effect as of 1 January 2014. In those cases their effect was accepted as they represent the initial implementation of CRR/CRD IV.
If the bank concerned was already permitted under CRDII/III not to deduct the holdings of own funds of a financial sector entity and the new decision according to Article 49(1) or Article 471(1) of the CRR was only taken to confirm this treatment under the new CRR/CRD IV a deduction was not required. The same applied if a permission not to deduct was granted in 2013 with a view to the CRR implementation.
In case where a bank faces a shortfall in the Comprehensive Assessment, any positive capital effects of the non-deduction of significant holdings of own funds of a financial sector entity that arise due to the application of Articles 49 (1) CRR or 471 (1) CRR after the initial implementation may only be considered in the bank's capital plan. However, the JST in charge will, in this context, assess whether the conditions as defined in both Articles are actually fulfilled.
8.2.3 TREATMENT OF DEFERRED TAX ASSETS
The preceding section discussed, inter alia, the CET1 capital deductions due to deferred tax assets (DTAs). This section provides more detail on the various types of DTAs and their treatment across countries and participating banks.
As mentioned in the preceding section, the CRR differentiates between three types of deferred tax assets:
- DTAs that rely on future profitability and arise from temporary differences.
- Other DTAs that rely on future profitability.
- DTAs that do not rely on future profitability.
The delineation between DTAs that do not rely on future profitability and those that do is crucial in this context. The regulatory and accounting treatment of different types of DTAs is reflected in the calculation of tax effects in the comprehensive assessment.
For those DTAs that do not rely on future profitability, the bank in question does not need to generate taxable profits to realise their full value. The CRR prescribes that these DTAs do not need to be deducted from banks' CET1 capital. The existence of such DTAs is largely driven by tax laws transforming the DTAs into assets that are guaranteed by the government, e.g. tax credits. By 31 December 2013, Spain and Italy had already passed such tax laws. In the period from 1 January 2014 to the publication of this report, both Portugal and Greece have passed tax laws that effectively state guarantee DTAs or are in the process of doing so. The comprehensive assessment results reflect the effect of the tax laws passed in Spain and Italy. Due to the timing of their respective implementation the new law in Portugal is reflected in the stress test but not in the AQR, whereas for Greece they will be accounted for in banks' capital plans, conditional on the fulfilment of certain requirements, given that the implementation of the respective law is still in progress.
The ECB notes that this transformation of DTAs does not create new capital compared to the past and that those conversions increase the loss absorbing quality of DTAs, but it should be pointed out that such a tax law change brings with it a number of macro-prudential implications. As stated in the ECB's opinion on a draft Portuguese law about Deferred Tax Assets, |109| the conversion of DTAs into assets guaranteed by the State may reduce the incentive and/or the regulatory need for shareholders to inject fresh capital into credit institutions. Furthermore, compared with the recapitalisation of the banking sector with cash provided by private investors, the DTA/tax credit scheme may create an additional debt burden for the State, irrespective of the statistical treatment of the scheme; it may strengthen the adverse link between the sovereign debt and participating credit institutions and be less favourable in comparative terms from a bank liquidity perspective.
The value of DTAs that do rely on future profitability can only be realised to the extent that a bank actually generates taxable profits in the future. This is reflected in both accounting rules and the regulatory treatment of DTAs under CRR. IAS 12 states that DTAs shall only be realised on the balance sheet to the extent that it is probable that taxable profit will be available in the future against which they can be utilised. CRR requires DTAs that rely on future profitability to be deducted from CET1, with a modified treatment for the sub-category of such DTAs that arises from temporary differences between the book value of an asset or liability in the balance sheet and its tax base. As mentioned in the preceding section, the CET1 deductions are subject to phase-in rules, i.e. they only have to be applied gradually during the first years of CRR being in force.
The figure below shows the stock of DTAs that rely on future profitability held by banks by country at the starting point of the AQR. The aggregate stock prior to the comprehensive assessment amounted to around �105.6 billion, equivalent to around 10.6% of aggregate CET1 starting capital. Country-level differences in absolute stocks are, to a significant degree, driven by the size of the banks, but the DTA stock in relation to banks' CET1 indicates differences in practices with respect to their recognition on banks' balance sheets.
Figure 76 Stock of DTAs requiring future profitability, pre-AQR

Click to enlarge1. Figures do not reflect the effect of the new tax law that was implemented in Portugal in 2014 (i.e. after the AQR reference date).
Limits in this respect are determined by a combination of country-specific tax laws and statutory auditors' judgement in assessing the probability of banks being able to generate sufficient taxable profits in the future in relation to the stock of DTAs.
The latter is a bank-specific factor that can lead to significant differences between banks within and across jurisdictions. Comparing the stocks of DTAs that rely on future profitability with the annual amounts of tax paid, bank-level divergences regarding the recognition of DTAs become apparent. By dividing those DTA stocks by future annual tax expense one can determine an approximate number of years of profits that a bank would need to realise the full value of its DTAs relying on future profitability. This figure is an approximate indicator of how strict practices on DTA recognition have been.
Calculating it using the participating banks' average tax paid under the baseline scenario of the stress test as the relevant estimate of future annual tax expense, one finds that the vast majority of banks (a total of 75) hold stocks of DTAs relying on future profitability that are equivalent to five years or less of annual tax expenses. The total stock held by those banks amounts to approximately �41.7 billion. For another ten participating banks, holding a stock of approximately � 27.3 billion, the figure lies between six and ten years.
For individual institutions, however, the total stock exceeds those numbers many times over, making their stock of DTAs relying on future profitability appear large in relation to estimates of future taxes. Realising the full value of those DTAs would require baseline taxable profits generated over significantly more than 10 years in some cases. 31 participating banks are not projected to make profits during the baseline scenario, but those banks nonetheless hold around �15.7 billion of DTA stock.
It should be noted that the calculations above are based on the profits (and the related tax expenses) projected in the baseline scenario of the stress test. Those are, by nature, forward-looking estimates, and as such, subject to uncertainty. For banks which will manage to significantly outperform their forecasts in the baseline scenario in terms of profitability, the indicator may thus turn out to be overly conservative. However, the opposite applies to banks that will underperform relative to the projections.
It is important to recall that the CRR allows competent authorities to set the percentage for the deduction of DTAs relying on future profitability at 0% in 2014 for DTAs which have existed before 1 January 2014 (i.e. those shown above), increasing by 10% each year until 2023. Depending on competent authority choices, this implies that, while the negative CET1 impact of the existing DTA stocks may not yet be very severe at the current stage, it will gradually become more so and is likely to be significant for some banks in the later stage of the decade.
The SSM will thoroughly look into the matter of DTAs which are solely dependent on future profitability as part of its assessment of the capital quality of its supervised banks.
9.1 LIST OF PARTICIPATING BANKS IN THE COMPREHENSIVE ASSESSMENT AND PEER GROUPS
The table below contains a list of all participating banks, as well as a further details on the peer group in which they were included, and their inclusion in specific sections of the comprehensive assessment. Note that ownership relationships between the banks are not considered in the report. Further details on these fields are provided hereafter.
RWA peer group field
Banks are clustered according to their total bank RWAs as of year-end 2013. Five buckets are used: G-SIB, |110| >�75 billion, �25-75 billion, �10-25 billion, <�10 billion.
Stress test fields
EBA stress test - Participating banks in the AQR which are in-scope for EBA stress test at the level of consolidation at which they are included in the comprehensive assessment.
Join-up - Participating banks in the AQR in-scope for join-up (note that all Banks in the AQR are also in-scope for the stress test).
Static vs. dynamic Balance Sheet - Some banks under restructuring used dynamic balance sheets in the stress test. As a general rule, these were participating banks that have submitted restructuring plans for approval by DG Competition as of 31 December 2013 and have commitments to DG Competition going forward. In a few limited cases banks submitted static balance sheets for the stress test, but will have both results in disclosure (Both).
AQR fields
Bank included only in PP&A - Participating banks which performed only the processes, policies and accounting review, which was a qualitative assessment.
Non-derivative revaluations - Participating banks in-scope for the non-derivative revaluations.
Derivative Pricing Models review - Participating banks which had models in-scope for the Derivative Pricing Models review.
Core processes review - Participating banks in-scope for the core processes review qualitative assessment.
SSM field
Significant credit institution - The ECB will directly supervise the largest euro area banks. These 120 significant credit institutions represent almost 85% of total banking assets in the euro area. Not all participating banks are now considered significant banks for direct future supervision by the ECB. |111| Note:
- The ECB oversees all "significant" and "less significant" credit institutions in participating Member States through direct and indirect banking supervision. The less significant credit institutions in the participating countries will continue to be directly supervised by the NCAs under the overall oversight of the ECB.
- The ECB can decide at any time to exercise direct supervision in order to ensure consistent application of high supervisory standards.
- The "significance" of credit institutions is based on: the total value of their assets, the importance for the economy of the country in which they are located or the EU as a whole, the scale of their cross-border activities and whether they have requested or received public financial assistance from the European Stability Mechanism (ESM) or the European Financial Stability Facility (EFSF).
Note that the following banks did not participate in the comprehensive assessment but will be directly supervised by the ECB as significant institutions: Banco de Credito Social Cooperativo, Banesco Holding Hispania |112|, Banque Degroof S.A., Barclays Bank PLC (Italy), Novo Banco SA, Sberbank Europe AG, Unicredit Banka Slovenija d.d. and VTB Bank (Austria) AG.
Among these banks, those which are not subsidiaries of other significant banks will be subject to a comprehensive assessment after 4 November 2014.
Table 11 List of participating banks in the comprehensive assessment and inclusion in peer groups Group Stress test AQR SSM Name |1| RWA group (� billion) EBA Stress Test Join-up Static vs. Dynamic Balance Sheet Bank included only in PP&A Non-derivative revelations Derivative Pricing Models review Core Processes Review Significant credit institution Austria BAWAG P.S.K. Bank fur Arbeit und Wirtschaft und Osterreichische Postsparkasse AG |2| 10-25 ⎷ ⎷ Static x x x x ⎷ Erste Group Bank AG >75 ⎷ ⎷ Static x ⎷ x x ⎷ Raiffeisenlandesbank Oberosterreich AG 25-75 ⎷ ⎷ Static x ⎷ x x ⎷ Raiffeisenlandesbank Niederosterreich-Wien AG 10-25 ⎷ ⎷ Static x ⎷ x x ⎷ Raiffeisen Zentralbank Osterreich AG >75 ⎷ ⎷ Static x ⎷ x x ⎷ Osterreichische Volksbanken-AG with credit institutions affiliated according to Article 10 of the CRR 25-75 ⎷ ⎷ Dynamic x ⎷ x x ⎷ Belgium AXA Bank Europe SA <10 ⎷ ⎷ Static x x x x ⎷ Belfius Banque SA 25-75 ⎷ ⎷ Dynamic x x ⎷ ⎷ ⎷ Dexia NV 25-75 ⎷ ⎷ Dynamic x ⎷ ⎷ ⎷ ⎷ Investar (Holding of Argenta Bank- en Verzekeringsgroep) <10 ⎷ ⎷ Static x ⎷ x x ⎷ KBC Group NV >75 ⎷ ⎷ Dynamic x ⎷ ⎷ ⎷ ⎷ The Bank of New York Mellon SA 10-25 x ⎷ Static ⎷ x x x ⎷ Cyprus Bank of Cyprus Public Company Ltd 10-25 ⎷ ⎷ Dynamic x x x x ⎷ Cooperative Central Bank Ltd <10 ⎷ ⎷ Static x x x x ⎷ Hellenic Bank Public Company Ltd <10 ⎷ ⎷ Static x x x x ⎷ Russian Commercial Bank (Cyprus) Ltd (RCB Bank Ltd) <10 x ⎷ Static ⎷ x x x ⎷ Germany Aareal Bank AG 10-25 ⎷ ⎷ Static x ⎷ x x ⎷ Bayerische Landesbank >75 ⎷ ⎷ Static x ⎷ ⎷ ⎷ ⎷ Commerzbank AG >75 ⎷ ⎷ Dynamic x ⎷ ⎷ ⎷ ⎷ DekaBank Deutsche Girozentrale 25-75 ⎷ ⎷ Static x ⎷ ⎷ ⎷ ⎷ Deutsche Apotheker- und Arztebank eG 10-25 ⎷ ⎷ Static x x x x ⎷ Deutsche Bank AG G-SIB ⎷ ⎷ Static x ⎷ ⎷ ⎷ ⎷ DZ Bank AG Deutsche Zentral-Genossenschaftsbank >75 ⎷ ⎷ Static x ⎷ ⎷ ⎷ ⎷ HASPA Finanzholding 25-75 ⎷ ⎷ Static x x x x ⎷ HSH Nordbank AG 25-75 ⎷ ⎷ Static x ⎷ ⎷ x ⎷ Hypo Real Estate Holding AG 10-25 ⎷ ⎷ Dynamic x x x ⎷ ⎷ IKB Deutsche Industriebank AG 10-25 ⎷ ⎷ Static x ⎷ x x x KfW IPEX-Bank GmbH 10-25 ⎷ ⎷ Static x x x x x Landesbank Baden-Wurttemberg >75 ⎷ ⎷ Dynamic x ⎷ ⎷ ⎷ ⎷ Landesbank Berlin Holding AG 25-75 ⎷ ⎷ Static x x x x ⎷ Landesbank Hessen-Thuringen Girozentrale 25-75 ⎷ ⎷ Static x x x ⎷ ⎷ Landeskreditbank Baden-Wurttemberg-Forderbank 10-25 ⎷ ⎷ Static x x x x ⎷ Landwirtschaftliche Rentenbank 10-25 ⎷ ⎷ Static x x x x ⎷ Munchener Hypothekenbank eG <10 ⎷ ⎷ Static x x x x ⎷ Norddeutsche Landesbank-Girozentrale 25-75 ⎷ ⎷ Dynamic x ⎷ x x ⎷ NRW.Bank 25-75 ⎷ ⎷ Static x x x x ⎷ SEB AG 10-25 x ⎷ Static x x x x ⎷ Volkswagen Financial Services AG >75 ⎷ ⎷ Static x ⎷ x x ⎷ WGZ Bank AG Westdeutsche Genossenschafts-Zentralbank 10-25 ⎷ ⎷ Static x ⎷ x x ⎷ Wustenrot Bank AG Pfandbriefbank <10 ⎷ ⎷ Static x x x x x Wustenrot Bausparkasse AG |3| <10 ⎷ ⎷ Static x x x x x Estonia AS DNB Bank <10 x ⎷ Static x x x x x AS SEB Pank <10 x ⎷ Static x x x x ⎷ Swedbank AS <10 x ⎷ Static x x x x ⎷ Spain Banco Bilbao Vizcaya Argentaria, S.A. (BBVA) G-SIB ⎷ ⎷ Static x ⎷ ⎷ ⎷ ⎷ Banco de Sabadell, S.A. (Sabadell) >75 ⎷ ⎷ Dynamic x ⎷ x x ⎷ Banco Financiero y de Ahorros, S.A. (BFA/Bankia) >75 ⎷ ⎷ Dynamic x ⎷ x x ⎷ Banco Mare Nostrum, S.A. 10-25 ⎷ ⎷ Dynamic x x x x ⎷ Banco Popular Espanol, S.A. >75 ⎷ ⎷ Static x ⎷ x x ⎷ Bankinter, S.A. 10-25 ⎷ ⎷ Static x x x x ⎷ Banco Santander, S.A. (Santander) G-SIB ⎷ ⎷ Static x ⎷ ⎷ ⎷ ⎷ Caja de Ahorros y M.P. de Zaragoza, Aragon y Rioja (Ibercaja) 25-75 ⎷ ⎷ Dynamic x ⎷ x x ⎷ Caja de Ahorros y Pensiones de Barcelona (La Caixa) >75 ⎷ ⎷ Dynamic x ⎷ x x ⎷ MPCA Ronda, Cadiz, Almeria, Malaga, Antequera y Jaen |4| (Unicaja-Ceiss) 25-75 ⎷ ⎷ Dynamic x ⎷ x x ⎷ Cajas Rurales Unidas, Sociedad Cooperativa de Credito 10-25 ⎷ ⎷ Static x ⎷ x x ⎷ Catalunya Banc, S.A. 10-25 ⎷ ⎷ Dynamic x ⎷ x x ⎷ Kutxabank, S.A. 25-75 ⎷ ⎷ Static x ⎷ x x ⎷ Liberbank, S.A. 10-25 ⎷ ⎷ Dynamic x x x x ⎷ NCG Banco, S.A. 25-75 ⎷ ⎷ Dynamic x ⎷ x x ⎷ Finland Danske Bank plc (Finland) 10-25 x ⎷ Static x x x x ⎷ Nordea Bank Finland Abp 25-75 x ⎷ Static x x ⎷ ⎷ ⎷ OP-Pohjola Group 25-75 ⎷ ⎷ Static x x x x ⎷ France Banque Centrale de Compensation (LCH Clearnet) <10 x x Static ⎷ x x x x Banque PSA Finance 10-25 ⎷ ⎷ Static x x x x x BNP Paribas G-SIB ⎷ ⎷ Static x ⎷ ⎷ ⎷ ⎷ C.R.H. - Caisse de Refinancement de l'Habitat <10 ⎷ x Static ⎷ x x x ⎷ Groupe BPCE G-SIB ⎷ ⎷ Static x ⎷ ⎷ ⎷ ⎷ Groupe Crédit Agricole G-SIB ⎷ ⎷ Static x ⎷ ⎷ ⎷ ⎷ Groupe Crédit Mutuel >75 ⎷ ⎷ Static x ⎷ x ⎷ ⎷ HSBC France 25-75 x ⎷ Static x x ⎷ ⎷ ⎷ La Banque Postale 25-75 ⎷ ⎷ Static x x x x ⎷ BPI France (Banque Publique d'Investissement) 25-75 ⎷ ⎷ Static x ⎷ x x ⎷ RCI Banque 10-25 ⎷ ⎷ Static x x x x x Société de Financement Local <10 ⎷ ⎷ Dynamic x x x x ⎷ Société Générale G-SIB ⎷ ⎷ Static x ⎷ ⎷ ⎷ ⎷ Greece Alpha Bank, S.A. 25-75 ⎷ ⎷ Both x ⎷ x x ⎷ Eurobank Ergasias, S.A. 25-75 ⎷ ⎷ Both x ⎷ x x ⎷ National Bank of Greece, S.A. 25-75 ⎷ ⎷ Both x ⎷ x x ⎷ Piraeus Bank, S.A. 25-75 ⎷ ⎷ Both x ⎷ x x ⎷ Ireland Allied Irish Banks plc |5| 25-75 ⎷ ⎷ Both x ⎷ x x ⎷ Merrill Lynch International Bank Limited 25-75 x ⎷ Static x ⎷ x x x Permanent tsb plc. 10-25 ⎷ ⎷ Static x x x x ⎷ The Governor and Company of the Bank of Ireland 25-75 ⎷ ⎷ Dynamic x ⎷ x x ⎷ Ulster Bank Ireland Limited 25-75 x ⎷ Static x x x x ⎷ Italy Banca Carige S.P.A. - Cassa di Risparmio di Genova e Imperia 10-25 ⎷ ⎷ Static x ⎷ x x ⎷ Banca Monte dei Paschi di Siena S.p.A. >75 ⎷ ⎷ Dynamic x ⎷ x ⎷ ⎷ Banca Piccolo Credito Valtellinese, Societa Cooperativa 10-25 ⎷ ⎷ Static x x x x x Banca Popolare Dell'Emilia Romagna - Societa Cooperativa 25-75 ⎷ ⎷ Static x ⎷ x x ⎷ Banca Popolare Di Milano - Societa Cooperativa A Responsabilita Limitata 25-75 ⎷ ⎷ Static x ⎷ x x ⎷ Banca Popolare di Sondrio, Societa Cooperativa per Azioni 10-25 ⎷ ⎷ Static x ⎷ x x ⎷ Banca Popolare di Vicenza - Societa Cooperativa per Azioni 25-75 ⎷ ⎷ Static x ⎷ x x ⎷ Banco Popolare - Societa Cooperativa 25-75 ⎷ ⎷ Static x ⎷ x x ⎷ Credito Emiliano S.p.A. 10-25 ⎷ ⎷ Static x x x x x Iccrea Holding S.p.A 10-25 ⎷ ⎷ Static x x x x ⎷ Intesa Sanpaolo S.p.A. >75 ⎷ ⎷ Static x ⎷ ⎷ ⎷ ⎷ Mediobanca - Banca di Credito Finanziario S.p.A. 25-75 ⎷ ⎷ Static x ⎷ ⎷ ⎷ ⎷ UniCredit S.p.A. G-SIB ⎷ ⎷ Static x ⎷ ⎷ ⎷ ⎷ Unione Di Banche Italiane Societa Cooperativa Per Azioni 25-75 ⎷ ⎷ Static x ⎷ x x ⎷ Veneto Banca S.C.P.A. 25-75 ⎷ ⎷ Static x ⎷ x x ⎷ Luxembourg Banque et Caisse d'Epargne de l'Etat, Luxembourg 10-25 ⎷ ⎷ Static x ⎷ x x ⎷ Clearstream Banking S.A. <10 x ⎷ Static ⎷ x x x x Precision Capital S.A. (Holding of Banque Internationale a Luxembourg and KBL European Private Bankers S.A.) |6| <10 ⎷ ⎷ Static x ⎷ x x ⎷ RBC Investor Services Bank S.A. <10 x ⎷ Static x ⎷ x x ⎷ State Street Bank Luxembourg S.A. <10 x ⎷ Static x ⎷ x x ⎷ UBS (Luxembourg) S.A. <10 x ⎷ Static ⎷ x x x ⎷ Latvia ABLV Bank, AS <10 ⎷ ⎷ Static x ⎷ x x ⎷ AS SEB banka <10 x ⎷ Static x x x x ⎷ Swedbank AS <10 x ⎷ Static x ⎷ x x ⎷ Lithuania |7| AB DNB bankas <10 x ⎷ Static x x x x ⎷ AB SEB bankas <10 x ⎷ Static x x x x ⎷ Swedbank AB <10 x ⎷ Static x x x x ⎷ Malta Bank of Valletta plc <10 ⎷ ⎷ Static x x x x ⎷ HSBC Bank Malta plc <10 x ⎷ Static x x x x ⎷ Deutsche Bank (Malta) Ltd <10 x ⎷ Static x x x x ⎷ Netherlands ABN AMRO Bank N.V. >75 ⎷ ⎷ Static x ⎷ x x ⎷ Bank Nederlandse Gemeenten N.V. 10-25 ⎷ ⎷ Static x ⎷ x x ⎷ Cooperatieve Centrale Raiffeisen-Boerenleenbank B.A. >75 ⎷ ⎷ Static x ⎷ x ⎷ ⎷ ING Bank N.V. G-SIB ⎷ ⎷ Static x ⎷ ⎷ ⎷ ⎷ Nederlandse Waterschapsbank N.V. <10 ⎷ ⎷ Static x ⎷ x x ⎷ The Royal Bank of Scotland N.V. 10-25 x ⎷ Static x ⎷ x x ⎷ SNS Bank N.V. 10-25 ⎷ ⎷ Dynamic x ⎷ x x ⎷ Portugal |8| Banco BPI, SA 10-25 ⎷ ⎷ Static x x x x ⎷ Banco Comercial Portugues, SA 25-75 ⎷ ⎷ Dynamic x x x ⎷ ⎷ Caixa Geral de Depositos, SA 25-75 ⎷ ⎷ Dynamic x x x x ⎷ Slovenia Nova Kreditna Banka Maribor d.d. <10 ⎷ ⎷ Static x ⎷ x x ⎷ Nova Ljubljanska banka d. d., Ljubljana <10 ⎷ ⎷ Static x ⎷ x x ⎷ SID - Slovenska izvozna in razvojna banka, d.d., Ljubljana <10 ⎷ ⎷ Static x x x x x Slovakia Slovenska sporitel'na, a.s. <10 x ⎷ Static x x x x ⎷ Vseobecna uverova banka, a.s. <10 x ⎷ Static x x x x ⎷ Tatra banka, a.s. <10 x ⎷ Static x x x x ⎷ 1. When the commercial name of the bank is different, this is included in brackets, and used in the remainder of the report
2. Note how this will be supervised in the future under the umbrella of Promontoria Sacher Holding N.V.
3. Note how Wüstenrot & Württembergische AG (W&W AG) (Holding of Wüstenrot Bank AG Pfandbriefbank and Wüstenrot Bausparkasse AG) was treated as a unit for some components of the review.
4. Note how this includes Caja España de Inversiones, Salamance y Soria, CAMP, which was included as a separate institution in the list of institutions included in the CA as released by the ECB in October 2013. Further details in Appendix 9.4
5. Note the bank did not have a dynamic join-up calculation and the disclosure was done only based on their dynamic balance sheet.
6. Note that the two entities of Precision Capital S.A., namely BIL and KBL European Private Bankers S.A., were treated separately for some components of the AQR.
7. Note that Lithuanian entities were not included in the list of institutions included in the CA as released by the ECB in October 2013. Further details in Appendix 9.4
8. Note how Espírito Santo Financial Group, SA is excluded from the CA, even though it was included in the list of institutions in the CA as released by the ECB in October 2013. Further details in Appendix 9.4
Table 12 CET1 ratios for participating Name Bank reported 2013 AQR adj. 2013 Post CA 2014 Baseline Post CA 2015 Baseline Post CA 2016 Baseline Post CA 2014 Adverse Post CA 2015 Adverse Post CA 2016 Adverse Austria BAWAG P.S.K. Bank fur Arbeit und Wirtschaft und Osterreichische Postsparkasse AG 14.5% 14.3% 13.7% 12.8% 11.9% 12.8% 10.6% 8.5% Erste Group Bank AG 11.2% 10.0% 10.1% 10.6% 11.2% 9.1% 8.4% 7.6% Raiffeisenlandesbank Oberosterreich AG 11.4% 10.3% 10.6% 11.0% 11.3% 9.1% 8.8% 7.9% Raiffeisenlandesbank Niederosterreich-Wien AG 17.5% 16.8% 17.0% 17.1% 17.2% 15.2% 13.5% 11.8% Raiffeisen Zentralbank Osterreich AG 10.4% 9.7% 9.8% 9.6% 9.5% 9.2% 8.4% 7.8% Osterreichische Volksbanken-AG with credit institutions affiliated according to Article 10 of the CRR 11.5% 10.3% 9.5% 8.8% 7.2% 8.0% 5.9% 2.1% Belgium AXA Bank Europe SA 15.2% 14.7% 13.2% 12.9% 12.7% 8.7% 5.0% 3.4% Belfius Banque SA 13.8% 13.5% 12.9% 11.9% 11.0% 11.4% 9.2% 7.3% Dexia NV 16.4% 15.8% 14.9% 13.1% 10.8% 11.8% 8.2% 5.0% Investar (Holding of Argenta Bank- en Verzekeringsgroep) 24.3% 24.1% 23.4% 22.0% 20.1% 20.4% 17.0% 14.7% KBC Group NV 13.3% 12.7% 12.0% 12.5% 12.4% 10.8% 9.6% 8.3% The Bank of New York Mellon SA 14.9% 14.8% 14.9% 15.2% 15.3% 13.6% 12.5% 11.2% Cyprus Bank of Cyprus Public Company Ltd 10.4% 7.3% 7.7% 9.8% 12.9% 4.1% 2.5% 1.5% Cooperative Central Bank Ltd -3.7% -3.7% -3.2% -1.5% 0.5% -6.1% -7.1% -8.0% Hellenic Bank Public Company Ltd 7.6% 5.2% 6.2% 7.7% 9.1% 1.9% 0.6% -0.5% Russian Commercial Bank (Cyprus) Ltd (RCB Bank Ltd) 16.7% 16.7% 16.2% 15.9% 15.7% 15.4% 13.9% 11.6% Germany Aareal Bank AG 16.4% 16.3% 16.5% 16.5% 16.4% 12.5% 12.1% 11.8% Bayerische Landesbank 14.0% 13.2% 12.9% 12.8% 12.4% 11.3% 10.2% 9.4% Commerzbank AG 11.4% 10.8% 11.4% 11.5% 11.7% 9.1% 8.2% 8.0% DekaBank Deutsche Girozentrale 14.2% 14.0% 13.1% 12.4% 12.3% 10.6% 8.8% 8.0% Deutsche Apotheker- und Arztebank eG 16.5% 16.4% 17.3% 18.1% 18.4% 16.0% 15.4% 14.7% Deutsche Bank AG 13.4% 13.3% 13.5% 13.0% 12.5% 11.0% 9.5% 8.8% DZ Bank AG Deutsche Zentral-Genossenschaftsbank 9.2% 9.0% 8.9% 8.8% 8.7% 7.3% 6.6% 6.0% HASPA Finanzholding 12.5% 12.5% 12.4% 12.5% 12.5% 11.4% 11.1% 10.7% HSH Nordbank AG 10.0% 10.0% 10.0% 10.0% 9.4% 10.0% 8.6% 6.1% Hypo Real Estate Holding AG 16.7% 16.5% 18.2% 20.4% 21.2% 12.4% 11.5% 10.8% IKB Deutsche Industriebank AG 9.4% 9.0% 8.9% 8.7% 8.8% 8.1% 7.0% 6.5% KfW IPEX-Bank GmbH 13.2% 12.8% 12.0% 12.1% 12.3% 10.8% 10.0% 9.4% Landesbank Baden-Wurttemberg 14.0% 13.5% 13.1% 12.8% 12.3% 11.0% 9.5% 7.4% Landesbank Berlin Holding AG 10.0% 9.9% 10.1% 10.5% 10.5% 8.3% 7.3% 6.8% Landesbank Hessen-Thuringen Girozentrale 12.5% 12.2% 11.4% 11.4% 11.6% 8.9% 8.3% 8.2% Landeskreditbank Baden-Wurttemberg-Forderbank 13.5% 13.5% 13.8% 14.2% 14.5% 12.9% 12.0% 11.2% Landwirtschaftliche Rentenbank 16.9% 16.9% 16.1% 16.8% 17.7% 13.9% 13.5% 12.9% Munchener Hypothekenbank eG 6.9% 6.9% 6.0% 5.8% 5.8% 4.9% 3.8% 2.9% Norddeutsche Landesbank-Girozentrale 10.6% 10.1% 10.9% 11.6% 12.9% 9.1% 8.8% 9.2% NRW.Bank 37.3% 37.3% 36.1% 35.0% 33.8% 34.9% 32.5% 31.5% SEB AG 17.1% 16.9% 17.0% 17.0% 17.0% 15.0% 14.5% 12.8% Volkswagen Financial Services AG 9.5% 9.3% 9.8% 10.1% 10.4% 8.8% 7.9% 7.0% WGZ Bank AG Westdeutsche Genossenschafts-Zentralbank 10.6% 10.0% 9.9% 9.9% 9.7% 8.8% 8.0% 7.3% Wustenrot Bank AG Pfandbriefbank 8.6% 8.6% 8.3% 8.2% 8.0% 7.7% 7.0% 6.5% Wustenrot Bausparkasse AG 10.6% 10.6% 10.1% 9.8% 9.7% 8.9% 7.7% 6.9% Estonia AS DNB Bank 20.0% 14.2% 14.2% 14.5% 14.8% 12.7% 12.5% 11.8% AS SEB Pank 23.3% 22.7% 23.6% 25.1% 26.5% 23.3% 24.4% 25.4% Swedbank AS 32.6% 31.9% 32.9% 34.1% 35.4% 32.9% 33.8% 34.6% Spain Banco Bilbao Vizcaya Argentaria, S.A. (BBVA) 10.7% 10.5% 10.2% 10.4% 10.6% 9.5% 9.2% 9.0% Banco de Sabadell, S.A. (Sabadell) 10.3% 10.3% 10.2% 10.2% 10.2% 9.3% 8.9% 8.3% Banco Financiero y de Ahorros, S.A. (BFA/Bankia) 10.7% 10.6% 12.3% 13.3% 14.3% 10.9% 10.5% 10.3% Banco Mare Nostrum, S.A. 9.4% 9.0% 10.3% 11.4% 11.5% 8.3% 8.1% 8.1% Banco Popular Espanol, S.A. 10.6% 10.1% 10.2% 10.5% 10.9% 8.9% 8.1% 7.6% Bankinter, S.A. 12.0% 11.7% 11.6% 12.3% 12.9% 10.8% 10.8% 11.0% Banco Santander, S.A. (Santander) 10.4% 10.3% 11.1% 11.5% 12.0% 10.2% 9.6% 8.9% Caja de Ahorros y M.P. de Zaragoza, Aragon y Rioja (Ibercaja) 10.0% 10.0% 10.3% 10.5% 10.5% 9.4% 8.7% 7.8% Caja de Ahorros y Pensiones de Barcelona (La Caixa) 10.3% 10.2% 10.8% 11.2% 11.5% 9.7% 9.3% 9.3% MPCA Ronda, Cadiz, Almeria, Malaga, Antequera y Jaen (Unicaja-Ceiss) 11.1% 10.9% 11.1% 11.5% 11.9% 10.1% 9.6% 8.9% Cajas Rurales Unidas, Sociedad Cooperativa de Credito 11.0% 9.9% 10.2% 10.2% 10.2% 9.2% 8.6% 8.0% Catalunya Banc, S.A. 12.3% 12.2% 11.8% 12.3% 12.5% 9.9% 8.8% 8.0% Kutxabank, S.A. 12.1% 12.0% 12.4% 12.7% 13.1% 12.0% 11.9% 11.8% Liberbank, S.A. 8.7% 7.8% 8.6% 8.5% 9.4% 6.6% 5.8% 5.6% NCG Banco, S.A. 10.3% 10.2% 11.5% 12.5% 13.9% 9.6% 9.2% 9.1% Finland Danske Bank plc (Finland) 15.2% 14.9% 15.2% 15.4% 15.7% 14.4% 13.8% 13.4% Nordea Bank Finland Abp 14.1% 13.7% 14.1% 14.4% 14.7% 11.8% 10.7% 10.4% OP-Pohjola Group 17.1% 16.4% 17.2% 17.6% 17.6% 15.3% 13.3% 12.0% France Banque Centrale de Compensation (LCH Clearnet) 60.5% 60.5% 60.5% 60.5% 60.2% 53.1% 46.3% 39.1% Banque PSA Finance 14.1% 14.0% 14.2% 14.1% 14.1% 13.4% 13.0% 12.7% BNP Paribas 10.7% 10.5% 10.3% 10.5% 10.5% 9.4% 8.7% 8.1% C.R.H. - Caisse de Refinancement de l'Habitat 5.7% 5.7% 5.7% 5.7% 5.7% 5.7% 5.6% 5.5% Groupe BPCE 10.3% 10.0% 10.1% 10.1% 10.1% 8.6% 7.8% 7.0% Groupe Crédit Agricole 11.0% 10.8% 11.1% 11.5% 11.9% 9.9% 9.1% 8.8% Groupe Crédit Mutuel 13.9% 13.8% 14.4% 15.1% 15.7% 13.4% 13.2% 12.9% HSBC France 12.9% 12.6% 11.2% 11.4% 11.6% 8.0% 7.2% 6.6% La Banque Postale 10.0% 10.0% 10.1% 10.6% 10.7% 9.5% 9.4% 9.1% BPI France (Banque Publique d'Investissement) 30.5% 30.4% 30.1% 31.9% 32.9% 29.5% 30.4% 30.7% RCI Banque 11.7% 11.7% 12.0% 12.0% 12.1% 11.5% 10.3% 9.1% Société de Financement Local 24.3% 23.3% 22.4% 23.5% 25.8% 13.2% 13.1% 13.2% Société Generale 10.9% 10.7% 10.6% 10.6% 10.6% 9.5% 8.9% 8.1% Greece Alpha Bank, S.A. 15.9% 14.0% 14.0% 13.9% 13.8% 11.8% 10.1% 8.1% Eurobank Ergasias, S.A. 10.6% 7.8% 6.5% 4.4% 2.0% 2.9% -1.2% -6.4% National Bank of Greece, S.A. 10.7% 7.5% 6.8% 6.2% 5.7% 3.3% 1.5% -0.4% Piraeus Bank, S.A. 13.7% 10.0% 9.8% 9.3% 9.0% 8.6% 6.6% 4.4% Ireland Allied Irish Banks plc 15.0% 14.6% 13.8% 13.4% 12.4% 11.7% 9.4% 6.9% Merrill Lynch International Bank Limited 15.2% 14.9% 13.2% 12.0% 10.9% 12.7% 10.9% 9.5% Permanent tsb plc. 13.1% 12.8% 11.3% 10.1% 8.8% 9.2% 5.4% 1.0% The Governor and Company of the Bank of Ireland 12.4% 11.8% 12.4% 13.0% 13.2% 11.5% 10.4% 9.3% Ulster Bank Ireland Limited 11.6% 11.6% 10.9% 10.4% 10.0% 9.3% 7.7% 6.2% Italy Banca Carige S.P.A. - Cassa di Risparmio di Genova e Imperia 5.2% 3.9% 3.7% 2.9% 2.3% 1.2% -0.3% -2.4% Banca Monte dei Paschi di Siena S.p.A. 10.2% 7.0% 6.7% 6.0% 6.4% 4.7% 2.0% -0.1% Banca Piccolo Credito Valtellinese, Societa Cooperativa 8.8% 7.5% 7.1% 6.9% 7.1% 6.2% 5.0% 3.5% Banca Popolare Dell'Emilia Romagna - Societa Cooperativa 9.2% 8.4% 8.4% 8.4% 8.3% 6.9% 6.1% 5.2% Banca Popolare Di Milano - Societa Cooperativa A Responsabilita Limitata 7.3% 6.9% 6.5% 6.7% 6.9% 5.7% 5.0% 4.0% Banca Popolare di Sondrio, Societa Cooperativa per Azioni 8.2% 7.4% 7.2% 7.3% 7.4% 6.0% 5.1% 4.2% Banca Popolare di Vicenza - Societa Cooperativa per Azioni 9.4% 7.6% 7.5% 7.5% 7.7% 5.5% 4.4% 3.2% Banco Popolare - Societa Cooperativa 10.1% 7.9% 7.9% 7.5% 6.7% 7.2% 6.1% 4.7% Credito Emiliano S.p.A. 11.0% 10.9% 10.9% 11.0% 11.0% 9.5% 9.3% 8.9% Iccrea Holding S.p.A 11.1% 10.6% 10.8% 11.0% 11.2% 8.8% 8.2% 7.4% Intesa Sanpaolo S.p.A. 12.0% 11.7% 11.6% 11.4% 11.2% 10.0% 9.3% 8.3% Mediobanca - Banca di Credito Finanziario S.p.A. 9.3% 8.4% 9.0% 9.2% 9.2% 7.9% 7.0% 6.2% UniCredit S.p.A. 9.8% 9.6% 9.5% 9.5% 9.6% 8.4% 7.4% 6.8% Unione Di Banche Italiane Societa Cooperativa Per Azioni 12.3% 11.8% 11.6% 11.1% 10.9% 10.8% 9.6% 8.2% Veneto Banca S.C.P.A. 7.3% 5.7% 5.8% 5.9% 5.9% 4.4% 3.8% 2.7% Luxembourg Banque et Caisse d'Epargne de l'Etat, Luxembourg 17.1% 17.0% 15.4% 16.1% 16.8% 13.4% 12.9% 12.8% Clearstream Banking S.A. 19.4% 19.4% 19.3% 19.3% 19.3% 17.9% 18.3% 18.1% Precision Capital S.A. (Holding of Banque Internationale a Luxembourg and KBL European Private Bankers S.A.) 14.8% 14.0% 13.7% 12.8% 12.5% 11.8% 9.8% 8.3% RBC Investor Services Bank S.A. 25.9% 25.9% 22.5% 21.3% 20.3% 19.5% 16.3% 13.0% State Street Bank Luxembourg S.A. 23.9% 23.7% 25.3% 27.2% 28.8% 22.3% 21.9% 21.9% UBS (Luxembourg) S.A. 14.0% 14.0% 12.7% 12.8% 12.0% 12.9% 11.7% 9.9% Latvia ABLV Bank, AS 10.4% 9.8% 9.8% 9.8% 10.5% 9.1% 8.8% 7.7% AS SEB banka 15.3% 13.3% 13.2% 14.0% 14.8% 12.7% 12.2% 11.9% Swedbank AS 32.6% 32.4% 32.1% 32.7% 33.0% 31.8% 32.1% 32.1% Lithuania AB DNB bankas 17.1% 16.3% 16.3% 16.3% 16.2% 15.3% 14.0% 12.7% AB SEB bankas 15.4% 14.9% 14.9% 15.3% 15.6% 14.3% 13.7% 13.3% Swedbank AB 22.5% 22.4% 23.2% 23.7% 24.2% 22.9% 23.1% 23.2% Malta Bank of Valletta plc 11.2% 10.7% 11.9% 12.7% 13.2% 10.2% 9.8% 8.9% HSBC Bank Malta plc 9.9% 9.0% 9.3% 9.7% 10.2% 8.9% 8.9% 8.9% Deutsche Bank (Malta) Ltd 281.4% 281.4% 281.3% 280.7% 280.6% 138.8% 138.8% 138.8% Netherlands ABN AMRO Bank N.V. 12.2% 12.1% 12.5% 13.0% 13.6% 10.7% 9.7% 9.1% Bank Nederlandse Gemeenten N.V. 23.7% 21.9% 21.3% 22.0% 22.3% 18.7% 18.2% 17.3% Cooperatieve Centrale Raiffeisen-Boerenleenbank B.A. 12.8% 12.0% 11.6% 11.3% 11.2% 10.3% 9.1% 8.4% ING Bank N.V. 10.4% 10.1% 10.4% 10.9% 11.4% 9.7% 9.1% 8.7% Nederlandse Waterschapsbank N.V. 75.6% 72.5% 72.6% 72.3% 73.2% 66.8% 60.6% 54.0% The Royal Bank of Scotland N.V. 14.5% 14.5% 15.2% 14.3% 13.3% 11.8% 8.5% 7.2% SNS Bank N.V. 15.5% 14.9% 15.0% 15.2% 16.0% 12.9% 10.3% 6.8% Portugal Banco BPI, SA 15.3% 15.2% 15.3% 15.3% 14.9% 14.1% 13.1% 11.6% Banco Comercial Portugues, SA 12.2% 10.3% 10.4% 9.5% 8.8% 6.9% 4.9% 3.0% Caixa Geral de Depositos, SA 10.8% 10.4% 10.3% 10.0% 9.4% 8.9% 7.6% 6.1% Slovenia Nova Kreditna Banka Maribor d.d. 19.6% 15.7% 15.2% 13.8% 12.8% 11.4% 7.5% 4.4% Nova Ljubljanska banka d. d., Ljubljana 16.1% 14.6% 13.8% 13.1% 12.8% 8.6% 6.9% 5.0% SID - Slovenska izvozna in razvojna banka, d.d., Ljubljana 24.2% 22.8% 23.8% 24.9% 25.3% 19.4% 17.6% 14.5% Slovakia Slovenska sporiteFna, a.s. 20.5% 19.5% 19.9% 20.4% 20.8% 19.5% 20.2% 19.1% Vseobecna uverova banka, a.s. 16.0% 15.8% 15.9% 16.1% 16.1% 14.6% 14.3% 13.8% Tatra banka, a.s. 15.4% 14.9% 15.0% 14.8% 14.8% 13.5% 12.6% 11.7%
Table 13 Buffer (+) / shortfalls (-) for participating banks (� million) Name Bank reported 2013 AQR adj. 2013 Post CA 2014 Baseline Post CA 2015 Baseline Post CA 2016 Baseline Post CA 2014 Adverse Post CA 2015 Adverse Post CA 2016 Adverse Austria BAWAG P.S.K. Bank fur Arbeit und Wirtschaft und Osterreichische Postsparkasse AG 1,097 1,064 961 807 651 1,258 904 552 Erste Group Bank AG 3,200 2,036 2,173 2,722 3,286 3,835 3,109 2,278 Raiffeisenlandesbank Oberosterreich AG 902 612 684 808 894 976 905 668 Raiffeisenlandesbank Niederosterreich-Wien AG 1,239 1,157 1,177 1,192 1,198 1,302 1,069 841 Raiffeisen Zentralbank Osterreich AG 2,160 1,570 1,632 1,465 1,367 3,413 2,741 2,106 Osterreichische Volksbanken-AG with credit institutions affiliated according to Article 10 of the CRR 955 638 411 206 -191 691 97 -865 Belgium AXA Bank Europe SA 376 350 293 278 273 193 -43 -200 Belfius Banque SA 3,061 2,887 2,626 2,087 1,608 3,395 2,274 1,130 Dexia NV 4,501 4,200 3,675 2,611 1,401 3,690 1,637 -339 Investar (Holding of Argenta Bank- en Verzekeringsgroep) 931 922 947 916 838 1,005 887 768 KBC Group NV 4,873 4,347 3,741 4,183 4,145 5,140 4,094 2,842 The Bank of New York Mellon SA 744 742 769 800 823 902 792 661 Cyprus Bank of Cyprus Public Company Ltd 567 -168 -69 441 1,137 -355 -728 -919 Cooperative Central Bank Ltd -1,014 -1,015 -974 -820 -651 -1,002 -1,096 -1,169 Hellenic Bank Public Company Ltd -17 -126 -85 -16 54 -165 -224 -277 Russian Commercial Bank (Cyprus) Ltd (RCB Bank Ltd) 142 142 139 136 134 173 150 112 Germany Aareal Bank AG 1,120 1,107 1,150 1,169 1,173 1,212 1,162 1,114 Bayerische Landesbank 5,632 4,864 4,577 4,489 4,155 6,164 5,291 4,502 Commerzbank AG 7,313 6,158 7,198 7,399 7,711 8,789 6,884 6,011 DekaBank Deutsche Girozentrale 1,586 1,553 1,393 1,257 1,235 1,487 1,053 821 Deutsche Apotheker- und Arztebank eG 904 890 1,001 1,098 1,137 1,158 1,139 1,081 Deutsche Bank AG 19,064 18,818 20,166 18,637 17,190 23,329 19,065 15,699 DZ Bank AG Deutsche Zentral-Genossenschaftsbank 1,162 985 947 865 711 2,103 1,316 588 HASPA Finanzholding 1,412 1,407 1,412 1,432 1,464 1,937 1,849 1,745 HSH Nordbank AG 758 757 764 768 546 1,869 1,291 236 Hypo Real Estate Holding AG 2,128 2,091 1,856 2,039 2,075 1,717 1,535 1,323 1KB Deutsche Industriebank AG 195 150 122 98 115 372 225 145 KfW IPEX-Bank GmbH 962 897 768 792 813 1,091 964 845 Landesbank Baden-Wurttemberg 5,284 4,845 4,587 4,329 3,907 5,358 3,921 1,950 Landesbank Berlin Holding AG 615 591 686 818 846 1,022 756 569 Landesbank Hessen-Thuringen Girozentrale 2,543 2,397 2,128 2,127 2,199 2,446 2,010 1,935 Landeskreditbank Baden-Wurttemberg-Forderbank 1,194 1,194 1,270 1,344 1,415 1,664 1,501 1,335 Landwirtschaftliche Rentenbank 1,532 1,526 1,517 1,653 1,824 1,671 1,614 1,572 Munchener Hypothekenbank eG -87 -87 -156 -173 -177 -46 -145 -229 Norddeutsche Landesbank-Girozentrale 1,913 1,553 2,032 2,426 3,092 2,635 2,417 2,614 NRW.Bank 14,116 14,116 13,989 13,828 13,646 15,145 14,897 14,758 SEB AG 1,071 1,047 1,052 1,056 1,053 1,109 1,052 873 Volkswagen Financial Services AG 1,259 1,095 1,492 1,786 2,089 2,754 2,041 1,290 WGZ Bank AG Westdeutsche Genossenschafts-Zentralbank 579 443 438 430 391 778 609 445 Wustenrot Bank AG Pfandbriefbank 27 27 15 8 1 102 72 48 Wustenrot Bausparkasse AG 190 190 155 138 133 253 167 110 Estonia AS DNB Bank 58 30 30 32 33 39 37 33 AS SEB Pank 506 486 516 564 611 589 625 657 Swedbank AS 1,300 1,263 1,319 1,384 1,448 1,438 1,498 1,556 Spain Banco Bilbao Vizcaya Argentaria, S.A. (BBVA) 9,479 8,780 7,944 8,693 9,341 14,778 13,818 13,223 Banco de Sabadell, S.A. (Sabadell) 1,812 1,812 1,775 1,766 1,816 3,035 2,704 2,265 Banco Financiero y de Ahorros, S.A. (BFA/Bankia) 2,826 2,742 4,313 5,188 5,940 5,558 5,110 4,763 Banco Mare Nostrum, S.A. 307 217 485 707 722 584 547 531 Banco Popular Espanol, S.A. 2,213 1,738 1,857 2,096 2,484 2,898 2,232 1,756 Bankinter, S.A. 961 875 888 1,044 1,199 1,311 1,299 1,353 Banco Santander, S.A. (Santander) 12,866 12,663 16,632 19,300 21,902 26,042 23,237 19,442 Caja de Ahorros y M.P. de Zaragoza, Aragon y Rioja (Ibercaja) 537 532 616 670 683 1,048 874 640 Caja de Ahorros y Pensiones de Barcelona (La Caixa) 3,890 3,830 4,811 5,469 6,138 7,238 6,571 6,780 MPCA Ronda, Cadiz, Almeria, Malaga, Antequera y Jaen (Unicaja-Ceiss) 1,028 959 1,048 1,168 1,285 1,561 1,371 1,140 Cajas Rurales Unidas, Sociedad Cooperativa de Credito 660 431 493 501 516 840 722 592 Catalunya Banc, S.A. 918 897 743 780 799 878 609 444 Kutxabank, S.A. 1,484 1,454 1,573 1,698 1,829 2,344 2,327 2,279 Liberbank, S.A. 119 -32 111 92 260 190 59 22 NCG Banco, S.A. 584 566 834 1,022 1,264 991 860 814 Finland Danske Bank plc (Finland) 1,103 1,058 1,099 1,146 1,198 1,378 1,325 1,298 Nordea Bank Finland Abp 3,593 3,367 3,634 3,781 3,967 4,147 3,534 3,303 OP-Pohjola Group 3,665 3,394 3,755 3,936 3,997 4,160 3,506 2,952 France Banque Centrale de Compensation (LCH Clearnet) 179 179 179 179 178 162 139 115 Banque PSA Finance 1,155 1,143 1,183 1,184 1,187 1,574 1,530 1,493 BNP Paribas 16,642 15,732 14,715 16,228 16,331 26,138 22,041 17,595 C.R.H. - Caisse de Refinancement de l'Habitat -124 -124 -125 -128 -129 9 5 1 Groupe BPCE 9,509 8,356 8,668 8,883 9,023 13,594 10,202 6,860 Groupe Crédit Agricole 16,168 15,229 17,141 19,800 22,351 25,579 22,348 20,714 Groupe Crédit Mutuel 13,902 13,660 15,286 16,996 18,480 19,319 19,092 18,693 HSBC France 1,555 1,474 1,076 1,128 1,191 1,003 684 463 La Banque Postale 1169 1157 1227 1522 1627 2336 2419 2322 BPI France (Banque Publique d'Investissement) 9,735 9,697 9,703 10,539 11,020 10,547 11,061 11,220 RCI Banque 811 804 885 898 904 1,343 1,063 798 Société de Financement Local 1,002 950 912 907 925 797 749 706 Société Générale 9,913 9,174 9,018 9,032 9,122 14,756 12,625 9,981 Greece Alpha Bank, S.A. 4,071 3,129 3,129 3,064 3,035 3,275 2,404 1,334 Eurobank Ergasias, S.A. 1,000 -71 -573 -1,382 -2,282 -991 -2,603 -4,628 National Bank of Greece, S.A. 1,523 -273 -702 -1,007 -1,278 -1,322 -2,378 -3,433 Piraeus Bank, S.A. 3,393 1,182 1,088 799 617 1,878 672 -600 Ireland Allied Irish Banks plc 4,253 4,047 3,600 3,301 2,734 4,092 2,608 949 Merrill Lynch International Bank Limited 2,830 2,722 2,082 1,610 1,192 2,825 2,162 1,602 Permanent tsb plc. 861 812 586 374 145 665 -17 -855 The Governor and Company of the Bank of Ireland 2,429 2,113 2,423 2,666 2,775 3,252 2,665 2,073 Ulster Bank Ireland Limited 1,381 1,381 1,136 942 785 1,485 847 277 Italy Banca Carige S.P.A. - Cassa di Risparmio di Genova e Imperia -651 -952 -984 -1,180 -1,321 -986 -1,353 -1,835 Banca Monte dei Paschi di Siena S.p.A. 1,825 -843 -1,043 -1,516 -1,215 -700 -2,819 -4,250 Banca Piccolo Credito Valtellinese, Societa Cooperativa 142 -88 -171 -197 -174 137 -102 -377 Banca Popolare Dell'Emilia Romagna - Societa Cooperativa 498 162 197 165 149 617 264 -128 Banca Popolare Di Milano - Societa Cooperativa A Responsabilita Limitata -308 -482 -647 -584 -495 91 -245 -684 Banca Popolare di Sondrio, Societa Cooperativa per Azioni 35 -148 -183 -175 -145 123 -85 -318 Banca Popolare di Vicenza - Societa Cooperativa per Azioni 391 -119 -158 -143 -90 2 -311 -682 Banco Popolare - Societa Cooperativa 1,088 -34 -59 -276 -693 972 345 -427 Credito Emiliano S.p.A. 476 463 480 493 503 692 663 599 Iccrea Holding S.p.A 416 356 385 407 439 455 373 256 Intesa Sanpaolo S.p.A. 11,236 10,548 10,501 9,961 9,419 13,912 11,608 8,724 Mediobanca - Banca di Credito Finanziario S.p.A. 635 205 600 723 724 1,459 928 445 UniCredit S.p.A. 7,213 6,452 6,167 6,188 6,658 12,188 8,073 5,580 Unione Di Banche Italiane Societa Cooperativa Per Azioni 2,704 2,432 2,277 1,999 1,848 3,426 2,676 1,743 Veneto Banca S.C.P.A. -169 -583 -574 -556 -567 -270 -424 -714 Luxembourg Banque et Caisse d'Epargne de l'Etat, Luxembourg 1,263 1,256 1,150 1,239 1,316 1,375 1,337 1,345 Clearstream Banking S.A. 383 383 381 381 381 420 433 426 Precision Capital S.A. (Holding of Banque Internationale a Luxembourg and KBL European Private Bankers S.A.) 583 521 507 461 445 578 437 300 RBC Investor Services Bank S.A. 513 513 459 421 391 476 373 268 State Street Bank Luxembourg S.A. 981 970 1,080 1,208 1,319 1,097 1,113 1,139 UBS (Luxembourg) S.A. 196 196 171 171 142 264 253 174 Latvia ABLV Bank, AS 38 28 29 29 41 59 54 36 AS SEB banka 188 137 135 158 178 196 190 186 Swedbank AS 753 747 746 766 786 821 839 856 Lithuania AB DNB bankas 212 195 195 195 192 231 203 173 AB SEB bankas 325 303 306 324 339 405 390 378 Swedbank AB 512 506 538 557 579 623 642 658 Malta Bank of Valletta plc 117 99 145 174 194 172 158 128 HSBC Bank Malta plc 54 29 36 50 62 98 99 101 Deutsche Bank (Malta) Ltd 2,165 2,165 2,165 2,165 2,164 2,140 2,140 2,140 Netherlands ABN AMRO Bank N.V. 4,884 4,747 5,152 5,782 6,531 6,365 5,353 4,701 Bank Nederlandse Gemeenten N.V. 1,834 1,637 1,621 1,739 1,811 1,744 1,746 1,669 Cooperatieve Centrale Raiffeisen-Boerenleenbank B.A. 10,070 8,460 7,817 7,314 7,097 11,018 8,702 6,982 ING Bank N.V. 7,083 6,236 7,439 9,271 10,938 13,143 11,869 10,847 Nederlandse Waterschapsbank N.V. 1,128 1,094 1,109 1,133 1,156 1,144 1,101 1,026 The Royal Bank of Scotland N.V. 1,451 1,446 1,603 1,396 1,181 1,623 831 434 SNS Bank N.V. 1,112 1,031 1,068 1,136 1,265 1,164 807 228 Portugal Banco BPI, SA 1,580 1,554 1,600 1,583 1,510 1,891 1,671 1,345 Banco Comercial Portugues, SA 1,925 1,028 1,049 699 379 653 -291 -1,137 Caixa Geral de Depositos, SA 1,818 1,537 1,466 1,300 907 2,190 1,328 383 Slovenia Nova Kreditna Banka Maribor d.d. 321 213 200 161 136 166 57 -31 Nova Ljubljanska banka d. d., Ljubljana 588 478 426 387 364 231 104 -34 SID - Slovenska izvozna in razvojna banka, d.d., Ljubljana 237 218 233 249 255 205 177 132 Slovakia Slovenska sporiterna, a.s. 593 549 570 592 612 673 712 689 Vseobecna uverova banka, a.s. 558 542 560 578 590 697 703 694 Tatra banka, a.s. 399 371 383 377 380 453 416 383
Table 14 AQR adjustment by bank and asset class (� million) Name Retail SME Residential real estate Other retail Corporates Other |1| Faire value exposure review |2| Total AQR adjustment Austria BAWAG P.S.K. Bank fur Arbeit und Wirtschaft und Osterreichische Postsparkasse AG3 0 4 0 38 0 0 42 Erste Group Bank AG 3 155 75 1138 0 42 1,413 Raiffeisenlandesbank Oberosterreich AG 24 0 4 284 0 51 363 Raiffeisenlandesbank Niederosterreich-Wien AG 0 0 0 100 0 2 102 Raiffeisen Zentralbank Osterreich AG 84 240 30 371 0 29 753 Osterreichische Volksbanken-AG with credit institutions affiliated according to Article 10 of the CRR 27 56 0 213 0 21 317 Belgium AXA Bank Europe SA 4 4 0 0 0 28 36 Belfius Banque SA 0 2 0 13 0 214 229 Dexia NV 0 0 0 35 44 222 301 Investar (Holding of Argenta Bank- en Verzekeringsgroep) 0 0 0 0 0 12 12 KBC Group NV 0 324 0 229 0 79 631 The Bank of New York Mellon SA 0 0 0 0 0 2 2 Cyprus Bank of Cyprus Public Company Ltd 87 0 153 491 0 4 735 Cooperative Central Bank Ltd 0 0 0 1 0 0 1 Hellenic Bank Public Company Ltd 0 32 0 92 0 0 124 Russian Commercial Bank (Cyprus) Ltd (RCB Bank Ltd) 0 0 0 0 0 0 0 Germany Aareal Bank AG 0 0 0 16 0 0 16 Bayerische Landesbank 0 223 0 433 0 112 768 Commerzbank AG 0 33 269 1190 0 30 1,522 DekaBank Deutsche Girozentrale 0 0 0 4 0 41 44 Deutsche Apotheker- und Arztebank eG 0 14 0 0 0 0 14 Deutsche Bank AG 0 0 0 226 0 94 321 DZ Bank AG Deutsche Zentral-Genossenschaftsbank 0 0 0 162 0 85 247 HASPA Finanzholding 0 0 0 5 0 0 5 HSH Nordbank AG 0 0 0 1433 0 162 1,594 Hypo Real Estate Holding AG 0 0 0 29 0 8 37 1KB Deutsche Industriebank AG 0 0 0 43 0 2 46 KfW IPEX-Bank GmbH 0 0 0 84 4 0 88 Landesbank Baden-Wurttemberg 0 0 0 319 0 160 479 Landesbank Berlin Holding AG 22 0 0 0 0 11 32 Landesbank Hessen-Thuringen Girozentrale 0 0 17 172 0 6 195 Landeskreditbank Baden-Wurttemberg-Forderbank 0 0 0 0 0 0 0 Landwirtschaftliche Rentenbank 0 0 0 0 0 7 7 Munchener Hypothekenbank eG 0 0 0 0 0 0 0 Norddeutsche Landesbank-Girozentrale 0 0 0 817 0 54 872 NRW.Bank 0 0 0 0 0 0 0 SEB AG 0 0 0 27 0 0 27 Volkswagen Financial Services AG 86 0 93 5 0 34 218 WGZ Bank AG Westdeutsche Genossenschafts-Zentralbank 0 0 0 1 0 164 165 Wustenrot Bank AG Pfandbriefbank 0 0 0 0 0 0 0 Wustenrot Bausparkasse AG 0 0 0 0 0 0 0 Estonia AS DNB Bank 0 0 0 28 0 0 28 AS SEB Pank 0 0 0 20 0 0 20 Swedbank AS 0 0 0 37 0 0 37 Spain Banco Bilbao Vizcaya Argentaria, S.A. (BBVA) 0 472 0 493 0 0 965 Banco de Sabadell, S.A. (Sabadell) 0 0 0 0 0 0 0 Banco Financiero y de Ahorros, S.A. (BFA/Bankia) 0 0 32 0 0 79 111 Banco Mare Nostrum, S.A. 0 0 7 118 0 0 125 Banco Popular Espanol, S.A. 201 0 40 374 0 30 645 Bankinter, S.A. 26 0 0 90 0 0 116 Banco Santander, S.A. (Santander) 0 0 0 287 0 0 287 Caja de Ahorros y M.P. de Zaragoza, Aragon y Rioja (Ibercaja) 0 0 0 7 0 0 7 Caja de Ahorros y Pensiones de Barcelona (La Caixa) 0 0 0 78 0 0 78 MPCA Ronda, Cadiz, Almeria, Malaga, Antequera y Jaen (Unicaja-Ceiss) 0 62 0 27 0 4 94 Cajas Rurales Unidas, Sociedad Cooperativa de Credito 177 0 40 81 0 0 298 Catalunya Banc, S.A. 0 0 11 0 0 17 28 Kutxabank, S.A. 0 0 0 41 0 0 41 Liberbank, S.A. 0 47 13 149 0 0 209 NCG Banco, S.A. 0 0 14 2 0 9 25 Finland Danske Bank plc (Finland) 0 0 0 8 0 45 53 Nordea Bank Finland Abp 59 28 0 266 0 77 430 OP-Pohjola Group 17 52 25 152 0 76 322 France Banque Centrale de Compensation (LCH Clearnet) 0 0 0 0 0 0 0 Banque PSA Finance 0 0 0 17 0 0 17 BNP Paribas 0 0 42 720 0 436 1,198 C.R.H. - Caisse de Refinancement de l'Habitat 0 0 0 0 0 0 0 Groupe BPCE 0 0 0 1118 0 399 1,517 Groupe Crédit Agricole 0 0 338 606 0 291 1,236 Groupe Crédit Mutuel 0 0 27 241 0 50 318 HSBC France 23 0 0 69 0 13 105 La Banque Postale 0 0 0 0 0 15 15 BPI France (Banque Publique d'Investissement) 0 0 0 49 0 0 49 RCI Banque 0 0 7 1 0 0 8 Société de Financement Local 0 0 0 0 68 0 68 Société Générale 0 113 191 635 0 117 1,055 Greece Alpha Bank, S.A. 0 281 0 833 0 55 1,169 Eurobank Ergasias, S.A. 73 256 20 928 0 65 1,343 National Bank of Greece, S.A. 382 1093 0 773 0 10 2,257 Piraeus Bank, S.A. 64 477 0 2168 0 83 2,792 Ireland Allied Irish Banks plc 0 0 0 229 0 1 230 Merrill Lynch International Bank Limited 0 0 0 0 0 107 107 Permanent tsb plc. 0 0 0 37 0 17 54 The Governor and Company of the Bank of Ireland 0 0 0 351 0 6 356 Ulster Bank Ireland Limited 0 0 0 0 0 0 0 Italy Banca Carige S.P.A. - Cassa di Risparmio di Genova e Imperia 0 0 0 416 0 0 416 Banca Monte dei Paschi di Siena S.p.A. 0 0 0 4180 0 66 4,246 Banca Piccolo Credito Valtellinese, Societa Cooperativa 0 0 0 329 0 0 329 Banca Popolare Dell'Emilia Romagna - Societa Cooperativa 0 0 0 480 0 1 480 Banca Popolare Di Milano - Societa Cooperativa A Responsabilita Limitata 0 0 0 248 0 1 248 Banca Popolare di Sondrio, Societa Cooperativa per Azioni 0 4 67 203 0 0 274 Banca Popolare di Vicenza - Societa Cooperativa per Azioni 137 0 77 501 0 13 728 Banco Popolare - Societa Cooperativa 440 0 0 1121 0 42 1,603 Credito Emiliano S.p.A. 0 0 20 0 0 0 20 Iccrea Holding S.p.A 0 0 0 82 0 0 82 Intesa Sanpaolo S.p.A. 0 0 0 972 0 1 973 Mediobanca - Banca di Credito Finanziario S.p.A. 4 0 204 406 0 1 615 UniCredit S.p.A. 63 20 0 888 3 54 1,026 Unione Di Banche Italiane Societa Cooperativa Per Azioni 0 0 0 390 0 0 390 Veneto Banca S.C.P.A. 0 98 54 419 0 1 572 Luxembourg Banque et Caisse d'Epargne de l'Etat, Luxembourg 0 0 0 0 0 9 9 Clearstream Banking S.A. 0 0 0 0 0 0 0 Precision Capital S.A. (Holding of Banque Internationale a Luxembourg and KBL European Private Bankers S.A.) 0 0 1 40 0 33 74 RBC Investor Services Bank S.A. 0 0 0 0 0 0 0 State Street Bank Luxembourg S.A. 0 0 0 0 0 12 12 UBS (Luxembourg) S.A. 0 0 0 0 0 0 0 Latvia ABLV Bank, AS 0 3 0 6 0 3 11 AS SEB banka 0 5 2 49 0 1 57 Swedbank AS 0 0 0 4 0 2 6 Lithuania AB DNB bankas 0 0 0 17 0 0 17 AB SEB bankas 0 0 0 19 0 3 22 Swedbank AB 0 0 0 5 0 0 5 Malta Bank of Valletta plc 6 0 7 3 0 0 16 HSBC Bank Malta plc 0 1 2 27 0 0 30 Deutsche Bank (Malta) Ltd 0 0 0 0 0 0 0 Netherlands ABN AMRO Bank N.V. 92 0 0 65 0 16 174 Bank Nederlandse Gemeenten N.V. 0 0 0 34 0 213 247 Cooperatieve Centrale Raiffeisen-Boerenleenbank B.A. 134 159 0 1535 0 266 2,093 ING Bank N.V. 0 146 0 955 0 11 1,112 Nederlandse Waterschapsbank N.V. 0 0 0 0 0 42 42 The Royal Bank of Scotland N.V. 0 0 0 4 0 0 4 SNS Bank N.V. 0 92 0 8 0 1 101 Portugal Banco BPI, SA 0 0 0 31 0 3 34 Banco Comercial Portugues, SA 86 61 26 935 0 55 1,162 Caixa Geral de Depositos, SA 0 0 20 350 0 0 370 Slovenia Nova Kreditna Banka Maribor d.d. 0 7 5 82 0 14 108 Nova Ljubljanska banka d. d., Ljubljana 0 0 0 102 0 8 110 SID - Slovenska izvozna in razvojna banka, d.d., Ljubljana 0 0 0 19 3 0 22 Slovakia Slovenska sporiterna, a.s. 3 0 0 50 0 0 54 Vseobecna uverova banka, a.s. 0 12 0 7 0 1 20 Tatra banka, a.s. 0 0 0 33 0 1 34 1. Other includes debtors from the asset classes sovereigns and supranational non-governmental organisations, institutions and other assets.
2. Note that the fair value exposure review does not follow the AQR asset segmentation.
9.3 LIST OF ACRONYMS AND ABBREVIATIONS
Note the below country codes used throughout the report:
Countries and codes used in the report Austria - AT Germany - DE Poland - PL Belgium - BE Greece - GR Portugal - PT Brazil - BR Hungary - HU Romania - RO Bulgaria - BG Ireland - IE Russia - RU Chile - CL Italy - IT Slovakia - SK Croatia - HR Latvia - LV Slovenia - SI Cyprus - CY Lithuania - LT Spain - ES Czech Republic - CZ Luxembourg - LU Sweden - SE Denmark - DK Malta - MT Turkey - TR Estonia - EE Mexico - MX United Kingdom - UK Finland - FI Netherlands - NL United States - US France - FR Norway - NO Other acronyms and abbreviations used in this document:
Term Description A AFS Available for sale AQR Asset quality review AT1 Additional Tier 1 B Basel III Third Basel accord bps Basis points C CA Comprehensive assessment CCAR Comprehensive Capital Analysis and Review CEBS Committee of European Banking Supervisors CET1 Common Equity Tier 1 CET1 ratio Common Equity Tier 1 ratio CFR Credit file review CPMO Central Project Management Office CRD Capital Requirements Directive CRE Commercial real estate CRR Capital Requirements Regulation cRWA Credit risk-weighted assets CSA Credit Support Annex CT1 Core Tier 1 D DG-COMP Directorate General of Competition DIV Data integrity validation DTA Deferred tax asset E EBA European Banking Authority EBITDA Earnings before interest, taxes, depreciation and amortisation ECB European Central Bank ESRB European Systemic Risk Board F FAQ Frequently asked question FVO Fair value option FX Foreign exchange G GDP Gross Domestic Product G-SIB Global systemically important banks H HFT Held-for-trading I IAS International Accounting Standards IBNR Incurred but not reported IFRS International Financial Reporting Standards IRB Internal Ratings Based ISA International Standards on Auditing ITS Implementing Technical Standards J JST Joint Supervisory Team L LGD Loss given default LGI Loss given impairment LGL Loss given loss LIBOR London Interbank Offered Rate N NCA National competent authority |1| nGAAP National Generally Accepted Accounting Principles NPE Non-performing exposure P P&L Profit and loss statement PD Probability of default - may refer to either the point-in-time or regulatory parameter PE Performing PI Probability of impairment PP&A Processes, policies and accounting review PV Present value Q QA Quality assurance QAA Quality assurance adjustment R RAG Red, Amber, Green RRE Residential real estate RWA Risk-weighted assets S SME Small and medium enterprise SREP Supervisory Review and Evaluation Process SSM Single Supervisory Mechanism ST Stress test 1. Some participating Member States also had a national central bank involved in the comprehensive assessment.
9.5 GEOGRAPHIC CLUSTERS USED FOR ANALYSIS OF COLLATERAL VALUE ADJUSTMENTS
Geography Cluster Countries included in the cluster Americas Chile, Mexico, the United States of America Central Europe Austria, Belgium, Switzerland, Germany, France, Luxembourg, Monaco, the Netherlands Eastern Europe Albania, Bulgaria, Czech Republic, Croatia, Hungary, Montenegro, Poland, Romania, Russia, Slovenia, Slovakia, Serbia Mediterranean Cyprus, Spain, Greece, Italy, Malta, Portugal, Turkey Other Angola, Denmark, Estonia, Finland, Lithuania, Latvia, Sweden, Sierra Leone UK & Ireland The United Kingdom, the Republic of Ireland [Source: European Central Bank, Frankfurt am Main, 26Oct14]
Notas:
1. The difference between this number and the initially reported figure of 128 is explained in Section 3.1. [Volver]
2. Not all banks that took part in the comprehensive assessment will be supervised by the ECB directly. This is explained in further detail in Appendix 9.1. [Volver]
3. As of 31 December 2013. [Volver]
4. See Appendix 9.4 for further details. [Volver]
5. See Section 3.3.2 for a more detailed discussion. [Volver]
6. Dodd Frank Act Stress Test severely adverse scenario. The median CET1 ratio reduction of the 2013 exercise was 2.9%. [Volver]
7. Due to low number of participating banks this figure is a weighted average. [Volver]
8. Exercise occurred on the basis of a lower initial capital base than the current exercise. [Volver]
9. 8% of CET1 in the baseline scenario and AQR, 5.5% of CET1 in the adverse scenario. [Volver]
10. To 30 September 2014. [Volver]
11. Banca Piccolo Credito Valtellinese, Societa Cooperativa ('Credito Valtellinese') is considered a less significant institution and will be indirectly supervised by the ECB under the SSM. Further information on less significant institutions can be found in Section 3.1.1 and in Appendix 9.1. [Volver]
12. Note that some banks have raised more than their identified capital shortfall, explaining the divergence between the delta in shortfalls pre and post capital raising and the total capital raised by shortfall banks since January 2014 which is �18.6 billion. [Volver]
13. Eurobank has practically no shortfall and National Bank of Greece has no shortfall. [Volver]
14. EBA harmonised approach for the phase-in is 2014-20%, 2015-40%, 2016-60%. [Volver]
15. See Appendix 9.4 for further details. [Volver]
16. The difference between the banks that participated in the comprehensive assessment and the list of significant banks that will be supervised directly by the ECB is explained in Section 3.1.1. [Volver]
17. See Appendix 9.4 for further details. [Volver]
18. See Section 3.2 for further details. [Volver]
19. See further details in Appendix 9.1. [Volver]
20. The AQR Phase 2 Manual, further details in Appendix 9.4. [Volver]
21. For example, 8% of the provision increase across the SSM driven by the credit file review was reported as specifically deriving from misalignment with accounting standards. [Volver]
22. As of 31 December 2013. [Volver]
23. Risk-weighted assets (RWA) is a measure of a bank's total assets and off-balance sheet exposures weighted by their associated risk. Credit risk-weighted assets (cRWA) refers to the part of RWA due to credit risk and does not include RWA arising due to other risks, such as market risk or operational risk. [Volver]
24. Defined by both size and level of portfolio granularity - individually more than 2% of the bank's cRWA and of the correct granularity (sovereign, supra-national, retail SME, retail other, residential real estate, state-owned enterprises, shipping, aviation, project finance, corporate real estate-related, large corporate, large SME, and securitisations). [Volver]
25. Further details on the AQR Phase 2 Manual, the EBA stress test methodology, and the ECB stress test methodology can be found in Appendix 9.4. [Volver]
26. Except for Wustenrot & Wurttembergische AG, as explained below under "Additions and withdrawals". [Volver]
27. The EBA EU-wide stress test exercise was conducted on a sample of 123 EU banks, covering at least 50% of each national banking sector. [Volver]
28. Note that new defaults during the scenario can change e.g. NPE stock and product mix. [Volver]
29. As listed in the Note on the comprehensive assessment of October 2013, and the ECB Decision of 4 February 2014 identifying the credit institutions that are subject to the comprehensive assessment (ECB/2014/3). Further details are in Appendix 9.4. [Volver]
30. The ECB will also supervise directly a number of entities not included in the comprehensive assessment. Further details in Appendix 9.1. [Volver]
31. See Appendix 9.4 for further details. [Volver]
32. In order for a portfolio to be material, it had to individually account for more than 2% of the bank's cRWA and it had to be defined at the correct level of granularity, i.e. be defined as one of the following asset classes within a single country exposure: sovereign, supra-national, retail SME, retail other, residential real estate, state-owned enterprises, shipping, aviation, project finance, real estate related, large corporates, large SME, Securitisations. [Volver]
33. A total of seven significant banks which had immaterial levels of accrual accounted assets with appreciable misstatement risk were excluded from further elements of the AQR following the PP&A review. These institutions are noted in the Appendix. [Volver]
34. In addition, expected future losses on files where loss is more likely than not but no loss event trigger has been met were projected. However, the projection of this metric had a very low impact and will be disregarded in the remainder of the report. [Volver]
35. Provisions set aside for future expected losses on currently performing debtors. [Volver]
36. International Accounting Standards. [Volver]
37. National Generally Accepted Accounting Principles. [Volver]
38. See Appendix 9.4 for further details. [Volver]
39. Selection was modified with respect to the list of banks included in the Note on the comprehensive assessment of February 2014, to reflect: a) selection from participating banks which hold level 3 assets in the banking book added; b) inclusion of the review of accrual accounted foreclosed real estate held on the balance sheet (even when not classified as FVO, or level 3); c) portfolios initially selected were excluded from further review if the banks could show that they held their positions "back-to-back" (i.e. if banks could prove that their positions were perfectly matched); d) inclusions as a result of deficiencies in the fair value hierarchy identified in the processes, policies & accounting review during the AQR. [Volver]
40. As a memo item, the fully implemented CRR/CRD IV definition of CET1 capital (including 60% of unrealised gains/losses from sovereign exposures in the AFS portfolio) is included in the disclosure of the stress test outcome. [Volver]
41. The description of the risks is an extract of the Methodological note on the EU-wide stress test 2014 as published by the EBA on 29 April. Further details are in Appendix 9.4. [Volver]
42. Note that in some jurisdictions (Spain, Italy and, from 2015 onwards, Portugal) due to change in tax legislation, some DTAs are no longer reliant on future profitability, and therefore the auditor allowable amount restriction was not applied. [Volver]
43. See Appendix 9.4 for further details. [Volver]
44. See the description published on the EBA website on 29 April 2014. Further details in Appendix 9.4. [Volver]
45. The documentation for the adverse scenario was published on the EBA website on 29 April 2014. See Appendix 9.4 for further details. [Volver]
46. Committee of European Banking Supervisors. [Volver]
47. Comprehensive Capital Analysis and Review, an analogous exercise in the United States. [Volver]
48. See Appendix 9.4 for further details. [Volver]
49. Lithuania started the exercise late and the quality assurance was conducted centrally. [Volver]
50. ECB asset quality review Phase 2 Manual (March 2014). [Volver]
51. See Appendix 9.4 for further details. [Volver]
52. The ECB was responsible for the quality assurance of euro area countries. See Appendix 9.4 for further details. [Volver]
53. "RAG" refers to red / amber / green and is explained in more detail below. [Volver]
54. See Appendix 9.4 for further details. [Volver]
55. See Appendix 9.4 for further details. [Volver]
56. The specific tests are outlined in the comprehensive assessment stress test Manual (August 2014), under section 1.1 to 1.7. See Appendix 9.4 for further details. [Volver]
57. One meeting was held for Wustenrot Bank AG Pfandbriefbank and Wustenrot Bausparkasse AG. [Volver]
58. Amounting to circa � 995 billion. [Volver]
59. Technically part of the shortfall is solely from the AQR and baseline scenario, using 2013 and 2014-2016 RWA, respectively. [Volver]
60. See Chapter 8 for a discussion of capital actions undertaken by banks, including those with a shortfall. [Volver]
61. See Appendix 9.4 for further details. [Volver]
62. Further information can be found on pages 46-47 of the AQR Manual. See Appendix 9.4 for further details. [Volver]
63. Material is defined as per Article 178 of the CRR and respects national materiality thresholds. [Volver]
64. The simplified EBA ITS approach differs from the full EBA ITS definition mostly with regard to forbearance marking. As, at the beginning of the exercise, participating banks had not fully adopted these new guidelines, the application of the full EBA ITS definition was technically not feasible. Note, however, that forborne NPE as defined in the EBA ITS was used as a minimum impairment trigger in the AQR. Through this route the two definitions (EBA ITS and simplified EBA ITS) are similar for those asset classes in which a credit file review was performed. [Volver]
65. While the application of this definition constitutes a very important leap forward in terms of harmonisation across the euro area banking sector, the degree of harmonisation reached is not completely perfect due to factors such as different materiality thresholds across Member States. However, a solid basis of consistency has been implemented for the comprehensive assessment, implying a very significant improvement in comparability across banks from different jurisdictions. [Volver]
66. There is also a �13.8 billion tax and risk offset as shown in Figure 28; risk offsets are protection schemes insuring a bank against losses. [Volver]
67. Sovereign exposures are excluded from the collective provisioning assessment, and non-performing non-retail debtors, for which no impairment test was conducted and that are not covered by collateral, are also subject to collective provisioning for the purpose of calculating IBNR. [Volver]
68. The comprehensive assessment was conducted on the highest level of consolidation of each entity subject to the assessment. In a very small number of cases an entity subject to the assessment was a consolidated subsidiary of another entity subject to the exercise. Hence, in these few cases, portfolios of the subsidiary are included in both the subsidiaries' and the parent's results. This creates small but immaterial double counting. In the case of the AQR-adjustment to asset carrying values, for instance, this effect is an estimated 0.2% of the total adjustment. [Volver]
69. These 119,120 debtors underwent a classification review; 85,857 of these debtors, of which 40,518 were NPE, were included in the detailed provisioning review. The remaining 33,263 debtors that were excluded from the provisioning review were retail debtors and only subject to the reclassification review. [Volver]
70. This represents the final credit file review impact which is factored into the final AQR-adjusted CET1 ratio for each bank. The netting impact described in Section 3.3.1 means overall portfolio provisions cannot decrease as a result of the AQR. Therefore, the individual components discussed in the rest of this section for the credit file review do not reconcile with this total increase in provisions. [Volver]
71. The components do not add to �6.6 billion due to rounding. [Volver]
72. The components do not add to �8.1 billion due to rounding. [Volver]
73. As opposed to exposures that were collectively provisioned as outlined in Section 6.1.7. [Volver]
74. For the remaining 145 reclassified debtors no provisioning approach was reported. [Volver]
75. For the remaining 2,132 existing NPEs no provisioning approach was reported. [Volver]
76. Where no pre-AQR valuation was submitted, the decrease was set to zero. [Volver]
77. "Location of collateral" refers to the physical location of the collateral and may deviate from the "country of participating bank" and the "debtor geography"; the countries in each grouping can be found in Appendix 9.5.2 [Volver]
78. Marginal increases in provisions for Finland and France are not shown. [Volver]
79. Non-performing non-retail debtors for which no impairment test was conducted and that are not covered by collateral are also subject to collective provisioning for the purpose of calculating IBNR [Volver]
80. Sovereign debtors are excluded from the collective provisioning work block [Volver]
81. If the NCA bank team's estimate was 5-10% higher than the bank's but the bank team felt there were good reasons for this relating to data or methodology, it was not investigated further. If it was more than 10%, the NCA bank team investigated the bank's model and data. [Volver]
82. Note that the review also includes fair value assets classified as level 1 and level 2, whenever the classification was questioned as a result of the processes, policies and accounting review, as well as accrual accounted real estate held in the balance sheet. All derivative positions are included in the CVA analysis, irrespective of their accounting classification. Note that fair value is used throughout to include the following accounting classifications: AFS, HFT and FVO. [Volver]
83. Level 3 positions are classified as such when the parameters used to calculate prices are not directly observable in the market. Therefore, the valuation of such assets is inherently more complex. Note that disclosure requirements of level 3 assets are stricter than those for level 1 and level 2 assets. [Volver]
84. Note that for cases when the AQR adjustment exceeded 10% of the original value for the sampled positions, this triggered the obligation to perform a review of the whole portfolio before October 2015. [Volver]
85. Note that the difference between the AQR adjustment and the CET1 capital impact before tax and risk offsets stems from the application of AFS prudential filters in 2014 [Volver]
86. Also, note that if it is appropriate to use unadjusted market quotes, then the classification of the asset as level 3 should be reassessed. [Volver]
87. The vast majority of positions in-scope for independent revaluation were priced using cashflow discounting methodologies, both by the banks and by the entities that performed the independent revaluations in the AQR. [Volver]
88. Whenever the valuation was based on a similar position for which pricing inputs were available. [Volver]
89. The majority of positions were valued using a market-consistent "multiples based" approach. [Volver]
90. These displayed different levels of sophistication ranging from full simulation of waterfall structure to use of very simplified average proxies. [Volver]
91. Defined as having a total trading book greater than �10 billion at December 2013. [Volver]
92. As discussed in Chapter 3. [Volver]
93. With an exception for banks subject to the dynamic balance sheet for whom expenses are allowed to fall below 2013 levels. [Volver]
94. As discussed in Chapter 3. [Volver]
95. The join-up was only considered in those cases where AQR findings suggested that banks had materially misclassified their loans, where materiality was based on pre-defined thresholds; see also the ECB stress test methodology in Chapter 3.2.2. [Volver]
96. As a matter of principle, adjustments due to the AQR on banks' stress test credit risk parameters can go both ways depending on whether the "portfolio improvement effect" (i.e. reflecting that reclassifications from PE to NPE will tend to increase the average quality of the remaining non-defaulted portfolio) or the "new information effect" (i.e. reflecting the fact that if the AQR found that banks systematically misclassified portfolios in the past, this would also require an adjustment to the forward-looking credit risk projections). See ECB stress test methodology for further information. [Volver]
97. See also ECB stress test methodology, p. 69 72. [Volver]
98. For this time frame it can thus be said that capital in excess of �200 billion has been raised across all participating banks. [Volver]
99. Based on constant pre-AQR December 2013 RWA. [Volver]
100. Note that the conditions discussed in the box above for eligible actions for covering shortfalls apply to all participating banks. [Volver]
101. This discussion contains extracts from EBA documentation and CRR regulation. [Volver]
102. See the module for leverage ratio in Commission implementing Regulation (EU) No 680/2014 of 16 April 2014 laying down implementing technical standards with regard to supervisory reporting of institutions according to Article 99 of CRR, OJ L 191, 28.6.2014, p. 1-1861. [Volver]
103. Leverage ratio as at December 2013, incorporating all quantitative AQR adjustments to capital. Leverage ratio definition based on CRR Article 429 as of September 2014. It does not incorporate the 2014 revision of the leverage ratio by the Basel Committee on Banking Supervision [Volver]
104. EBA harmonised approach includes 20% of unrealised losses in 2014, 40% in 2015 and 60% in 2016. This approach has also been applied to the starting point CET1 ratio for the AQR. [Volver]
105. It should be noted that the transitional adjustments shown for Greece do not take into account the effect of changes in national law related to the treatment of deferred tax assets which took place in 2014. For Portugal this is taken into account only for the stress test scenarios. See next section for details. [Volver]
106. On 19 December 2013, the EBA provided technical advice to the European Commission on possible treatments of unrealised gains measured at fair value under Article 80 of the Capital Requirements Regulation (CRR).The EBA still sees merit in recommending the introduction of prudential filters for unrealised gains. [Volver]
107. It should be noted that the transitional adjustments shown for Greek and Portuguese banks do not take into account the effect of changes in national law related to the treatment of deferred tax assets which took place in 2014. [Volver]
108. This permission does not form part of the transitional arrangements provided for in CRR part ten and is permanently applicable. [Volver]
109. Opinion of the European Central Bank on Deferred Tax Assets, 3 September 2014, CON/2014/66. See Appendix 9.4 for further details. [Volver]
110. As per the Financial Stability Board. See Appendix 9.4 for further details. [Volver]
111. SID-Slovenska izvozna in razvojna banka, d.d., Ljubljana (SID-Slovenska) has not been included on the list of significant or less significant institutions under the umbrella of the SSM from 4 November 2014, based on the following:
- Article 1 second paragraph of Council Regulation (EU) No 1024/2013 ("SSM Regulation") states that the institutions referred to in article 2(5) of the Directive 2013/36/EU on access to the activity of credit institutions and the prudential supervision of credit institutions and investments firms are excluded from the supervisory tasks conferred on ECB in accordance to Article 4 of this Regulation (the so-called "CRD IV").
- SID-Slovenska is explicitly excluded for the scope of CRD IV according to Article 2.5. (20) of CRD IV. [Volver]
112. Banco de Credito Social Cooperativo is the parent company of Grupo Cajamar (Cajas Rurales Unidas, Sociedad Cooperativa de Credito) and Banesco Holding Hispania is the parent company of Abanca-NCG. Both Grupo Cajamar and Abanca-NCG have participated in the comprehensive assessment. [Volver]
 | This document has been published on 19Nov14 by the Equipo Nizkor and Derechos Human Rights. In accordance with Title 17 U.S.C. Section 107, this material is distributed without profit to those who have expressed a prior interest in receiving the included information for research and educational purposes. |