| Information |  | |
Derechos | Equipo Nizkor
| ||
| Information | | |
Derechos | Equipo Nizkor
| ||
09Feb17
See updated versions: 23Jan18 - 02Apr18
China-U.S. Trade Issues
Back to topContents
Introduction
Most Recent Developments
U.S. Trade with ChinaU.S. Merchandise Exports to China
Major U.S. Merchandise Imports from China
Trade in Services
The U.S. Merchandise Trade Deficit with China
The Transfer of Pacific Rim Production to China by Multinational Firms
China as a Major Center for Global Supply Chains
Jobs and TradeU.S.-China Investment Ties: Overview
Chinese "State Capitalism" New Restrictions on Information and Communications Technology
Intellectual Property Rights (IPR) Issues China's Obligations in the World Trade Organization China's Currency PolicyThe U.S.-China Strategic and Economic Dialogue
Concluding ObservationsFigures
Figure 1. Top 5 U.S. Merchandise Export Markets in 2016
Figure 2. Major Sources of U.S. Merchandise Imports: 2016
Figure 3. Major U.S. Services Trading Partners in 2015
Figure 4. U.S. Merchandise Trade Balance with China: 2000-2016
Figure 5. Five Largest U.S. Merchandise Trade Imbalances in 2016
Figure 6. U.S. Manufactured Imports from Pacific Rim Countries as a Percentage of Total U.S. Manufactured Imports: 1990, 2000, and 2015
Figure 7. U.S. Manufactured Imports from China and Japan as a Percentage of U.S. Total: 1999-2015 (%)
Figure 8. U.S. Computer Imports from China as a Percentage of Total U.S. Computer Imports: 2000-2015
Figure 9. Estimated Percentage Foreign Value-Added to China's Exports in 2011
Figure 10. Top Five Country Sources of Facilities that Supply Apple Corporation in 2015
Figure 11. China's Holdings of U.S. Treasury Securities: 2002-November 2016
Figure 12. BEA and Rhodium Group Estimates of the Stock of U.S.-China FDI through 2015
Figure 13. BEA and Rhodium Group Data on Annual U.S. FDI Flows to China: 2005-2015
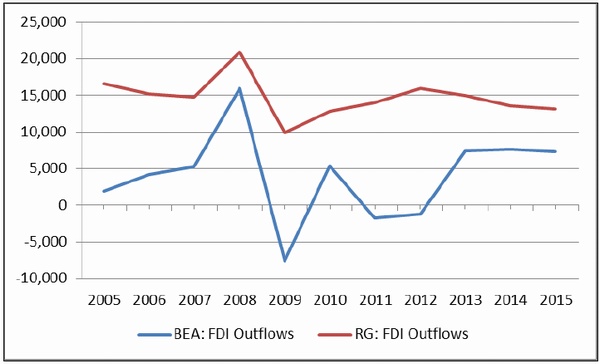
Figure 14. BEA and Rhodium Group Data on Chinese FDI Flows to the United States: 2005-2015
Figure 15. RMB-Dollar Exchange Rates: January 2015 to December 2016
Figure B-1. Current MFN Duty Levels on Products Covered in ITA-2
Figure B-2. ITA-2 Tariff Phase-out Schedule for Major MembersTables
Table 1. U.S. Merchandise Trade with China: 1980-2016
Table 2. Major U.S. Exports to China in 2016
Table 3. Major U.S. Merchandise Export Markets: 2001-2016
Table 4. Major U.S. Merchandise Imports From China in 2016
Table 5. China's Holdings of U.S. Treasury Securities: 2002-November 2016
Table 6. Summary of BEA Data on U.S.-China FDI Flows: 2015
Table 7. Top 20 Chinese Companies on Fortune's Global 500 in 2016
Table 8. Summaries of WTO U.S. Dispute Settlement Cases Against ChinaAppendixes
Appendix A. Chinese Policies to Boost Innovation
Appendix B. Plurilateral Agreements
Appendix C. S&ED Outcomes
Summary
U.S.-China economic ties have expanded substantially over the past three decades. Total U.S.China merchandise trade rose from $2 billion in 1979 (when economic reforms began) to $579 billion in 2016. China is currently the United States' second-largest merchandise trading partner, its third-largest export market, and its biggest source of imports. According to one source, China is a $400 billion market for U.S. firms when U.S. services exports to China, sales by U.S. foreign affiliates in China, and re-exports of U.S. products through Hong Kong to China are factored in. Many U.S. firms view participation in China's market as critical to staying globally competitive. General Motors (GM), for example, which has invested heavily in China, sold more cars in China than in the United States each year from 2010 to 2016. In addition, U.S. imports of lower-cost goods from China greatly benefit U.S. consumers, and U.S. firms that use China as the final point of assembly for their products, or use Chinese-made inputs for production in the United States, are able to lower costs. China is the second-largest foreign holder of U.S. Treasury securities ($1.0 trillion as of November 2016), and its purchases of U.S. government debt help keep U.S. interest rates low.
Despite growing commercial ties, the bilateral economic relationship has become increasingly complex and often fraught with tension. From the U.S. perspective, many trade tensions stem from China's incomplete transition to a free market economy. While China has significantly liberalized its economic and trade regimes over the past three decades, it continues to maintain (or has recently imposed) a number of state-directed policies that appear to distort trade and investment flows. Major areas of concern expressed by U.S. policymakers and stakeholders include China's alleged widespread cyber economic espionage against U.S. firms; relatively ineffective record of enforcing intellectual property rights (IPR); discriminatory innovation policies; mixed record on implementing its World Trade Organization (WTO) obligations; extensive use of industrial policies (such as financial support of state-owned firms and trade and investment barriers) in order to promote and protect industries favored by the government; and interventionist policies to influence the value of its currency. Many U.S. policymakers argue that such policies adversely impact U.S. economic interests and have contributed to U.S. job losses.
There are different views on how the United States could better address commercial disputes with China. Trump Administration officials contend that the United States should take a more aggressive stance against China's trade policies, such as by increasing the number of U.S. WTO dispute settlement cases brought against China, expanding the use of U.S. trade remedy laws on certain imports from China, designating it as a "currency manipulator" and/or threatening to impose sanctions against China unless it addresses various policies, such as cyber theft of U.S. business trade secrets, that hurt U.S. economic interests. Others contend that U.S. trade policy toward China should focus on intensifying and broadening ongoing bilateral dialogues and trade negotiations, such as the U.S.-China Strategic and Economic Dialogue (S&ED), which was established in part to discuss global and bilateral economic and trade issues. Another objective often cited is to complete ongoing bilateral and plurilateral negotiations involving China that would produce agreements expanding market access in China, including a U.S.-China bilateral investment treaty (BIT), China's accession to the WTO's Procurement Agreement (GPA), and a WTO plurilateral environment goods agreement (EGA).
This report provides background and analysis of U.S.-China commercial ties, including history, trends, issues, and outlook.
Introduction
Economic and trade reforms begun in 1979 have helped transform China into one of the world's fastest-growing economies. China's economic growth and trade liberalization, including comprehensive trade commitments made upon its entry to the World Trade Organization (WTO) in 2001, have led to a sharp expansion in U.S.-China commercial ties. Yet, bilateral trade relations have become increasingly strained in recent years over a number of issues, including a large and growing U.S. trade deficit with China, resistance by China to appreciate its currency to market levels, China's mixed record on implementing its WTO obligations, infringement of U.S. intellectual property (including through cyber theft of U.S. trade secrets), and numerous Chinese industrial policies that appear to impose new restrictions on foreign firms or provide unfair advantages to domestic Chinese firms (such as subsidies). As a presidential candidate, Donald Trump pledged to take a tougher stance against China to induce it to eliminate trade and economic policies deemed harmful to U.S. economic interests and/or inconsistent with WTO rules. This report provides an overview of U.S.-China commercial relations, including major trade disputes.
Most Recent Developments
U.S.-China commercial ties are increasingly complex and at times contentious, as reflected in the recent developments summarized below.
- On January 12, 2017, the U.S. Trade Representative (USTR) announced that it had filed a WTO dispute settlement case against China over subsidies given to certain Chinese aluminum producers.
- On January 6, 2017, the President's Council of Advisors on Science and Technology issued a report on U.S. semiconductor innovation, competitiveness, and security, which warned that a "concerted push by China to reshape the market in its favor, using industrial policies backed by over one hundred billion dollars in government-directed funds, threatens the competitiveness of U.S. industry and the national and global benefits it brings." |1|
- On December 15, 2016, the USTR announced that it had initiated a WTO dispute settlement case against China over its administration of tariff-rate quotas (TRQs) for rice, wheat, and corn.
- On December 12, 2016, China initiated a WTO dispute resolution case against the United States (as well as the European Union) over its continued treatment of China as a non-market economy for the purposes of calculating and applying antidumping measures.
- From November 21-23, 2016, the 27th session of the U.S.-China Joint Commission on Commerce and Trade (JCCT) was held in Washington, DC. Several Chinese trade policies were discussed, including market access for agricultural products (including biotech approvals), indigenous innovation policies, pharmaceutical and medical device market access, semiconductor policies, overcapacity in China's steel and aluminum industries, competition policies, and IPR protection.
- A report by the U.S. Chamber of Commerce released on November 11, 2016, estimated that U.S. agricultural exports to China could increase by an additional $17.6 billion (or 40%) from 2016 to 2025 if Chinese agricultural trade barriers were eliminated.
- On September 13, 2016, the United States initiated a WTO dispute settlement case against China over its use of excessive domestic subsidies for rice, wheat, and corn.
- On September 3, 2016, President Obama held a bilateral meeting with Chinese President Xi a day before the start of the G-20 summit in Hangzhou, China. They discussed a number of global, regional, and bilateral subjects, including cybersecurity. At the G-20 summit, major topics included excess capacity in steel and other industries, currency policy, the environmental goods agreement, international cooperation on taxation and corruption, and promoting innovation and the digital economy.
- On August 10, 2016, an international coalition of 46 business groups sent a letter to Chinese Premier Li Keqiang calling on China to address growing concerns over its growing restrictive policies on foreign technology, especially information communications technology.
- At the WTO's Council on Trade in Goods held on July 14, 2016, China requested all WTO members to extend it market economy status (MES) for the purposes of antidumping measures by December 11, 2016, arguing that its 2001 WTO protocol of accession included a provision mandating this change. The United States responded by asserting that the cited WTO provision does not automatically grant China MES, but rather, that status should be determined by the "facts on the ground" relative to each WTO member's domestic laws and rules for making such an assessment.
- On July 13, 2016, the United States initiated a WTO dispute settlement case against China over its export duties on 15 different raw materials.
- From June 5 to 7, 2016, the United States and China held their 8th round of talks under the U.S.-China Security and Economic Dialogue (S&ED).
- On June 2, 2016, the United States at the WTO Committee on Trade-Related Investment Measures urged China to delay or suspend draft regulations that would require insurance companies operating in China to use information and communication technology (ICT) products that have been deemed by the government to be "secure and controllable."
U.S. Trade with China |2|
U.S.-China trade rose rapidly after the two nations reestablished diplomatic relations in January 1979, signed a bilateral trade agreement in July 1979, and provided mutual most-favored-nation (MFN) treatment beginning in 1980. |3| In that year (which was shortly after China's economic reforms began), total U.S.-China trade (exports plus imports) was approximately $4 billion; China ranked as the United States' 24rd-largest trading partner, 16th-largest export market, and 36th-largest source of imports. In 2016, total U.S. total merchandise trade with China was $579 billion, making China the United States' largest trading partner (see Table 1). The U.S.-China Business Council estimates that China is a $400 billion market for U.S. firms, based on U.S. merchandise and services exports to China, re-exports of U.S. goods from Hong Kong to China, and sales by U.S. affiliates in China.
Table 1. U.S. Merchandise Trade with China: 1980-2016
($ in billions)
Year U.S. Exports U.S. Imports U.S. Trade Balance 1980 3.8 1.1 +2.7 1990 4.8 15.2 -10.4 2000 16.3 100.1 -83.8 2010 91.9 365.0 -273.0 201 1 104.1 399.4 -295.3 2012 1 10.5 425.6 -315.1 2013 121.7 440.4 -318.7 2014 123.6 468.5 -344.9 2015 1 16.1 483.2 -367.2 2016 1 15.8 462.8 -347.0 Source: U.S. International Trade Commission (USITC) DataWeb.
U.S. Merchandise Exports to China
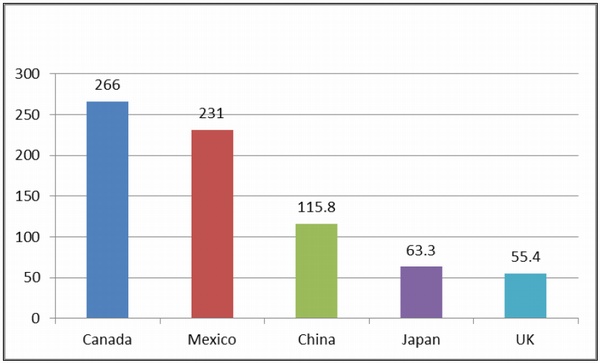
U.S. merchandise exports to China in 2016 were $115.8 billion, down 0.3% over the previous year (they fell by 6.1% in 2015), due in part to the effects of a slowing Chinese economy. |4| In 2016, China was the third-largest U.S. merchandise export market after Canada and Mexico (see Figure 1). From 2000 to 2016, the share of total U.S. merchandise exports going to China rose from 2.1% to 8.0%. As indicated in Table 2, the top five merchandise U.S. exports to China in 2016 were (1) oil seeds and grains (mainly soybeans); (2) aerospace products (mainly civilian aircraft and parts); (3) motor vehicles; (4) semiconductors and electronic components; and (5) navigational, measuring, medical, and controlling instruments. As indicated in Table 3, from 2001 to 2016, U.S. exports to China increased by 511%, which was by far the fastest growth rate for U.S. exports to any of its top 10 export markets. China was the second-largest U.S. agricultural export market in 2016 at $21.4 billion, two-thirds of which consisted of soybeans.
Figure 1. Top 5 U.S. Merchandise Export Markets in 2016
($ in billions)
Source: USITC Dataweb.
Table 2. Major U.S. Exports to China in 2016
($millions and percentage change)
NAIC Number NAIC Description (4-digit level) 2014 2015 2016 Percent Change 2015-2016 1111 OILSEEDS & GRAINS 16,285 13,034 15,533 19.2% 3364 AROSPACE PRODUCTS & PARTS 13,932 15,445 14,578 -5.6% 3361 MOTOR VEHICLES 1 1,248 9,224 8,942 -3.1% 3344 SEMICONDUCTORS & OTHER ELECTRONIC COMPONENTS 6,453 6,925 6,892 -0.5% 3345 NAVIGATIONAL, MEASURING, MEDICAL, AND CONTROL INSTRUMENTS 5,442 5,459 5,525 1.2% 9100 WASTE AND SCRAP 7,088 5,945 5,172 -13.0% 3251 BASIC CHEMICALS 4,486 4,548 4,592 1.0% 3252 RESIN, SYN RUBBER, ARTF & SYN FIBERS/FIL 4,298 3,738 3,564 -4.6% 3339 OTHER GENERAL PURPOSE MACHINERY 3,385 3,106 3,001 -3.4% 3254 PHARMACEUTICALS & MEDICINES 2,206 2,510 2,702 7.6% Total 123,621 116,072 115,775 -0.3% Source: NAIC Description (4-digit level)
Notes: NAIC is the North American Industrial Classification system.Table 3. Major U.S. Merchandise Export Markets: 2001-2016
($billions and percentage change)
Country 2001 2016 Percent Change 2016/2001 Canada 164 266 62.2% Mexico 102 231 126.5% China 19 116 510.5% Japan 58 64 10.3% United Kingdom 41 55 34.1% Germany 30 49 63.3% South Korea 22 42 90.9% Netherlands 20 40 100.0% Hong Kong 14 35 150.0% Belgium 14 32 128.6% Total 731 1,454 98.9% Source: USITC DataWeb and Global Trade Atlas.
Note: Ranked according to the top 10 U.S. merchandise export markets in 2016.Many trade analysts argue that China could prove to be a much more significant market for U.S. exports in the future. China is one of the world's fastest-growing economies, and healthy economic growth is projected to continue in the years ahead, provided that it implements new comprehensive economic reforms. China's goals of modernizing its infrastructure, rebalancing the economy, upgrading industries, boosting the services sector, and enhancing the social safety net could generate substantial new demand for foreign goods and services. Economic growth has substantially improved the purchasing power of Chinese citizens, especially those living in urban areas along the east coast of China. In addition, China's large foreign exchange reserves (at $3.0 trillion as of January 2017) and its huge population (at 1.38 billion) make it a potentially enormous market. To illustrate:
- Although Chinese private consumption as a percentage of GDP is much lower than that of most other major economies, the rate of growth of Chinese private consumption has been rising rapidly. From 2007 to 2016, China's private consumption grew at an average annual rate of 8.9%, compared to 1.6% growth in the United States. |5|
- In 2015, there were 2.6 million Chinese visitors to the United States (up 18.3% over the previous year), ranking China as the fifth-largest source of foreign visitors to the United States. |6| According to U.S. Department of Commerce projections, by 2020, this figure will rise to 5.0 million, making China the third-largest source of international travelers to the United States after Canada and Mexico. |7|
- China has the world's largest mobile phone network with 1.3 billion mobile phone subscribers as of June 2016. |8|
- E-Marketer, a research firm, estimated that China's e-commerce sales in 2015 totaled $672 billion (nearly double the U.S. level) and projected sales would surge to nearly $2 trillion by 2019. |9|
- Boeing Corporation delivered 145 planes to China in 2015. Boeing predicts that over the next 20 years (2015-2034), China will need 6,330 new airplanes valued at $950 billion, and will be Boeing's largest commercial airplane customer outside the United States. |10| During Chinese President Xi Jinping's visit to the United States in September 2015, China announced plans to buy 300 aircraft valued at $38 billion.
- China replaced the United States as the world's largest Internet user in 2008. As of June 2016, China had an estimated 721 million Internet users, double the U.S. population. Yet, the percentage of the Chinese population using the Internet is small relative to the United States: 52% versus 87%, respectively. |11|
- General Motors (GM) reported that it sold more cars and trucks in China than in the United States each year from 2010 to 2016. |12| GM's China sales in 2016 were 3.9 million vehicles, compared to 3.0 million vehicle sales in the United States. Equity income from GM's joint venture operations in China was $2.0 billion in 2016. GM vehicle unit sales to China accounted for 38.7% of its global total. |13| GM expects China's vehicle market to increase by 5 million units or more by 2020. |14| In addition, U.S. motor vehicle exports to China rose by 51.7% from 2012 to 2016. These totaled $8.7 billion in 2016, making China the second-largest U.S. motor vehicle export market after Canada. |15|
- According to estimates by Credit Suisse (a global financial services company), in 2015 China overtook the United States to become the country with the largest middle class at 109 million adults (with wealth between $50,000 and $500,000); the U.S. level was estimated at 92 million. |16|
- A January 2017 study prepared by Oxford Economics for the U.S.-China Business Council estimated that U.S. exports of goods and services to China, plus bilateral FDI flows, directly and indirectly supported 2.6 million U.S. jobs and contributed $216 billion to U.S GDP. The study further predicted that U.S. exports of goods and services to China would exceed $520 billion by 2030. |17|
Major U.S. Merchandise Imports from China
China was the largest source of U.S. merchandise imports in 2016, at $462.3 billion, down 4.2% from the previous year. |18| China's share of total U.S. merchandise imports rose from 8.2% in 2000 to 21.1% in 2016. The importance (ranking) of China as a source of U.S. imports has risen sharply, from eighth largest in 1990, to fourth in 2000, to second in 2004-2006, and to first in 2007-present (see Figure 2). The top five U.S. imports from China in 2016 were communications equipment; computer equipment; miscellaneous manufactured commodities (such as toys and games); apparel; and semiconductors and other electronic components (see Table 4). China was also the third-largest source of U.S. agricultural imports in 2016 at $6.2 billion.
Figure 2. Major Sources of U.S. Merchandise Imports: 2016
($ in billions)
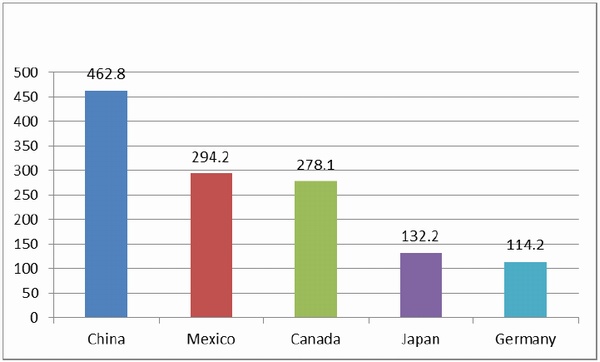
Source: USITC DataWeb.
Table 4. Major U.S. Merchandise Imports From China in 2016
($millions and percentage change)
NAIC Number NAIC Description (4-digit level) 2014 2015 2016 Percent Change 2015-2016 3342 COMMUNICATIONS EQUIPMENT 64,236 67,349 65,676 -2.5% 3341 COMPUTER EQUIPMENT 67,201 63,433 57,377 -9.5% 3399 MISCELLANEOUS MANUFACTURED COMMODITIES 33,601 35,805 34,916 -2.5% 3152 APPAREL 27,146 27,512 25,145 -8.6% 3344 SEMICONDUCTORS & OTHER ELECTRONIC COMPONENTS 22,458 23,327 22,449 -3.8% 3371 HOUSEHOLD & INSTITUTIONAL FURNITURE & KITCHEN CABINETS 14,018 15,738 16,370 4.0% 3162 FOOTWEAR 16,842 17,067 14,624 -14.3% 3343 AUDIO & VIDEO EQUIPMENT 14,645 14,882 13,887 -6.7% 3363 MOTOR VEHICLE PARTS 12,213 13,575 13,417 -1.2% 3352 HOUSEHOLD APPLIANCES AND MISCELANEOUS MACHINES, NESOI 12,205 13,290 12,344 -7.1% Total 468,484 483,245 462,813 -4.2% Source: USITC Dataweb.
Notes: NAIC is the North American Industrial Classification system.Throughout the 1980s and 1990s, nearly all U.S. imports from China were low-value, labor-intensive products, such as toys and games, consumer electronic products, footwear, and textiles and apparel. However, over the past few years, an increasing proportion of U.S. imports from China have been comprised of more technologically advanced products (see text box below).
U.S.-China Trade in Advanced Technology Products According to the U.S. Census Bureau, U.S. imports of "advanced technology products" (ATP) from China in 2016 totaled $147.6 billion. Information and communications products were the largest U.S. ATP import from China. ATP products accounted for 331.9% of total U.S. merchandise imports from China. In addition, 34.4% of total U.S. ATP imports were from China (compared with 14.1% in 2003). U.S. ATP exports to China in 2016 were $33.4 billion; these accounted for 28.8% of total U.S. exports to China and 9.7% of U.S. global ATP exports. In comparison, U.S. ATP exports to China in 2003 were $8.3 billion, which accounted for 29.2% of U.S. exports to China and 4.6% of total U.S. ATP exports.
The United States ran a $ 1 14.2 billion deficit in its ATP trade with China in 2016, up from a $21.0 billion deficit in 2003. Some see the large and growing U.S. trade deficit in ATP with China as a source of concern, contending that it signifies the growing international competitiveness of China in high technology. Others dispute this, noting that a large share of the ATP imports from China are in fact relatively low-end technology products and parts, such as notebook computers, or are products that are assembled in China using imported high technology parts that are largely developed and/or made elsewhere.
Trade in Services
China is a major U.S. trading partner in services. In 2015, China was the 4th-largest services trading partner at $63.6 billion, the 3rd-largest services export market at $48.4 billion, and the 11th-largest source of services imports at $15.1 billion (see Figure 3). |19| The United States ran at $33.3 billion services trade surplus with China, which was the largest services surplus of any U.S. trading partner.
Figure 3. Major U.S. Services Trading Partners in 2015
($ in billions)
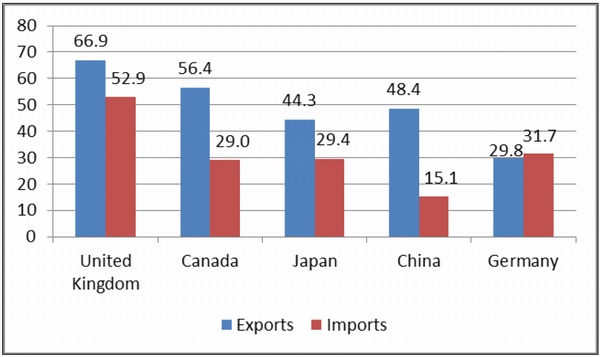
Source: BEA.
Notes: Ranked according to total trade in services in 2015.The U.S. Merchandise Trade Deficit with China
A major concern among some U.S. policymakers is the size of the U.S. merchandise trade deficit with China, which rose from $10 billion in 1990 to $367 billion in 2015 (see Figure 4). The deficit fell to $347 billion in 2016. For the past several years, the U.S. merchandise trade deficit with China has been significantly larger than that with any other U.S. trading partner (see Figure 5). Some analysts contend that the large U.S. merchandise trade deficits with China indicate that the trade relationship is somehow unbalanced, unfair, and damaging to the U.S. economy. Others argue the large U.S. trade deficit with China is more of a reflection of global shifts in production as well as the emergence of extensive and complex supply chains, where China is often the final point of assembly for export-oriented multinational firms that source goods from multiple countries.
Figure 4. U.S. Merchandise Trade Balance with China: 2000-2016
($ in billions)
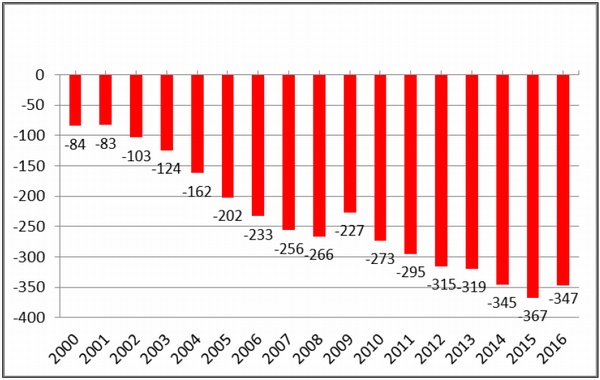
Source: USITC DataWeb.
Figure 5. Five Largest U.S. Merchandise Trade Imbalances in 2016
($ in billions)
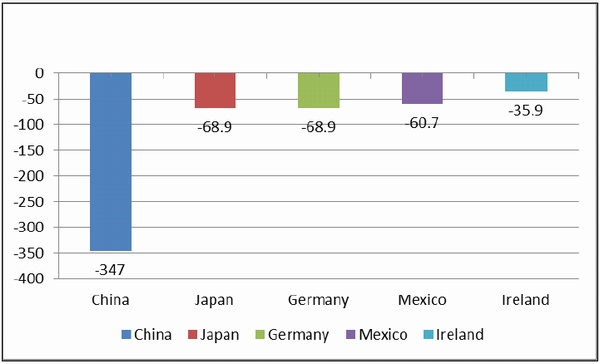
Source: USITC DataWeb.
The Transfer of Pacific Rim Production to China by Multinational Firms
Many analysts contend that the sharp increase in U.S. imports from China (and hence the growing bilateral trade imbalance) is largely the result of movement in production facilities from other (primarily Asian) countries to China. That is, various products that used to be made in such places as Japan, Taiwan, Hong Kong, etc., and then exported to the United States, are now being made in China (in many cases, by foreign firms in China). To illustrate, in 1990, 47.1% of the value of U.S. manufactured imports came from Pacific Rim countries (including China); this figure remained relatively unchanged in 2015 at 46.8% in 2015. |20| Over this period, the share of total U.S. manufactured imports that came from China rose from 3.6% to 26.1%. In other words, while China was becoming an increasingly important source for U.S. manufactured imports, the relative importance of the rest of the Pacific Rim (excluding China) as a source of U.S. imports was declining, in part because many multinational firms were shifting their export-oriented manufacturing facilities to China (see Figure 6). In 1990, China accounted for 7.6% of U.S. manufactured imports from all Pacific Rim countries, but by 2015, this figure had risen to 55.8%.
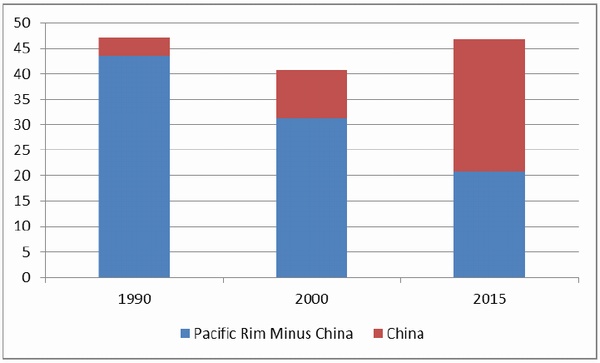
Source: USITC DataWeb.
Notes: Standard International Trade Classification (SITC) definition of manufactured imports.A significant amount of the shift of production involved Japan. In 1990, Japan was the source of 23.8% of U.S. manufactured imports, but by 2015 this level had dropped to 6.5%. Conversely, China's share of U.S. manufactured imports rose from 3.8% to 24.3% (see Figure 7). Japan accounted for the single largest U.S. bilateral merchandise trade deficit for many years until it was overtaken by China in 2000.
Figure 7. U.S. Manufactured Imports from China and Japan as a percentage of U.S. Total: 1999-2015 (%)
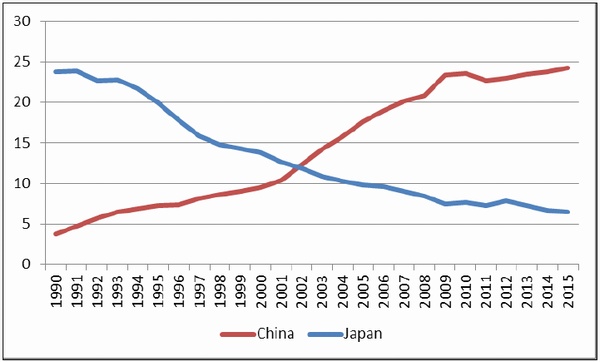
Source: USITC DataWeb.
China as a Major Center for Global Supply Chains
Another illustration of the shift in Asian production can be seen in the case of U.S. computer equipment imports, which constitute the largest category of U.S. imports from China (on an NAIC basis, 4-digit level). In 2000, Japan was the largest foreign supplier of U.S. computer equipment (with a 19.6% share of total U.S. imports), while China ranked fourth (with a 12.1% share). By 2015, Japan's ranking had fallen to fourth; the value of its shipments dropped by 75.4% over 2000 levels, and its share of U.S. computer imports declined to 3.2% (2015). China was by far the largest foreign supplier of computer equipment in 2015 with a 61.4% share of total U.S. computer equipment imports, compared to 12.0% in 2000 (see Figure 8). |21| While U.S. imports of computer equipment from China from 2000 to 2015 increased by 668.3%, the total value of U.S. computer imports worldwide rose by only 50.4%. |22| Taiwan, one of the world's leaders in sales of information and communications technology (ICT), produces over 93% of such products in China. Computer equipment, like many other globally traded products, often involves many stages of production, using parts and other inputs made by numerous multinational firms throughout the world, a significant share of which is currently assembled in China. The globalization of supply chains makes it increasingly difficult to interpret conventional U.S. trade statistics.
Figure 8. U.S. Computer Imports from China as a Percentage of Total U.S. Computer Imports: 2000-2015
(percentage)
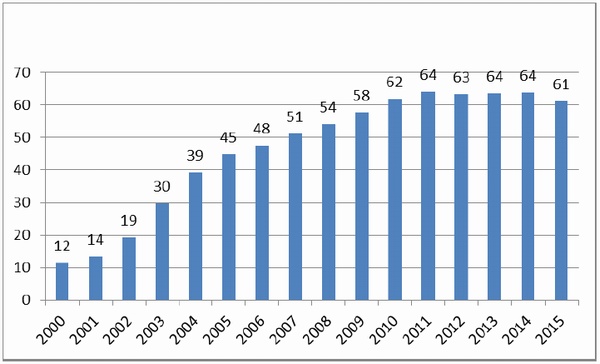
Source: USITC DataWeb.
A joint study by the Organization for Economic Cooperation and Development (OECD) and the WTO has sought to estimate trade flows according to the value that was added in each country. For example, the OECD/WTO study estimated that in 2011, 32.2% of the overall value of China's gross exports was comprised of foreign imports. This level increases to 40.2% for China's total manufactured exports, and for electrical and optical equipment, it was 53.8% (see Figure 9). The study estimated that if bilateral trade imbalances were measured according to the value of trade that occurred domestically in each country, the U.S. trade deficit (in goods and services) with China in 2011 (the most recent year available) would decline by 35% (from $278.6 billion to $181.1 billion). This is largely because of the role of intermediates trade (parts and materials imported to make products). For example, the World Bank estimates that U.S. intermediate exports and imports to and from China in 2015 were $18.7 billion and $32.5 billion, respectively. |23| Thus, many Chinese products contain U.S.-made inputs and some U.S. products contain Chinese-made inputs.
According to Apple Corporation, it utilized over 200 corporate suppliers with 766 facilities located around the world. The top five largest country sources of these facilities in 2015 were China (346), Japan (126), the United States (69), Taiwan (41), and South Korea (28) (see Figure 10). Some U.S. corporate suppliers to Apple have facilities located in many countries. For example, Intel Corporation has 10 facilities that supply products to Apple, of which, four are located in the United States, two each in China, and one each in Ireland, Israel, Malaysia, and Vietnam. |24| Apple iPhones are mainly assembled in China by Taiwanese companies (Foxconn and Pegatron), using a number of intermediate goods imported from abroad (or in many cases intermediates made by foreign firms in China). Many analysts have estimated that the value-added that occurs in China in the production of the iPhone is small relative to the total value of the product because it mainly involves assembling foreign-made or foreign-owned components. Apple Corporation, on the other hand, is thought to be the single largest beneficiary (in terms of gross profit) of the sale of the iPhone. However, conventional trade data do not accurately attribute the value-added that occurs in each stage of making the iPhone. Rather, when the United States imports iPhones from China, U.S. trade data attributes nearly the full value of the product as originating in China, which, some argue artificially inflates the size of the U.S. trade deficit with China.
One 2010 study estimated that in 2009, China exported 11.3 million iPhones to the United States, with a shipping price of $179 per unit and total export value at $2.0 billion. The study estimated that 96.4% of the value of iPhone was attributed to foreign suppliers and producers of components and parts, including the United States (at $122 million). Standard trade data would put China's trade surplus in iPhone trade with the United States at $1.9 billion, but that level would fall to $73.5 million if that trade was measured according to the value-added that occurred in each country. |25| Several analysts have concluded that Apple's innovation in developing and engineering its products and its ability to source most of its production in low-cost countries, such as China, has helped enable Apple to become a highly competitive and profitable firm (as well as a source for high-paying jobs in the United States). |26| Apple products illustrate that the rapidly changing nature of global supply chains has made it increasing difficult to interpret the implications of U.S. trade data because, while they may show where products are being imported from, they often fail to reflect who benefits from that trade.
Figure 9. Estimated Percentage Foreign Value-Added to China's Exports in 2011
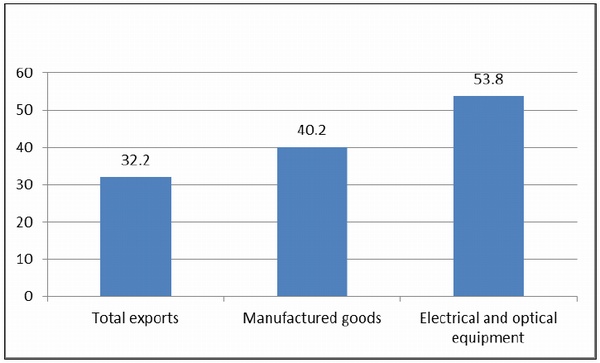
Source: OECD/WTO Trade in Value-Added, October 2015.
Figure 10. Top Five Country Sources of Facilities that Supply Apple Corporation in 2015
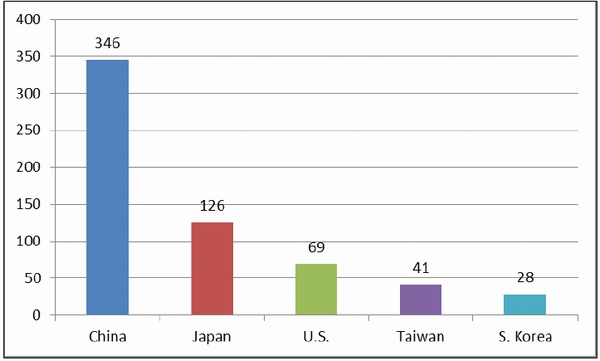
Source: Apple Corporation 2015 supplier list.
Note: Includes suppliers of materials, manufacturing, and assembly of products worldwide.Jobs and Trade
Measuring or assessing the benefits and costs of growing U.S.-China economic ties is often hotly debated among U.S. policymakers and economists, particularly in regard to its impact on various manufacturing sectors and workers (see Text Box).
China and U.S. Jobs The impact on U.S. employment (especially in various manufacturing sectors) resulting from imports from China (particularly after it joined the WTO in 2001) has been a major point of contention. Some critics of U.S. trade policy toward China attempt to link U.S. job losses to the growth and size of U.S. imports from China and/or the bilateral trade imbalance. For example, a study by the Economic Policy Institute (EPI) in December 2014 claims that growth in the U.S. goods trade deficit with China between 2001 and 2013 "eliminated or displaced" 3.2 million U.S. jobs (three-fourths of which were in manufacturing). |27| The authors stated that they used an input-output model that "estimated the amount of labor, or number of jobs, that is required to produce a given volume of exports and the labor displaced when a given volume of imports is substituted for domestic output." The difference between the two numbers is thus the estimated jobs displaced by the trade deficit. Critics of the EPI study argue that the methodology used is flawed. First, the study essentially takes the Department of Commerce's estimates of the number of jobs "supported" by each $1 billion exports (5,805 in 2013) |28| and makes the assumption that each $1 billion in imports must displace the same level of jobs, a notion that most economists would disagree with. For example, not all imports from China compete directly with U.S. producers. Many are products that used to be made in other countries, and thus an increase in imports from China alone did not necessarily displace U.S. domestic producers. In addition, some imports from China contain U.S.-made intermediate parts (such as semiconductors) made in the United States. Many imports from China are final assembled products (such as Apple iPhones) with a relatively small share of value-added from China, and the jobs generated or supported by innovating the products are not accounted for in the trade data. Finally, factors other than trade, such as technological innovation, may also affect job levels in some sectors.
Similarly, while China is the largest source of U.S. merchandise imports, the overall impact on the U.S. economy is relatively small. A Federal Reserve Bank of San Francisco study examined U.S. consumer spending and estimated that, in 2010, U.S. personal consumption expenditures (PCE) of domestically sourced goods and services goods was 88.5% of total U.S. PCE (total imports accounted for 11.5%). Imports from China accounted for 2.7% of U.S. PCE, but less than half of this amount was attributed to the actual cost (price) of Chinese imports--the rest went to U.S. businesses and workers transporting, selling, and marketing the Chinese-made products, which, the study estimated, would reduce China's share of U.S. PCE to l.9%. |29|
Economists generally argue that trade has an overall positive impact on the economy. Low-cost imports boost consumer welfare, increase consumer choices, and help lower inflation. However, some economists contend that the benefits of trade are not equally spread. Some sectors can be negatively impacted, affecting employment and wages, and such negative effects can be concentrated in certain regions or industries, and adjusting to such shocks can be challenging. A 2014 study by the National Bureau of Economic Research (NBER) concluded that increased import penetration from China from 1999 to 2011 directly and indirectly resulted in net U.S. job losses of 2.0 million to 2.4 million U.S. jobs, and accounted for 10% of the decline in U.S. manufacturing jobs during this period. |30| Another NBER study asserted that China's rise as an economic power has "induced an epochal shift in patterns of world trade" and has "challenged much of the received empirical wisdom about how labor markets adjust to trade shocks." The study said that for workers in import-competing firms, "adjustment in local labor markets is remarkably slow, with wages and labor-force participation rates remaining depressed and unemployment rates remaining elevated for at least a full decade after the China trade shock commences. Exposed workers experience greater job churning and reduced lifetime income," in part because workers that may lose their jobs due to imports often remain in highly exposed industries or regions, which are subject to further trade shocks. |31| The study claimed that there is little evidence for substantial off-setting employment gains in local industries not exposed to the trade shock. Critics of the two NBER studies contend that while trade may impact the composition of jobs in the U.S. economy, it has little long-term effect on the number of jobs, which they argue is largely a function of aggregate demand. They also point out that between 2010 and 2015, the number of U.S. manufacturing jobs rose by 6.8% even though U.S. imports from China increased by 32.4%. In addition, U.S. manufacturing output during this period rose by 15.3%. Some economists contend that U.S. productivity has been a major cause of job losses in manufacturing. A study by Ball State University attributed 88% of U.S. manufacturing job losses from 2000 to 2010 to productivity gains, noting that had the United States "kept 2000-levels of productivity and applied them to 2010-levels of production, we would have required 20.9 million manufacturing workers. Instead, we employed only l2.l million." |32|
U.S.-China Investment Ties: Overview
Investment plays a large and growing role in U.S.-China commercial ties. |33| China's investment in U.S. assets can be broken down into several categories, including holdings of U.S. securities, foreign direct investment (FDI), and other non-bond investments. The Department of the Treasury defines foreign holdings of U.S. securities as "U.S. securities owned by foreign residents (including banks and other institutions) except where the owner has a direct investment relationship with the U.S. issuer of the securities." |34| U.S. statutes define FDI as "the ownership or control, directly or indirectly, by one foreign resident of 10% or more of the voting securities of an incorporated U.S. business enterprise or the equivalent interest in an unincorporated U.S. business enterprise, including a branch." |35| The Bureau of Economic Analysis (BEA) is the main U.S. government agency that collects and reports data on FDI flows to and from the United States, which is done on a balance of payment basis. |36| China has also invested in a number of U.S. companies, projects, and various ventures which do not meet the U.S. definition of FDI, and thus, are not reflected in BEA's data.
Chinese overseas investment has largely been driven by its accumulation of foreign exchange reserves (FERs), which totaled $3.12 trillion as of October 2016, by far the world's largest. China's large FERs have mainly been a function of large annual trade surpluses and FDI inflows, as well as past intervention by the Chinese government to halt or slow the renminbi's appreciation (discussed later in the report) and restrictions on capital outflows by private Chinese citizens. Rather than holding foreign currencies, such as U.S. dollars, which earn no interest, the Chinese government has invested much of those reserves abroad. For many years, much of that investment has gone into U.S. Treasury securities, which have been viewed as a relatively safe investment (as they are backed by the full faith and credit of the U.S. government) and liquid (e.g., easily sold), albeit generating relatively small rates of returns. More recently, the Chinese government has diversified its investments in order to obtain higher returns, such as by encouraging its firms (especially state-owned enterprises) to invest overseas to become more globally competitive, as well as to help China gain access to raw materials (such as oil), food, and technology. As a result, Chinese annual FDI outflows have grown significantly in recent years, rising from $21 billion in 2006 to $128 billion in 2015, making China the third-largest source of annual global FDI outflows. |37|
U.S. investment in China has largely been in the form of FDI flows. Initially, most U.S. FDI in China after it began its market reforms in 1979 likely went toward export-oriented manufacturing to take advantage of China's relatively low wages. In more recent years, as China's economy has rapidly grown, a larger share of U.S. FDI in China has gone to tap into China's booming domestic demand for goods and services. However, many U.S firms raise concerns that Chinese investment restrictions and requirements often hamper their efforts.
China's Holdings of U.S. Public and Private Securities |38|
China's holdings of U.S. public and private securities are significant and by far constitute the largest category of Chinese investment in the United States. |39| These securities include U.S. Treasury securities, U.S. government agency (such as Freddie Mac and Fannie Mae) securities, corporate securities, and equities (such as stocks). China's investment in public and private U.S. securities totaled $1.84 trillion as of June 2015, making China the second-largest holder after Japan. |40| U.S. Treasury securities, which help the federal government finance its budget deficits, are the largest category of U.S. securities held by China. |41| As indicated in Table 5 and Figure 11, China's holdings of U.S. Treasury securities increased from $118 billion in 2002 to $1.24 trillion in 2014, but fell to $1.05 trillion as of November 2016, making it the second-largest foreign holder of U.S. Treasury securities after Japan. |42| China's holdings of U.S. Treasury securities as a share of total foreign holdings rose from 9.6% in 2002 to a historical high of 26.1% in 2010 (year-end), but this level has since fallen, dropping to 17.6% as of November 2016. |43|
Table 5. China's Holdings of U.S. Treasury Securities: 2002-November 2016
2002 2004 2006 2008 2010 2012 2014 Nov 2016 China's holdings ($ billions) 118 223 397 727 1,160 1,203 1,244 1,049 China's holdings as a percentage of total foreign holdings 9.6% 12.1% 18.9% 23.6% 26.1% 23.0% 21.7% 17.6% Source: U.S. Department of the Treasury.
Note: Annual data are year-end. Data excludes Hong Kong and Macau which are treated separately.Some analysts and Members of Congress have raised concerns that China's large holdings of U.S. debt securities could give China leverage over U.S. foreign policy, including trade policy. They argue, for example, that China might attempt to sell (or threaten to sell) a large share of its U.S. debt securities as punishment over a policy dispute, which could damage the U.S. economy. Others counter that China's holdings of U.S. debt give it very little practical leverage over the United States. They argue that, given China's economic dependency on a stable and growing U.S. economy, and its substantial holdings of U.S. securities, any attempt to try to sell a large share of those holdings would likely damage both the U.S. and Chinese economies. Such a move could also cause the U.S. dollar to sharply depreciate against global currencies, which could reduce the value of China's remaining holdings of U.S. dollar assets. Analysts further note that, while China is the largest foreign owner of U.S. Treasury securities, those holdings accounted for only 6.5% of total U.S. public debt securities as of March 2016. |44|
Figure 11. China's Holdings of U.S. Treasury Securities: 2002-November 2016
($ in billions)
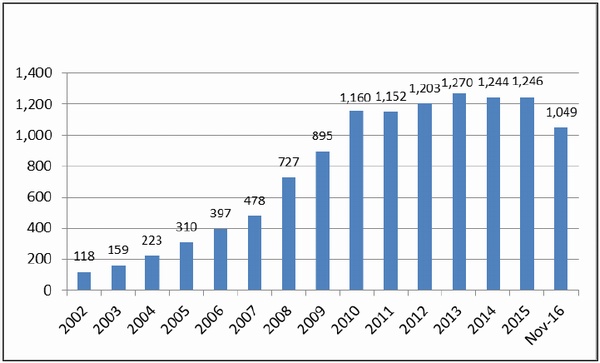
Source: U.S. Department of the Treasury.
Notes: Annual data are year-end. Data excludes Hong Kong and Macau which are treated separately.In the 112th Congress, the conference report accompanying the National Defense Authorization Act of FY2012 (H.R. 1540, P.L. 112-81) included a provision requiring the Secretary of Defense to conduct a national security risk assessment of U.S. federal debt held by China. The Secretary of Defense issued a report in July 2012, stating that "attempting to use U.S. Treasury securities as a coercive tool would have limited effect and likely would do more harm to China than to the United States. As the threat is not credible and the effect would be limited even if carried out, it does not offer China deterrence options, whether in the diplomatic, military, or economic realms, and this would remain true both in peacetime and in scenarios of crisis or war." |45|
Bilateral Foreign Direct Investment Flows
The level of foreign direct investment (FDI) flows between China and the United States is relatively small given the large volume of trade between the two countries. Many analysts contend that an expansion of bilateral FDI flows could greatly expand commercial ties. |46| BEA data on U.S.-China FDI (see Table 6) indicate that in 2015:
- U.S. FDI flows to China were $7.3 billion (down 4.2% from 2014 flows), making China the 10th-largest destination of U.S. FDI outflows.
- The stock of U.S. FDI in China on a historical-cost basis (i.e., the book value) through 2015 was $74.6 billion (up 10.4% over the previous year), making China the 14th-largest overall destination of U.S. FDI through 2015.
- Chinese FDI flows to the United States were $5.1 billion (up 155.2% over 2014 levels), making China the 12th-largest source of U.S. FDI inflows in 2015.
- At the end of 2015, the stock of Chinese FDI in the United States on a historical-cost basis, was $14.8 billion (up 49.5% over the previous year), making China the 19th-largest overall source of U.S. FDI through 2015. |47|
Table 6. Summary of BEA Data on U.S.-China FDI Flows: 2015
FDI Data Quantity ($ billions) Ranking of FDI Flows U.S. FDI flows to China in 2015 7.3 10th China FDI flows to U.S. in 2015 5.1 12th Stock of U.S. FDI in China through 2015 74.6 14th Stock of Chinese FDI in U.S. through 2015 14.8 19th Source: Bureau of Economic Analysis.
Notes: FDI stock data are on a historical-cost basis. Rankings were made using only countries and exclude broad groupings of territories or islands. Data for China exclude Hong Kong and Macau which are counted separately.The Rhodium Group, a private consulting firm, estimates Chinese FDI in the United States to be significantly higher than BEA estimates. The Rhodium Group notes that "Official data often exhibit a 1-2 year time lag and do not capture major trends, due to problems such as significant round tripping and trans-shipping of investments." |48| The Rhodium Group's approach is to calculate the full value of a Chinese acquisition in the year it was made and to attribute that acquisition to China if it was made by a Chinese entity, regardless of where the financing of the deal originated from (such as through Hong Kong and Caribbean offshore centers, which often occurs). |49| The Rhodium Group's data on U.S.-China FDI are much higher than BEA's data (see Figure 12, Figure 13, and Figure 14). |50| For example:
- The Rhodium Group's estimate of the stock of Chinese FDI in the United States through 2015, at $62.9 billion, is 325% higher than BEA's data (at $14.8 billion).
- The Rhodium Group's estimate of the stock of U.S. FDI in China, at $227.9 billion, is 205.5% higher than BEA's estimate (at $74.6 billion).
- The Rhodium Group puts Chinese FDI flows to the United States in 2015 at $15.3 billion, which was 200% higher than BEA's data ($5.1 billion). The Rhodium Group estimates China's FDI flows doubled from 2012 to 2015, while BEA's data show a 47.7% increase.
- The Rhodium Group's estimate of U.S. FDI flows to China in 2015 at $13.1 billion, which was 78.8% higher than BEA's data.
Figure 12. BEA and Rhodium Group Estimates of the Stock of U.S.-China FDI through 2015
($ in billions)
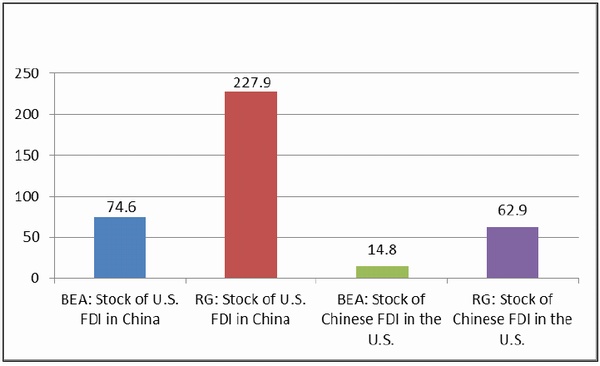
Source: Bureau of Economic Affairs and the Rhodium Group.
Note: BEA and the Rhodium Group use different methodologies to measure China's FDI in the United States.Figure 13. BEA and Rhodium Group Data on Annual U.S. FDI Flows to China: 2005-2015
($ in millions)
Source: BEA and Rhodium Group.
Notes: BEA and Rhodium Group methodologies for measuring FDI differ significantly.Figure 14. BEA and Rhodium Group Data on Chinese FDI Flows to the United States: 2005-2015
($ in millions)
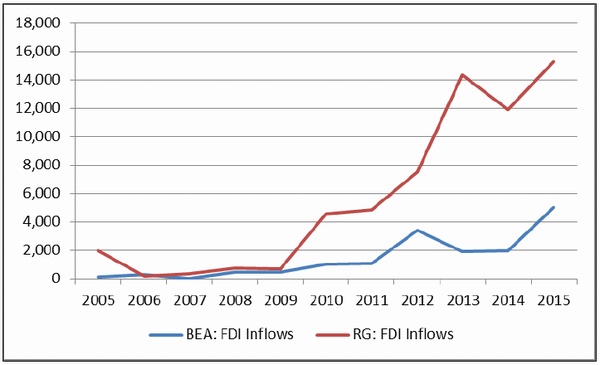
Source: BEA and Rhodium Group.
Note: BEA and Rhodium Group methodologies for measuring FDI differ significantly.Chinese Restrictions on U.S. FDI in China
U.S. trade officials have urged China to liberalize its FDI regime in order to boost U.S. business opportunities in, and expand U.S. exports to, China. Although China is one of the world's top recipients of FDI, the Chinese central government imposes numerous restrictions on the level and types of FDI allowed in China. According to the U.S.-China Business Council (USCBC), China imposes ownership barriers on nearly 100 industries. |51| The OECD's 2014 FDI Regulatory Restrictiveness Index, which measures statutory restrictions on foreign direct investment in 57 countries (including all OECD and G-20 countries, and covering 22 sectors), ranked China's FDI regime as the most restrictive, based on foreign equity limitations, screening or approval mechanisms, restrictions on the employment of foreigners as key personnel, and operational restrictions (such as restrictions on branching, capital repatriation, and land ownership). |52|
Some recent surveys by U.S. business groups suggest that foreign firms in China may be less optimistic about the Chinese market than in the past, due in part to perceived growing protectionism. To illustrate:
- A September 2015 survey by USCBC noted that "American executives' confidence in their prospects in China continues to moderate, however, reflecting uncertainty about the direction of Chinese policies, limited progress on economic reforms, increased competition, and slowing growth." A quarter of companies cited Chinese policies and regulations as the primary constraint on increased profitability in China and 97% said they felt Chinese state-owned enterprises (SOEs) received preferences." |53|
- A 2016 American Chamber of Commerce in China (AmCham China) business climate survey of 500 member companies found that while a majority of respondents felt optimistic about their investments in China, 77% said that foreign businesses in China were less welcome in China than before, compared to 41% who asserted that in 2013. Inconsistent regulatory interpretation and unclear laws were cited by respondents as their biggest business challenge in China. |54|
- A 2016 European Union Chamber of Commerce in China business confidence survey stated that the business environment in China was becoming "increasingly hostile" and "perpetually tilted in favor of domestic enterprises." For example, among respondents, 56% said doing business in China was becoming more difficult and 57% claimed foreign companies tend to receive unfavorable treatment in China compared to domestic Chinese firms. |55|
Negotiations for a Bilateral Investment Treaty (BIT) |56|
The United States and China initiated negotiations on reaching a bilateral investment treaty (BIT) in 2008 with the goal of expanding bilateral investment opportunities. U.S. negotiators hope such a treaty would improve the investment climate for U.S. firms in China by enhancing legal protections and dispute resolution procedures, and by obtaining a commitment from the Chinese government that it would treat U.S. investors no less favorably than Chinese investors.
In April 2012, the Obama Administration released a "Model Bilateral Investment Treaty" that was developed to enhance U.S. objectives in the negotiation of new BITs. |57| The new model BIT address six core principles or issues for investors, including national treatment and most-favored nation (MFN) treatment at all stages of investment, rules on expropriations and compensation if this occurs, ability to transfer funds in and out of the country, limits on performance requirements (such as domestic content targets or mandated technology transfer), neutral arbitration of disputes, and freedom by investors to appoint their own senior officials. |58|
During the July 10-11, 2013, session of the S&ED, China indicated its intention to negotiate a high-standard BIT with the United States that would include all stages of investment and all sectors, a commitment a U.S. official described as "a significant breakthrough, and the first time China has agreed to do so with another country." |59| A press release by the Chinese Ministry of Commerce stated that China was willing to negotiate a BIT on the basis of nondiscrimination and a negative list, meaning the agreement would identify only those sectors not open to foreign investment on a nondiscriminatory basis (as opposed to a BIT with a positive list which would only list sectors open to foreign investment).
During the July 9-10, 2014, S&ED session, the two sides agreed to a broad timetable for reaching agreement on core issues and major articles of the treaty text and committed to initiate the "negative list" negotiation early in 2015. |60| During BIT negotiations held in June 2015, each side submitted their first negative list proposals, and later agreed to submit a revised list in September 2015 right before President Xi's summit visit to the United States, which they did, but a breakthrough was not achieved. New negative lists were submitted in June 2016 and August 2016, |61| and the BIT was discussed at the September 2016, G-20 Summit held in Hangzhou, China, but no breakthrough was announced. The original goal was to complete an agreement by the end of President Obama's term.
Many analysts contend the negotiation of a U.S.-China BIT could have significant implications for bilateral commercial relations and the Chinese economy. According to USTR Michael Froman, such an agreement would "offers a major opportunity to engage on China's domestic economic reforms and to pursue greater market access, a more level playing field, and a substantially improved investment environment for U.S. firms in China." |62| For China, a high-standard BIT could help facilitate greater competition in China and result in more efficient use of resources, factors which economists contend could boost economic growth. Some observers contend that China's pursuit of a BIT with the United States represents a strategy that is being used by reformers in China to jumpstart widespread economic reforms (which appear to have been stalled in recent years). This strategy, it is argued, is similar to that used by Chinese reformers in their efforts to get China into the WTO in 2001. Such international agreements may give political cover to economic reformers because they can argue that the agreements build on China's efforts to become a leader in global affairs. This may make it harder for vested interests in China who benefit from the status quo to resist change. Some critics raise concerns that even if a high standard BIT is reached, ensuring China's full compliance may prove difficult, given China's extensive use of industrial policies. Others have raised questions as to the effect of such an agreement in boosting FDI flows and how that might impact U.S. jobs in affected industries. |63| A BIT would have to be approved in the U.S. Senate by a two-thirds majority.
The U.S.-China Economic and Security Review Commission's (USCC's) November 2015 annual report recommended that the Administration provide a comprehensive, publicly available assessment of Chinese FDI in the United States prior to completion of BIT negotiations that includes an identification of the nature of investments, whether investments received support of any kind from the Chinese government and at any level, and the sector in which the investment was made. |64| The USCC's 2016 annual report recommended that Congress should "amend the statute authorizing the Committee on Foreign Investment in the United States to bar Chinese state-owned enterprises from acquiring or otherwise gaining effective control of U.S. companies." |65|
Major U.S.-China Trade Issues
China's economic reforms and rapid economic growth, along with the effects of globalization, have caused the economies of the United States and China to become increasingly integrated. |66| Although growing U.S.-China economic ties are considered by most analysts to be mutually beneficial overall, tensions have risen over a number of Chinese economic and trade policies that many U.S. critics charge are protectionist, economically distortive, and damaging to U.S. economic interests. According to the USTR, most U.S. trade disputes with China stem from the consequences of its incomplete transition to a free market economy. Major areas of concern for U.S. stakeholders include China's
- extensive network of industrial policies (including widespread use of trade and investment barriers, financial support, and indigenous innovation policies) that seek to promote and protect domestic sectors and firms, especially SOEs, deemed by the government to be critical to the country's future economic growth;
- failure to provide adequate protection of U.S. intellectual property rights (IPR) and (alleged) widespread government-directed cyber theft of U.S. trade secrets security to help Chinese firms;
- mixed record on implementing its WTO obligations; and
- government-directed financial policies that promote high savings (but reduce private consumption), encourage high fixed investment levels (but may contribute to overcapacity in many industries), and a managed exchange rate policy that may distort trade flows.
Chinese "State Capitalism"
Currently, a significant share of China's economy is thought to be driven by market forces. A 2010 WTO report estimated that the private sector now accounted for more than 60% of China's gross domestic product (GDP). |67| A 2016 WTO study estimated that the private sector accounted for 41.8% of China's exports. |68|
However, the Chinese government continues to play a major role in economic decisionmaking. For example, at the macroeconomic level, the Chinese government maintains policies that induce households to save a high level of their income, much of which is deposited in state-controlled Chinese banks. This enables the government to provide low-cost financing to Chinese firms, especially state-owned enterprises (SOEs). At the microeconomic level, the Chinese government (at the central and local government level) seeks to promote the development of industries deemed critical to the country's future economic development by using various policies, such as subsidies, tax breaks, preferential loans, trade barriers, FDI restrictions, discriminatory regulations and standards, export restrictions on raw materials (including rare earths), technology transfer requirements imposed on foreign firms, public procurement rules that give preferences to domestic firms, and weak enforcement of IPR laws.
Many analysts argue that the Chinese government's intervention in various sectors through industrial policies has intensified in recent years. The December 2013 USTR report on China's WTO trade compliance stated:
During most of the past decade, the Chinese government emphasized the state's role in the economy, diverging from the path of economic reform that had driven China's accession to the WTO. With the state leading China's economic development, the Chinese government pursued new and more expansive industrial policies, often designed to limit market access for imported goods, foreign manufacturers and foreign service suppliers, while offering substantial government guidance, resources and regulatory support to Chinese industries, particularly ones dominated by state-owned enterprises. This heavy state role in the economy, reinforced by unchecked discretionary actions of Chinese government regulators, generated serious trade frictions with China's many trade partners, including the United States. |69|
The extent of SOE involvement in the Chinese economy is difficult to measure, due to the opaque nature of the corporate sector in China and the relative lack of transparency regarding the relationship between state actors (including those at the central and non-central government levels) and Chinese firms. According to one study by the U.S.-China Economic and Security Review Commission:
The state sector in China consists of three main components. First, there are enterprises fully owned by the state through the State-owned Assets and Supervision and Administration Commission (SASAC) of the State Council and by SASACs of provincial, municipal, and county governments. Second, there are SOEs that are majority owners of enterprises that are not officially considered SOEs but are effectively controlled by their SOE owners. Finally, there is a group of entities, owned and controlled indirectly through SOE subsidiaries based inside and outside of China. The actual size of this third group is unknown. Urban collective enterprises and Government-owned Township and village enterprises (TVEs) also belong to the state sector but are not considered SOEs. The state-owned and controlled portion of the Chinese economy is large. Based on reasonable assumptions, it appears that the visible state sector--SOEs and entities directly controlled by SOEs, accounted for more than 40 percent of China's nonagricultural GDP. If the contributions of indirectly controlled entities, urban collectives, and public TVEs are considered, the share of GDP owned and controlled by the state is approximately 50 percent. |70|
According to the Chinese government, at the end of 2011, there were 144,700 state-owned or state-controlled enterprises at the central and local government level, excluding financial institutions, with total assets worth $13.6 trillion. |71| Chinese SOEs have undergone significant restructuring over the years. More than 90% of SOEs have reportedly become corporations or shareholding companies. |72| The Chinese government has identified a number of industries where the state should have full control or where the state should dominate. These include autos, aviation, banking, coal, construction, environmental technology, information technology, insurance, media, metals (such as steel), oil and gas, power, railways, shipping, telecommunications, and tobacco. |73|
Many SOEs are owned or controlled by local governments. According to one analyst:
The typical large industrial Chinese company is ...wholly or majority-owned by a local government which appoints senior management and provides free or low-cost land and utilities, tax breaks, and where possible, guarantees that locally made products will be favored by local governments, consumers, and other businesses. In return, the enterprise provides the local state with a source of jobs for local workers, tax revenues, and dividends. |74|
China's banking system is largely dominated by state-owned or state-controlled banks. In 2011, the top five largest banks in China, all of which were shareholding companies with significant state ownership, accounted for 57.5% of Chinese banking assets. The Chinese government also has four banks that are 100% state-owned and holds shares in a number of joint stock commercial banks. |75| SOEs are believed to receive preferential credit treatment by government banks, while private firms must often pay higher interest rates or obtain credit elsewhere. According to one estimate, SOEs accounted for 85% ($1.4 trillion) of all bank loans in 2009. |76|
Not only are SOEs dominant players in China's economy, many are quite large by global standards. Fortune's 2016 list of the world's 500 largest companies includes 103 Chinese firms (compared to 29 listed firms in 2007), the top 20 of which are listed in Table 7. |77|
Table 7. Top 20 Chinese Companies on Fortune's Global 500 in 2016
Company Global 500 Rank State or Private Industry Revenue ($billions) Assets ($billions) Employees (000s) State Grid 2 State Utility 330 $479 927.8 China National Petroleum 3 State Energy 299 621 1,590 Sinopec Group 4 State Energy 294 317 810.5 Industrial & Commercial Bank of China 15 State Banking 167 3,420 466.3 China Construction Bank 22 State Banking 148 2,826 369.2 China State Construction Engineering 27 State Engineering & Construction 140 166 241.5 Agricultural Bank of China 29 State Banking 133 2,740 508.7 Bank of China 35 State Banking 122 2,590 310.0 Ping An Insurance 41 Non-State Insurance 110 734 275.0 China Mobile Communications 45 State Telecommunications 107 251 436.7 SAIC Motor 46 State Motor Vehicles & Parts 107 79 92.8 China Life Insurance 54 State Insurance 101 466 130.8 China Railway Engineering 57 State Engineering & Construction 99 110 281.4 China Railway Construction 62 State Engineering & Construction 96 109 284.1 Dongfeng Motor Group 81 State Motor Vehicles & Parts 83 57 192.0 China Resources National 91 State General Merchandisers 77 153 447.3 China Southern Power 95 State Utilities 75 99 303.3 Pacific Construction Group 99 Non-State Engineering & Construction 73 43 351.7 China South Industries Group 102 State Aerospace & Defense 70 60 238.3 China Post Group 105 State Mail, Package, and Freight Delivery 70 1,157 938.5 Source: Fortune 2016 Global 500.
Of the 103 Chinese firms listed, Fortune identified 75 companies (73% of total) where the government owned 50% or more of the company. Together, these 75 firms in 2016 generated $7.2 trillion in revenues, had assets valued at $20.7 trillion, and employed 16.2 million workers. Of the 28 other Chinese firms on the Fortune 500 list, several appear to have financial links to the Chinese government. For example:
- Several of the listed firms are banks where the Chinese government owns a large or controlling share, including 26.5% of the Bank of Communications, 15.7% of China Minsheng Banking Corp., 21% of China Industrial Bank, 17.9% of China Merchant Bank, and 20% of Shanghai Pudong Development Bank. |78|
- Lenovo, a major global computer producer, was started by the Chinese National Academy of Social Sciences which started Legend Holdings in 1984. Lenovo was spun off from Legend in 2001, but Legend still owns 31% of Lenovo's shares. |79|
- Huawei (a major telecommunications company) describes itself as an employee-owned firm. However, many U.S. analysts contend that Huawei has strong links with the Chinese government, including the Chinese People's Liberation Army (PLA), and has not published a full breakdown of its ownership structure. In addition, in the past, the Chinese government reportedly ordered state banks to extend loans to the company early in its development so that it could compete against foreign firms in the domestic telecommunications market. |80|
- Ping An Insurance is the largest non-state company on the 2016 Global 500 list. In 2012, The New York Times published an article that reported that in 2004 a network of family and friends of then Chinese Premier Wen Jiabao owned 135 million shares of Ping An Insurance through a series of investment companies. |81| A March 2016 Times article described Ping An as a "labyrinthine shareholding structure made up of 37 interlocking holding companies." |82|
- Zhejiang Geely Holding Group (one of China's top 10 auto manufactures), while not state-owned, has received government subsidies. For example, The Wall Street Journal reported that Geely received $98 million in 2013 from central and local government entities, equal to 30% of its profits. |83|
China's Plan to Modernize the Economy and Promote Indigenous Innovation
Many of the industrial policies China has implemented or formulated since 2006 appear to stem largely from a comprehensive document issued by China's State Council (the highest executive organ of state power) in 2006 titled the National Medium-and Long-Term Program for Science and Technology Development (2006-2020), often referred to as the MLP. |84| The MLP appears to represent an ambitious plan to modernize the structure of China's economy by transforming it from a global center of low-tech manufacturing to a major center of innovation (by the year 2020) and a global innovation leader by 2050. |85| It also seeks to sharply reduce the country's dependence on foreign technology. The MLP includes the stated goals of "indigenous innovation, leapfrogging in priority fields, enabling development, and leading the future." |86| Some of the broad goals of the MLP state that by 2020:
- The progress of science and technology will contribute 60% or above to China's development.
- The country's reliance on foreign technology will decline to 30% or below (from an estimated current level of 50%).
- Gross expenditures for research and development (R&D) would rise to 2.5% of gross domestic product (from 1.3% in 2005). Priority areas for increased R&D include space programs, aerospace development and manufacturing, renewable energy, computer science, and life sciences. |87|
The document states that "China must place the strengthening of indigenous innovative capability at the core of economic restructuring, growth model change, and national competitiveness enhancement. Building an innovation-oriented country is therefore a major strategic choice for China's future development." This goal, according to the document, is to be achieved by formulating and implementing regulations in the country's government procurement law to "encourage and protect indigenous innovation," establishing a coordination mechanism for government procurement of indigenous innovative products, requiring a first-buy policy for major domestically made high-tech equipment and products that possess proprietary intellectual property rights, providing policy support to enterprises in procuring domestic high-tech equipment, and developing "relevant technology standards" through government procurement.
Reaction by U.S. Stakeholders
Beginning in 2009, several U.S. companies began to raise concerns over a number of Chinese government circulars that would establish an "Indigenous Innovation Product Accreditation" system. For example, in November 2009, the Chinese government released a "Circular on Launching the 2009 National Indigenous Innovation Product Accreditation Work," requiring companies to file applications by December 2009 for their products to be considered for accreditation as "indigenous innovation products." Similar proposed circulars were issued at the provincial and local government levels. U.S. business representatives expressed deep concern over the circulars, arguing that they were protectionist in nature because they extended preferential treatment for Chinese government procurement to domestic Chinese firms that developed and owned intellectual property (IP) and thus largely excluded foreign firms. |88| AmCham China described China's attempt to link IP ownership with market access as "unprecedented worldwide." |89| A letter written by the U.S. Chamber of Commerce and 33 business associations to the Chinese government on December 10, 2009, stated that the indigenous innovations circulars would "make it virtually impossible for any non-Chinese companies to participate in China's government procurement market--even those that have made substantial and long-term investments in China, employ Chinese citizens, and pay taxes to the Chinese government." Such groups contend that a large share of their technology is developed globally and thus it would be difficult to attribute the share of technology developed in China needed to obtain accreditation. |90|
A 2011 AmCham China survey found that 40% of respondents believed that China's indigenous innovation policies would hurt their businesses and 26% said their businesses were already being hurt by such policies. At a November 2011 WTO review of China's IPR policies, the U.S. WTO representative stated that China's policies of adopting indigenous innovation had "created a troubling trend toward increased discriminatory policies which were aimed at coercing technology transfer." He stated that "Chinese regulations, rules and other regulatory measures frequently called for technology transfer, and in certain cases, conditioned, or proposed to condition, the eligibility for government benefits or preferences on intellectual property being owned or developed in China, or being licensed, in some cases exclusively, to a Chinese party." |91|
China's Response to U.S. Concerns
The Chinese government responded to U.S. concerns over its indigenous innovation policies by arguing that they did not discriminate against foreign firms or violate global trade rules. |92| However, during the visit of (then) Chinese President Hu Jintao to the United States in January 2011, the Chinese government stated that it would not link its innovation policies to the provision of government procurement preferences. |93| During the May 2011 session of the U.S.-China Strategic and Economic Dialogue (S&ED), China pledged that it would eliminate all of its indigenous innovation products catalogs. |94| During the November 2011 talks held under the U.S.China Joint Commission on Commerce and Trade (JCCT), the Chinese government announced that the State Council had issued a measure requiring governments of provinces, municipalities, and autonomous regions to eliminate by December 1, 2011, any catalogues or other measures linking innovation policies to government procurement preferences. |95| This occurred after foreign business groups raised concerns that discriminatory indigenous innovation policies might continue to be implemented at the local level even after Hu Jintao's commitment. For example, the USCBC reported in February 2011 that it had identified 22 municipal and provincial governments that had issued at least 61 indigenous innovation catalogues. U.S. business representatives sought to ensure that Beijing's pledge on indigenous innovation would apply at all levels of government in China.
In May 2013, the USCBC reported that, although the central government had largely been successful in ensuring that sub-national governments complied with Hu Jintao's January 2011 commitments, 13 provinces had not yet issued any measures to comply. |96| In addition, an October 2012 USCBC survey found that 85% of respondents said they had seen little impact on their businesses resulting from China's commitments delinking indigenous innovation with government procurement. |97|
Remaining U.S. Concerns
While many U.S. business leaders have applauded China's pledge to delink indigenous innovation from government procurement, some remain wary that China will implement new policies that attempt to provide preferences to local Chinese firms over foreign firms. According to Adam Segal with the Council on Foreign Relations: "Even if China reverses certain policies under U.S. pressure, it will remain dedicated to those goals. U.S. policy is likely to become a game of Whac-a-Mole, beating down one Chinese initiative on indigenous innovation only to see another pop up." |98| U.S. business groups are also concerned with how the MLP blueprint will affect China's commitment to enforcing foreign IPR. They note, for example, that the MLP states: "Indigenous innovation refers to enhancing original innovation, integrated innovation, and re-innovation based on assimilation and absorption of imported technology, in order to improve our national innovation capability." To some, this seems to indicate that China intends to take existing technology, make some changes and improvements on it, and then claim it as its own without acknowledging or compensating the original IPR holders. A 2011 report by the U.S. Chamber of Commerce stated that China's indigenous innovation policies led many international technology companies to conclude that the MLP is a "blueprint for technology theft on a scale the world has never seen before." |99|
U.S. officials have attempted to convince Beijing that, while its desire to increase innovation in China is a commendable goal, its efforts to limit the participation of foreign firms in such efforts, or attempting to condition market access in China to the development of IPR by foreign firms in China will hinder, not promote, the advancement of innovation in China. The direction China takes on this issue could have a significant impact on U.S. economic interests as noted by a study by the USITC:
To the extent that China's policies succeed in accelerating technological progress, productivity, and innovation in the Chinese economy, they could provide spillover benefits for other countries. But if indigenous innovation policies act as a form of technological import substitution, systematically favoring Chinese domestic firms over foreign firms in relevant industries, they would be expected to have a negative effect on foreign firms and economies roughly analogous to what would occur if China simply imposed a protective tariff on imports of goods in the relevant sectors or levied a discriminatory excise tax on the sales of FIEs in the Chinese market. |100|
New Restrictions on Information and Communications Technology
According to the USTR's 2015 report on China's WTO accession, while progress has been made to delink China's efforts to link indigenous innovation goals with procurement at the central and local efforts, such policies have continued in other areas. Many foreign business groups have expressed increasing concerns over a number of recently proposed or enacted laws and regulations on information and communications technology (ICT) products and services that could limit foreign access to ICT markets in China on so-called national security grounds. Several proposals include language stating that critical information infrastructure should be "secure and controllable," an ambiguous term that has not been precisely defined by Chinese authorities. Other proposals lay out policies to promote indigenous ICT industries or would require foreign firms to hand over proprietary information. According to the U.S. Department of Commerce:
The policies set forth in these measures could cause long-term damage to U.S. businesses trying to sell ICT products into China, a market estimated to be worth about $465 billion this year. They also could add significant costs to foreign ICT companies operating in China and could prevent them from supplying the China market with the most technologically advanced and reliable products.
Such restrictions could have a significant impact on U.S. ICT firms. According to BEA, U.S. exports of ICT services and potentially ICT-enabled services (i.e., services that are delivered remotely over ICT networks) to China totaled $12.8 billion in 2015. |101| Examples of recently passed or proposed measures of concern to foreign ICT firms include the following.
- In 2014, the China Banking Regulatory Commission issued guidelines for IT security equipment used in banks (such as for cash machines and smartcard chips), which included provisions on encryption and the disclosure of source code. It emphasized the importance of developing local technology and stated that the need for "secure and controllable technologies" in the banking sector, with the goal of 15% in 2015, growing to no less than 75% in 2019. China suspended some of the guidelines in April 2015. At the June 2015 S&ED session, China agreed to ensure that bank ICT regulations "will be nondiscriminatory, are not to impose nationality-based requirements, and are to be developed in a transparent manner." |102|
- China's national security law (enacted in July 2015) includes a provision (Article 24) that says that "the State strengthens the establishment of capacity for independent innovation, accelerating the development of autonomously controlled strategic advanced technologies and key technologies in core fields, strengthens the use of intellectual property rights, protects capacity building in protection of technological secrets, and ensures security in technology and engineering." |103| Article 59 says that "the State establishes national security review and oversight management systems and mechanisms, conducting national security review of foreign commercial investment, special items and technologies, internet information technology products and services, projects involving national security matters, as well as other major matters and activities, that impact or might impact national security."
- In October 2015, the China Insurance Regulatory Commission issued new draft rules on cybersecurity in the insurance industry. The draft rules called for the adoption of "secure and controllable" technology by insurance companies, data localization requirements, and the use of products and systems employing domestic encryption methods. On June 1, 2016, 28 business groups sent a letter to the chairman of the China Insurance Regulatory Commission, arguing that the draft rules "would create unnecessary obstacles to international trade and likely to constitute a means of arbitrary or unjustifiable discrimination against providers in countries where the same conditions prevail." |104| On June 2, 2016, the United States raised concerns about the draft regulations in the WTO Committee on Trade-Related Measures, arguing that such language appears to require that Chinese insurance firms give preferences to Chinese domestic providers of hardware equipment and software over foreign firms. |105|
- In December 2015, China enacted a new counterterrorism law. |106| It requires telecommunications operators and Internet service providers to "provide technical interfaces, decryption and other technical support assistance to public security organs and state security organs conducting prevention and investigation of terrorist activities." |107| Originally, the Chinese government sought to require providers to provide it encryption codes (i.e., security back-door access) and to store local user data on servers within China, but these provisions were later dropped from the final draft of the law, in part because of sharp criticism by President Obama, who contended that such rules "would essentially force all foreign companies, including U.S. companies, to turn over to the Chinese government mechanisms where they can snoop and keep track of all the users of those services."
- China passed a new cybersecurity law on November 7, 2016, |108| which appears to promote the development of indigenous technologies and impose restrictions on foreign firms. Article 15 directs government entities to "support key network security technology industries and programs; support network security technology research and development, application and popularization; spread safe and trustworthy network products and services; protect the intellectual property rights for network technologies; and support research and development institutions, schools of higher learning, and so forth to participate in State network security technology innovation programs." Article 23 states that "Critical network equipment and specialized network security products shall follow the national standards and mandatory requirements, and be safety certified by a qualified establishment or meet the requirements of a safety inspection, before being sold or provided. The state network information departments, together with the relevant departments of the State Council, formulate and release a catalog of critical network equipment and specialized network security products, and promote reciprocal recognition of safety certifications and security inspection results to avoid duplicative certifications and inspections." |109| Article 37 states that personal information and other important data gathered or produced by critical information infrastructure operators during operations within China must store it in China. |110| A statement issued by Amcham on November 7 said the new law would not "do much to improve security," but rather would "create barriers to trade and investment." Other critics contend that provisions of the law are too broad or vague as to the level of cooperation Internet firms are required to give to government authorities and would impose new Internet restrictions. |111|
- China's recent five-year plans and other government policy pronouncements have laid out a number of plans to boost innovation and promote the development of indigenous ICT and other high tech sectors, including semiconductors (see Appendix A).
A 2016 U.S.-China Business Council survey found that 79% of respondents are concerned about China's data and IT security policies, including the impact they have on day-to-day business operations. A U.S. Chamber of Commerce report states that a decision by China to "purge foreign ICTs" would reduce China's annual GDP by 1.77% up to 3.44%, or at least $200 billion (based on 2015 GDP), and would cost the economy at a minimum nearly $3 trillion overall by 2025. |112|
Intellectual Property Rights (IPR) Issues
U.S. business and government representatives voice growing concern over economic losses suffered by U.S. firms as a result of IPR infringement in China (and elsewhere), including those from cyberattacks. U.S. innovation and the intellectual property (IP) that it generates have been cited by various economists as a critical source of U.S. economic growth and global competitiveness. |113| For example, according to the Department of Commerce, in 2014, U.S. IP-intensive industries either directly or indirectly supported 45.5 million jobs. IP intensive industries contributed $6.6 trillion in value added to the economy (up 30% from 2010), equal to 48.2% of U.S. GDP. In addition, total merchandise exports of IP-intensive industries totaled $842 billion. |114| In addition, foreign entities paid U.S. IP holders $130.4 billion in 2014 for services relating to industrial processes, computer software, trademarks, franchise fees, and audio and visual products (such as books, movies, television broadcasts, and recordings). |115|
A study by NDP Consulting estimated that in 2008, U.S. workers in IP-intensive production earned 60% more than workers at similar levels in non-IP industries. |116| A study on the Apple iPod concluded that Apple's innovation in developing and engineering the iPod and its ability to source most of its production to low-cost countries, such as China, have helped enable it to become a highly competitive and profitable firm, as well as a creator of high-paying jobs (such as engineers engaged in the design of Apple products) in the United States. |117|
IPR piracy and infringement is a significant global problem. Lack of effective and consistent protection of IPR has been cited by U.S. firms as one of the most significant problems they face in doing business in China. Other U.S. firms have expressed concern over pressures they often face from Chinese government entities to share technology and IPR with a Chinese partner. Although China has significantly improved its IPR protection regime over the past few years, U.S. IP industries complain that piracy rates in China remain unacceptably high and economic losses are significant, as illustrated by studies and estimates made by several stakeholders:
- A May 2013 study by the Commission on the Theft of American Intellectual Property estimated the annual cost to the U.S. economy of global IPR theft at $300 billion, of which China accounted for 50% ($150 billion) to 80% ($240 billion) of those losses. |118|
- The U.S. Department of Homeland Security reported that in FY2016, goods from China and Hong together accounted for 88% (or $1.2 billion) of seized counterfeit goods (based on their estimated manufacturer's retail price). |119|
- Business surveys have found mixed reactions to China's IPR enforcement efforts. For example, a majority of respondents in a 2016 AmCham survey said IPR enforcement was effective for patents (54%) and trademarks or brand protection (51%), but less than a majority found copyrights (48%) and trade secrets (40%) enforcement to be effective. At the same time, 91% of respondents agreed that IPR enforcement over the last five years had improved. |120| The European Chamber's 2016 China business survey found that although 59% of its members said China's IPR enforcement was "inadequate," this was improvement from the 95% rate reported for 2009. |121|
- The USCBC's 2016 member survey found that the top cyber issues of concern were Internet service within China (51%), inability to use global IT solutions in China (50%), IP theft (49%), and restrictions on cross-border data flows (43%). |122|
- The USTR's 2016 report on foreign trade barriers stated that over the past decade, China's Internet restrictions have "posed a significant burden to foreign suppliers," and that 8 out of the top 25 most globally visited sites (such as Yahoo, Facebook, YouTube, eBay, Twitter, and Amazon) are blocked in China. |123| Freedom House's 2015 Freedom on the Net report ranked China's Internet regime as the most restrictive out of 65 countries surveyed. |124|
- The U.S. International Trade Commission (USITC) in 2001 estimated that U.S. intellectual property-intensive firms that conducted business in China lost $48.2 billion in sales, royalties, and license fees in 2009 because of IPR violations there. It also estimated that an effective IPR enforcement regime in China that was comparable to U.S. levels could increase employment by IP-intensive firms in the United States by 923,000 jobs. |125|
- The Business Software Alliance (BSA) estimated the commercial value of illegally used software in China at $8.7 billion in 2015 (up from $7.6 billion in 2009), and that the software piracy rate in China was 70% (down from 79% in 2007). |126| BSA further estimated that legitimate software sales in China were only $3.7 billion, compared to legal sales of $41.0 billion in the United States.
- The Organization for Economic Development and Cooperation (OECD) estimates that counterfeit products accounted for 2.5% of global trade in 2013 (or $461 billion). |127|
Chinese officials contend that they have significantly improved their IPR protection regime, but argue that the country lacks the resources and a sophisticated legal system to effectively deal with IPR violations. They also contend that IPR infringement is a serious problem for domestic Chinese firms as well. A survey by the Chinese State Administration for Industry and Commerce found that 58.7% of products sold online in China were genuine in 2014. |128| Many analysts contend that China's goals of becoming a global leader in innovation will induce the government to strengthen IPR laws and enforcement. However, some analysts contend that China's relatively poor record on IPR enforcement can be partially explained by the fact that Chinese leaders want to make China a major producer of capital-intensive and high-technology products, and thus, they are tolerant of IPR piracy if it helps Chinese firms become more technologically advanced. According to an official at the U.S. Chamber of Commerce:
The newer and emerging challenge to U.S. IPR is not a function of China's lack of political will to crackdown on infringers. Rather, it is a manifestation of a coherent, and government-directed, or at least government-motivated, strategy to lessen China's perceived reliance on foreign innovations and IP. China is actively working to create a legal environment that enables it to intervene in the market for IP, help its own companies to "re-innovate" competing IPR as a substitute to American and other foreign technologies, and potentially misappropriate U.S. and other foreign IP as components of its industrial policies and internal market regulation.... The common themes throughout these policies are: 1) undermine and displace foreign IP; 2) leverage China's large domestic market to develop national champions and promote its own IP, displacing foreign competitors in China; and 3) building on China's domestic successes by displacing competitors in foreign markets. |129|
An illustration of alleged IPR theft in China involves American Superconductor Corporation (AMSC). On September 14, 2011, AMSC announced that it was filing criminal and civil complaints in China against Sinovel Wind Group Co. Ltd. (Sinovel), China's largest wind turbine producer, and other parties, alleging the illegal use of AMSC's intellectual property. According to an AMSC press release, Sinovel illegally obtained and used AMSC's wind turbine control software code to upgrade its 1.5 megawatt wind turbines in the field to meet proposed Chinese grid codes and to potentially allow for the use of core electrical components from other manufacturers. |130| In addition, AMSC claimed that Sinovel had refused to pay for past shipments from AMSC and was now refusing to honor contracts for future shipments of components and spare parts as well. |131| AMSC has brought several civil cases against Sinovel, seeking to recover more than $1.2 billion for contracted shipments and damages caused by Sinovel's contract breaches. |132| According to a specialist in intellectual property at Tufts University, "Chinese companies, once they acquire the needed technology, will often abandon their Western partners on the pretext the technology or product failed to meet Chinese governmental regulations. This is yet another example of a Chinese industrial policy aimed at procuring, by virtually any means, technology in order to provide Chinese domestic industries with a competitive advantage." |133| AMSC continues to pursue trade secret and copyright infringement litigation in China. |134|
Market access in China remains a significant problem for many U.S. IP industries (such as music and films) and is considered to be a significant cause of high IPR piracy rates. For example, China's growing middle class has resulted in a surge in movie box office sales in recent years, which hit $6.8 billion in 2015 (up 49% over the previous year), making China the largest market outside the United States and Canada. |135| When China joined the WTO in 2001 it agreed to allow 20 imported foreign films per year. |136| During the visit to the United States by then-Chinese Vice President Xi Jinping (February 13-17, 2012), China agreed that it would allow more American exports to China of 3D, IMAX, and similar enhanced format movies on favorable commercial terms; strengthen the opportunities to distribute films through private enterprises rather than the state film monopoly; and ensure fairer compensation levels for U.S. blockbuster films distributed by Chinese SOEs. |137| This extended China's foreign movie quota to 34, based on a revenue-sharing agreement (foreign studios receive 25% of the box office receipts) with a Chinese SOE. |138| Some business groups complain that China has failed to allow competition in the distribution of movies, noting that no private firms have been given a license to distribute movies nationally. Two Chinese government entities determine which foreign films will enter the market, set opening dates, and determine the number of screens on which films can be shown, which some argue, is mainly based on the goal of protecting and promoting Chinese films. |139| The share of Hollywood movies in box office sales in China dropped from 45.5% in 2014 to 38.4% in 2015. |140|
When China entered the WTO in 2001, it agreed that foreign firms would not be pressured by government entities to transfer technology to a Chinese partner as part of the cost of doing business in China. However, many U.S. firms argue that this is a common Chinese practice, although this is difficult to quantify because, oftentimes, U.S. business representatives appear to try to avoid negative publicity regarding the difficulties they encounter doing business in China out of concern over retaliation by the Chinese government. |141| In addition, Chinese officials reportedly pressure foreign firms through oral communications to transfer technology (for example as a condition to invest in China), avoiding putting such requirements in writing in order to evade being accused of violating WTO rules.
A 2010 study by the U.S. Chamber of Commerce stated that growing pressure on foreign firms to share technology in exchange for market access in China was forcing such firms to "anguish over balancing today's profits with tomorrow's survival." |142| In 2011, then-U.S. Treasury Secretary Timothy Geithner charged that "we're seeing China continue to be very, very aggressive in a strategy they started several decades ago, which goes like this: you want to sell to our country, we want you to come produce here. If you want to come produce here, you need to transfer your technology to us." A 2012 AmCham China survey reported that 33% of its respondents stated that technology transfer requirements were negatively affecting their businesses. |143|
U.S. officials continue to press China on this issue. A U.S. Commerce Department fact sheet from the December 2014 U.S.-China Joint Commission on Commerce and Trade (JCCT) meeting stated:
China clarified and underscored that it will treat IPR owned or developed in other countries the same as domestically owned or developed IPR, and it further agreed that enterprises are free to base technology transfer decisions on business and market considerations, and are free to independently negotiate and decide whether and under what circumstances to assign or license intellectual property rights to affiliated or unaffiliated enterprises. |144|
Following President Obama's meeting with President Xi in September 2016, the White House issued a fact sheet that said that the two sides committed "not to advance generally applicable policies or practices that require the transfer of intellectual property rights or technology as a condition of doing business in their respective markets." |145| Technology transfer issues have also been raised over a number of new Chinese laws and regulations that advance "secure and controllable technology" (discussed below).
Cyberattacks against U.S. firms have raised concerns over the potential large-scale theft of U.S. IPR and its economic implications for the United States. A 2011 report by McAfee (a U.S. global security technology company) stated that its investigation had identified targeted intrusions into more than 70 global companies and warned that "every conceivable industry with significant size and valuable intellectual property has been compromised (or will be shortly), with the great majority of the victims rarely discovering the intrusion or its impact." |146| Many U.S. analysts and policymakers contend that the Chinese government is a major source of cyber economic espionage against U.S. firms. For example, Representative Mike Rogers, chairman of the House Permanent Select Committee on Intelligence, stated at an October 4, 2011, hearing that
Attributing this espionage isn't easy, but talk to any private sector cyber analyst, and they will tell you there is little doubt that this is a massive campaign being conducted by the Chinese government. I don't believe that there is a precedent in history for such a massive and sustained intelligence effort by a government to blatantly steal commercial data and intellectual property. China's economic espionage has reached an intolerable level and I believe that the United States and our allies in Europe and Asia have an obligation to confront Beijing and demand that they put a stop to this piracy. |147|
A 2011 report by the U.S. Office of the Director of National Intelligence (DNI) stated: "Chinese actors are the world's most active and persistent perpetrators of economic espionage. U.S. private sector firms and cybersecurity specialists have reported an onslaught of computer network intrusions that have originated in China, but the IC (Intelligence Community) cannot confirm who was responsible." The report goes on to warn that
China will continue to be driven by its longstanding policy of "catching up fast and surpassing" Western powers. The growing interrelationships between Chinese and U.S. companies--such as the employment of Chinese-national technical experts at U.S. facilities and the off-shoring of U.S. production and R&D to facilities in China--will offer Chinese government agencies and businesses increasing opportunities to collect sensitive US economic information. |148|
On February 19, 2013, Mandiant, a U.S. information security company, issued a report documenting extensive economic cyberespionage by a Chinese unit (which it designated as APT1) with alleged links to the Chinese People's Liberation Army (PLA) against 141 firms, covering 20 industries, since 2006. The report stated:
Our analysis has led us to conclude that APT1 is likely government-sponsored and one of the most persistent of China's cyber threat actors. We believe that APT1 is able to wage such a long-running and extensive cyber espionage campaign in large part because it receives direct government support. In seeking to identify the organization behind this activity, our research found that People's Liberation Army (PLA's) Unit 61398 is similar to APT1 in its mission, capabilities, and resources. PLA Unit 61398 is also located in precisely the same area from which APT1 activity appears to originate. |149|
On March 11, 2013, Tom Donilon, National Security Advisor to President Obama, stated in a speech that the United States and China should engage in a constructive dialogue to establish acceptable norms of behavior in cyberspace; that China should recognize the urgency and scope of the problem and the risks it poses to U.S. trade relations and the reputation to Chinese industry; and that China should take serious steps to investigate and stop cyberespionage. |150| Following a meeting with Chinese President Xi Jinping in June 2013, President Obama warned that if cybersecurity issues are not addressed and if there continues to be direct theft of United States property, then "this was going to be a very difficult problem in the economic relationship and was going to be an inhibitor to the relationship really reaching its full potential." |151|
On May 19, 2014, the U.S. Department of Justice issued a 31-count indictment against five members of the Chinese People's Liberation Army (PLA) for cyberespionage and other offenses that allegedly targeted five U.S. firms and a labor union for commercial advantage, the first time the Federal government has initiated such action against state actors. The named U.S. victims were Westinghouse Electric Co. (Westinghouse); U.S. subsidiaries of SolarWorld AG (SolarWorld); United States Steel Corp. (U.S. Steel); Allegheny Technologies Inc. (ATI); the United Steel, Paper and Forestry, Rubber, Manufacturing, Energy, Allied Industrial and Service Workers International Union (USW); and Alcoa Inc. The indictment appears to indicate a high level of U.S. government concern about the extent of Chinese state-sponsored cyber commercial theft against U.S. firms. |152|
China strongly condemned the U.S. indictment and announced that it would suspend its participation in the U.S.-China Cyber Working Group, established in 2013. Some Members of Congress have called on the USTR to initiate a case against China in the World Trade Organization (WTO). Others have called for new measures to identify foreign governments that engage in cyberespionage and to impose sanctions against entities that benefit from that theft. For example, in the 114th Congress H.R. 3039 would authorize the President to impose certain penalties on state-sponsors of cyberattacks. Some analysts warn that growing U.S.-China disputes over cyber theft could significantly impact commercial ties. The Obama Administration has sought ways to enhance U.S. commercial cybersecurity at home, develop bilateral and global rules governing cyber theft of commercial trade secrets, strengthen U.S. trade policy tools, and promote greater cooperation with trading partners that share U.S. concerns.
On April 1, 2015, President Obama issued Executive Order 13964 authorizing certain sanctions against "persons engaging in significant malicious cyber-enabled activates." |153| Shortly before Chinese President Xi's state visit to the United States in September 2015, some press reports indicated that the Obama Administration was considering imposing sanctions against Chinese entities over cyber theft, even possibly before the arrival of President Xi, which some analysts speculated might have caused Xi to cancel his visit. This appears to have prompted China to send a high-level delegation (headed by Meng Jianzhu, Secretary of the Central Political and Legal Affairs Commission of the Chinese Communist Party) to Washington, DC, to hold four days of talks (September 9-12) with U.S. officials over cyber issues. |154|
On September 25, 2015, Chinese President Xi and President Obama announced that they had reached an agreement on cybersecurity. The agreement stated that neither country's government will conduct or knowingly support cyber-enabled theft of intellectual property, including trade secrets or other confidential business information, with the intent of providing competitive advantages to companies or commercial sectors. |155| They also agreed to set up a high-level dialogue mechanism (which would meet twice a year) to address cybercrime and to improve two-way communication when cyber-related concerns arise (including the creation of a hotline). The first meeting of the U.S.-China High-Level Joint Dialogue on Cybercrime and Related Issues was held in December 2015 in Washington, DC. The two sides reached agreement on a document establishing guidelines for requesting assistance on cybercrime or other malicious cyber activities and for responding to such requests; decided to conduct a tabletop exercise in the spring of 2016 (held in April 2015) on agreed-upon cybercrime, malicious cyber activity and network protection scenarios; pledged to develop the scope, goals, and procedures for use of the hotline for the next dialogue; and agreed to further develop case cooperation on combatting cyber-enabled crimes (including child exploitation, theft of trade secrets, fraud and misuse of technology, and communications for terrorist activities). |156| The second Cyber Dialogue was held in Beijing in June 2016. The two sides agreed to begin implementation of a cyber-hotline mechanism (which reportedly became operational in August 2016); |157| continue to strengthen cooperation in network protection; enhance case investigations and information exchanges; prioritize cooperation on combatting cyber-enabled IP theft for commercial gain and cooperate in law enforcement operations; and agreed to create an action plan to address the threat posed from business email compromise scams. |158|
Agreement on Cyber Security Issues at the September 2015 U.S-China Summit
The two sides agreed that
- neither country's government will conduct or knowingly support cyber-enabled theft of IP, including trade secrets or other confidential business information, with the intent of providing competitive advantages to companies or commercial sectors;
- they will establish a high-level joint dialogue mechanism on fighting cybercrime and related issues;
- they will seek to work together to identify and promote appropriate norms of state behavior in cyberspace internationally; and
- each side will provide timely responses to requests for information and assistance concerning malicious cyber activities.
Source: The White House.
On April 27, 2016, the United States Steel Corporation (USS) filed a Section 337 |159| case with the USITC against several major largest Chinese steel producers and their distributors in regard to certain carbon and alloy steel products. |160| USS contends that in January 2011, the Chinese government hacked U.S. Steel's research computers and equipment, stealing proprietary methods for manufacturing these products, and that soon thereafter, Baosteel (a Chinese SOE and largest Chinese steel firm), and possibly other Chinese steel firms, began producing and exporting "the very highest grades of advanced high-strength steel, even though they had previously been unable to do so." USS charged that imports of such products into the United States using USS's stolen trade secrets competed against and undercut USS's own products. This is the first Section 337 case that has involved alleged cyber theft of U.S. trade secrets.
Analysts differ on how the U.S.-China cyber agreement will address bilateral cyber theft issues. Some have called it a good first start to developing rules governing cyber theft of commercial IPR. Others are more skeptical, noting that the Chinese government denies engaging in cyber theft of trade secrets for gaining a competitive advantage and instead claims China is the "biggest victim" of such activity. In addition, critics contend, it is often extremely difficult to identify hackers, let alone trace it back to a government entity. According to CrowdStrike (a U.S. cybersecurity firm), cyber-attacks against U.S. firms continued shortly after the agreement was reached. It detected 11 breaches of its customers from September 26, 2015, to October 16, 2016. |161| A report by cybersecurity firm Fireeye stated that while Chinese cyber-attacks against U.S., European, and Japanese firms continued after the U.S.-China cyber agreement was reached, the overall level of cyber-intrusions have declined since mid-2014. Fireeye attributed the decline to military reforms in China, widespread exposure of Chinese cyber activity, and actions by the U.S. government. |162| However, CrowdStrike contends that the economic slowdown in China and the innovation goals of the 13th Five-Year Plan would likely continue to drive China's state-sponsored cyber espionage activities. |163|
China's Obligations in the World Trade Organization
Negotiations for China's accession to the General Agreement on Tariffs and Trade (GATT) and its successor organization, the WTO, began in 1986 and took over 15 years to complete. During the WTO negotiations, Chinese officials insisted that China was a developing country and should be allowed to enter under fairly lenient terms. The United States insisted that China could enter the WTO only if it substantially liberalized its trade regime. In the end, a compromise was reached that required China to make immediate and extensive reductions in various trade and investment barriers, while allowing it to maintain some level of protection (or a transitional period of protection) for certain sensitive sectors. China's WTO membership was formally approved at the WTO Ministerial Conference in Doha, Qatar, on November 10, 2001. On November 11, 2001, China notified the WTO that it had formally ratified the WTO agreements, and on December 11, 2001, it formally joined the WTO. |164| Under the WTO accession agreement, China agreed to do the following:
- Reduce the average tariff for industrial goods from 17% to 8.9%, and average tariffs on U.S. priority agricultural products from 31% to 14%.
- Limit subsidies for agricultural production to 8.5% of the value of farm output, eliminate export subsidies on agricultural exports, and notify the WTO of all government subsidies on a regular basis.
- Within three years of accession, grant full trade and distribution rights to foreign enterprises (with some exceptions, such as for certain agricultural products, minerals, and fuels).
- Provide nondiscriminatory treatment to all WTO members, such as treating foreign firms in China no less favorably than Chinese firms for trade purposes.
- End discriminatory trade policies against foreign invested firms in China, such as domestic content rules and technology transfer requirements.
- Implement the WTO's Trade-Related Aspects of Intellectual Property Rights (TRIPS) Agreement (which sets basic standards on IPR protection and rules for enforcement) upon accession.
- Fully open the banking system to foreign financial institutions within five years (by the end of 2006).
- Allow joint ventures in insurance and telecommunication (with various degrees of foreign ownership allowed).
Getting China into the WTO under a comprehensive trade liberalization agreement was a major U.S. trade objective during the late 1990s. Many U.S. policymakers at the time maintained that China's WTO membership would encourage the Chinese government to deepen market reforms, promote the rule of law, reduce the government's role in the economy, further integrate China into the world economy, and enable the United States to use the WTO's dispute resolution mechanism to address major trade issues. As a result, it was hoped, China would become a more reliable and stable U.S. trading partner. U.S. trade officials contend that in the first few years after it joined the WTO, China made noteworthy progress in adopting economic reforms that facilitated its transition toward a market economy and increased its openness to trade and FDI. However, beginning in 2006, progress toward further market liberalization appeared to slow. By 2008, U.S. government and business officials noted evidence of trends toward a more restrictive trade regime. |165| The USTR's 2015 report on China's WTO compliance summarized U.S. concerns over China's trade regime as follows:
Many of the problems that arise in the U.S.-China trade and investment relationship can be traced to the Chinese government' s interventionist policies and practices and the large role of state-owned enterprises and other national champions in China's economy, which continue to generate significant trade distortions that inevitably give rise to trade frictions. |166|
The 2015 report identified several priority areas of U.S. concern:
- Intellectual property rights and market access, including trade secrets, pharmaceutical patents, software piracy, online piracy, and counterfeit goods;
- Industrial policies, including "secure and controllable" ICT policies, indigenous innovation policies, technology transfer requirements, export restraints on raw materials, export subsidies, excess capacity in certain industries (e.g., steel and aluminum), value-added taxes on exports, support of "strategic emerging industries, |167| import bans on remanufactured products, discriminatory standards and technology policies, failure to join the WTO's GPA, investment restrictions, and use of trade remedy measures for retaliatory purposes;
- Restrictions on services, including electronic payments, theatrical films and audio-visual services, banking telecommunications, insurance, commercial Internet activities, express delivery, and legal services;
- Restriction on agricultural products, including sanitary and phytosanitary (SPS) measures on beef, pork and poultry, biotechnology approvals, and domestic support subsidies;
- Inadequate transparency, including in regard to publication of trade-related laws, regulations, notice and comment procedures (e.g., publishing draft laws for comment), and translation of all trade-related laws, regulations and other measures at all levels of government in one or more of the WTO languages; and
- Restrictive aspects of the legal framework, especially in regard to administrative licenses and China's competition policy.
The United States has utilized the WTO dispute settlement mechanism on a number of occasions to address China's alleged non-compliance with its WTO commitments. To date, it has brought 21 dispute settlement cases against China (or 54% of the total number of cases brought by all WTO members through January 2017). |168| The United States has prevailed (to various degrees) in each of the cases that have been ruled on by the WTO Dispute Resolution Body (DSB) and several have been resolved before going to a WTO panel. The most recent U.S. WTO cases brought against China's involve its domestic agricultural subsidies for rice, wheat, and corn, and its administration of tariff-rate quotas (TRQs) on the same crops (See Text Box). The 21 U.S. WTO cases against China are summarized in Table 8: |169| China in turn has brought more dispute settlement cases against the United States than any other WTO member: 10 (or 67% of total cases). A large share of China's complaints against the United States has been against U.S. antidumping and countervailing duty measures. In December 2016, China initiated a dispute resolution case against the United States for its continued treatment of China as a nonmarket economy for the purpose of calculating and imposing antidumping measures. |170|
The U.S. WTO Cases on China's Agricultural Policies
China's rapidly growing economy and expanding middle class have made it a major market for U.S. agricultural products. It was the second-largest U.S. export market in 2015 at $20.2 billion (about half of those exports were soybeans). |171| The United States is China's largest source of agricultural products. However, U.S. exporters have often faced numerous challenges selling their products to China. This stems in part from China's goal of obtaining self-sufficiency in several food groups and promoting and protecting its farmers. A report by the U.S. Chamber of Commerce released on November 11, 2016, estimated that U.S. agricultural exports to China could increase by an additional $17.6 billion (or 40%) from 2016 to 2025 if Chinese agricultural trade barriers were eliminated. |172|
The U.S. WTO dispute settlement case initiated in September 2016 challenges excessive use of subsidies for rice, wheat, and corn, which, according to USTR, together exceeded $100 billion over its WTO commitment levels. China has not fully disclosed the extent of its agricultural support programs. The Organization for Economic Co-operation and Development (OECD) estimates that Chinese support programs for farmers totaled $307 billion in 2015 were significantly higher than the next four largest support programs (out of 50 countries examined) in dollar terms, including the European Union ($90 million), the United States ($38.8 million), Indonesia ($36 million), and Japan ($33.5 million). China's producer support estimates (PSE) as a share of share of gross farm receipts rose from 12.4% in 2006 to 21.3% in 2015 (although it ranked seventh among the countries surveyed). China's total support estimate as a percentage of GDP rose from 1.4% in 1995-1997 to 3.1% in 2013-2015, even though agriculture production as a share of GDP fell. In addition, China's share in the agricultural value added of the countries covered in the report increased from 18% during 1995-1997 to 42% in 2013-2015. |173| The USTR's September 2016 press release on the WTO case against China's support program for rice, wheat, and corn contends that they significantly boost production in China beyond market levels and thus diminish Chinese demand for U.S. commodities. |174| The USTR's December 2016 press release regarding the WTO case on China's administration of TRQs for rice, wheat, and corn said that TRQ measures were "opaque and unpredictable" and restrict U.S. sales, citing an estimate by the U.S. Department of Agriculture that China would have imported an additional $3.5 billion worth of these crops if the TRQs were managed according to its WTO commitments. |175|
Table 8. Summaries of WTO U.S. Dispute Settlement Cases Against China
Date Initiated Issue Status/Outcome January 2017 Subsidies to Chinese aluminum producers Pending December 2016 Administration of tariff-rate quotas for rice, wheat, and corn Pending September 2016 Use of excessive domestic subsidies for rice, wheat, and corn Pending July 2016 Export duties on nine (later expanded to 15) different raw materials Pending December 2015 Hidden and discriminatory tax exemptions for domestic Chinese aircraft producers Pending February 2015 Measures providing subsidies contingent upon export performance to enterprises in several industries In April 2016, the two sides reached a Memorandum of Understanding. China agreed to remove WTO-inconsistent provisions. September 2012 Export subsidies to auto and auto parts manufacturers in China Pending July 2012 WTO-inconsistent use of antidumping and countervailing measures (duties of up to 21.5%) against certain imported U.S.-made vehicles In May 2014, WTO panel ruled several measures were inconsistent with China's WTO obligations. May 2012 Improper use of antidumping and countervailing duties on broiler products In August 2013, WTO panel found certain Chinese measures inconsistent with WTO obligations. In July 2014, China informed DSB that it had implemented the DSB rulings. U.S. disagreed with China's assertion and requested creation of WTO compliance panel, which was formed in July 2016. March 2012 Export restrictions on rare earths and two other minerals (separate cases brought by EU and Japan) Panel ruled several policies were inconsistent with WTO rules, which was largely upheld on appeal by China. In May 2015, China informed DSB it had implemented the ruling. December 2010 Government programs extending subsidies to Chinese wind power equipment manufacturers that use parts and components made in China rather than foreign-made parts and components On June 7, 2011, USTR announced China had agreed to end these subsidies, but noted that China had failed to fully report all of its subsidy programs. September 2010 Discrimination against U.S. suppliers of electronic payment services In 2012, USTR announced that the U.S. had largely prevailed in the ruling by a WTO dispute panel. In July 2013, China announced it had implemented the WTO's ruling, but the U.S. disagreed with that assertion and said it would continue to monitor China's actions. September 2010 Improper application of antidumping duties and countervailing duties on imports of grain oriented flat-rolled electrical steel from the United States In June 2012, a panel ruled largely in favor of U.S. position and this was generally upheld on appeal in October 2012. In December 2013, USTR stated that China had failed to remove the duties and in February 2014 requested a WTO compliance panel. That panel called on China to implement the WTO findings. In August 2015, China said that the duties had expired. June 2009 Export restraints on various raw materials In July 2011, a panel found that China's export taxes and quotas on raw materials violated its WTO commitments and this ruling was largely upheld on appeal. In January 2013, China reported that it implemented the ruling. December 2008 Export subsidies for Chinese "Famous Chinese" brands programs In December 2009, the USTR announced that China had agreed to eliminate these programs. March 2008 Discriminatory treatment of U.S. suppliers of financial information services in China In November 2008, the USTR announced that China had agreed to eliminate discriminatory restrictions. April 2007 Noncompliance with the WTO TRIPS agreement, namely in terms of its enforcement of IPR laws In January 26, 2009, the WTO ruled that many of China's IPR enforcement policies failed to fulfill its WTO obligations. In June 2009, China announced that it would implement the WTO ruling by March 2010. April 2007 Failure to provide sufficient market access to IPR-related products, namely in terms of trading rights and distribution services In August 2009, a panel ruled that many of China's regulations on trading rights and distribution of films for theatrical release, DVDs, music, and books and journals were inconsistent with China's WTO obligation and this was largely upheld on appeal. In February 2010, China stated that it would implement the WTO's ruling. February 2007 Government regulations giving WTO-inconsistent import and export subsidies to various industries in China In November 20007, China agreed to eliminate the subsidies in question by January 1, 2008. March 2006 Discriminatory regulations on imported auto parts, which often applied the high tariff rate on finished autos (25%) to certain auto parts (which normally averaged 10%) In February 2008, a panel ruled that China's discriminatory tariffs were inconsistent with its WTO obligations. China appealed the decision, but a WTO Appellate Body largely upheld the WTO panel's decision. In August 2009, China said it had implemented the decision. March 2004 Discriminatory tax treatment of imported semiconductors The USTR announced in July 2004 that China had agreed to end its preferential tax policy, and in October 2005, both sides announced that the issue had been resolved. However, the USTR expressed concerns over new forms of financial assistance given by the Chinese government to its domestic semiconductor industry. Source: WTO and USTR press releases.
Note: Cases summarized by CRS.China's Currency Policy
Unlike most advanced economies, China does not maintain a market-based floating exchange rate. For several years, China pegged its currency directly to the U.S. dollar. Each day China's central bank announced a central rate of exchange between the renminbi (RMB) and the dollar and would buy and sell as much currency as needed to reach a targeted exchange rate within a specific band. In order to maintain the targeted exchange rate with the dollar (and other currencies), the Chinese government imposed restrictions and controls over capital flows in and out of China. |176| Currency intervention by the Chinese government in the past contributed to a sharp rise in Chinese foreign exchange reserves, some of which were invested in U.S. dollar assets, such as U.S. Treasury securities.
Starting around 1998, the Chinese government set the central target exchange rate at around 8.28 yuan (the base unit of the RMB) per dollar, and this rate was generally maintained consistently through June 2005. |177| Many Members of Congress around this time argued that China's currency intervention constituted a de facto subsidy that contributed to a sharp rise in U.S. imports from China (hence spiking the U.S. trade deficit with China) and negatively affected some U.S. industrial sectors, and many Members called on the U.S. Department of the Treasury to designate China as a "currency manipulator" in its biannual report to Congress on exchange rates.
Due in part to pressure from its trading partners, including the United States, the Chinese government in July 2005 announced reforms to its currency policy. China immediately appreciated the RMB to the dollar by 2.1% and moved to a "managed float" exchange rate system, based on a basket of major foreign currencies that included the U.S. dollar and other major currencies (although the composition of that basket has not been made public).
From July 2005 to July 2008, the official exchange rate went from 8.27 to 6.83 yuan per dollar. However, once the effects of the global financial crisis became apparent, the Chinese government halted its appreciation of the RMB and subsequently kept the yuan/dollar exchange rate relatively constant at 6.83 from July 2008 to June 2010 in order to help limit the impact of the sharp decline in global demand for Chinese products. Currency appreciation was resumed in June 2010, although at a slower pace than in previous years. From June 2005 through July 2015, the RMB appreciated by 35.3% on a nominal basis against the dollar. |178|
On August 11, 2015, China's central bank announced that it was taking new measures to improve the market-orientation of its daily central parity rate of the RMB. However, over the next three days, the RMB depreciated against the dollar by 4.4% (it went from 6.12 yuan to 6.40 yuan). From July 2015 to mid-December 2016, the RMB depreciated by 13.6%% against the U.S. dollar (see Figure 15). |179|
Some analysts have viewed the RMB's depreciation against the dollar and other major currencies as a reflection of China slowing economy, especially in regard to exports. China's merchandise exports fell by 2.7% in 2015 over the previous year and by 6.3% during the first eight months of 2016 year-on-year. In addition, China's foreign exchange reserves have fallen sharply, over the past few years, an indicator that the Chinese government may be intervening to prevent or slow the depreciation of the RMB (rather than prevent appreciation, which occurred in the past). Other analysts contend that the Chinese economy may be in worse shape than acknowledged by the government and hence the depreciating RMB, they argue, may be a deliberate policy to boost economic growth at the expense of its trading partners. Some Members of Congress have criticized China's currency policies, arguing that they reinforce the need to include currency provisions in future U.S. free trade agreements. At a speech in September 2015, Chinese President Xi stated that "given the economic and financial situation at home and abroad, there is no basis for continuous depreciation of the RMB." |180| In April 2016, China agreed to language in the G-20's Finance Ministers and Central Bank Governors meeting's communique that members would "avoid competitive devaluation and not target the exchange rate for competitive purposes." |181|
Figure 15. RMB-Dollar Exchange Rates: January 2015 to December 2016
(yuan per U.S. dollar)
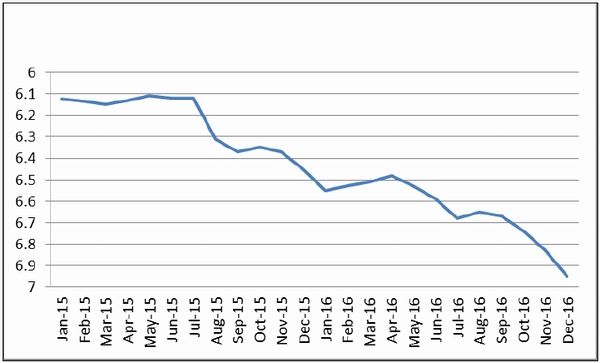
Source: Bank of China "middle rate."
Notes: January 2015 to November data are monthly averages. December data is for December 16, 2016. Graph inverted for illustrative purposes.Opinions on the RMB's valuation against the dollar and other currencies differ. The International Monetary Fund (IMF) in May 2015 assessed the RMB to be "no longer undervalued" and in July 2016 it stated that the RMB was "assessed as broadly in line with fundamentals." In its April 2015 report on exchange rates, the U.S. Department of the Treasury said that the RMB remained "significantly undervalued." Treasury's October 2015 report noted that China had intervened heavily in exchange rate markets from July to September 2015 to prevent the RMB from further depreciating and that market forces were currently pushing the RMB downward, but concluded that the RMB remained "under its appropriate mid-term valuation."
In February 2016, the Trade Facilitation and Enforcement Act of 2015 (P.L. 114-125) went into effect. It included several new provisions on monitoring and addressing foreign exchange rates and listed new enhanced factors for the Department of the Treasury to consider when determining if any country should be listed as currency manipulators in its semi-annual report. |182| Treasury established certain benchmarks to determine which countries would be subject to enhanced analysis (and subject to a monitoring list), including those having a bilateral trade surplus larger than $20 billion, having a current account surplus of more than 3% of GDP, and engaging in persistent one-sided intervention in foreign exchange markets resulting in net purchases equal to 2% or more of GDP over the past year. The law also established new remedies in regard to countries that do not adopt appropriate policies to correct the identified undervaluation and surpluses, prohibitions of financing by the Overseas Private Investment Corporation (OPIC) in that country, |183| restrictions on U.S. government procurement, additional efforts by U.S. officials to urge IMF action, and taking into account such currency policies before initiating or entering into any bilateral or regional trade agreement negotiations.
China met two out of the three criteria (large trade surplus and current account surplus at over 3% of GDP) for enhanced analysis in Treasury's April 2016 report. The report urged China to continue to rebalance the economy by boosting private consumption and said that "the RMB should continue to experience real appreciation over the medium-term." Treasury's October 2016 report stated that China had met only one of the criteria (large trade surplus), but went on to say that "despite the recent downward pressure on the RMB, the Chinese currency is still 21 percent stronger than the dollar since December 2005, and 38 percent stronger on a real, trade-weighted basis," and projected that the RMB is likely to continue to trend stronger over the medium to long term. |184|
U.S. officials have urged China to continue efforts to rebalance its economy by boosting consumer demand (which would increase import demand) and decreasing the reliance on exports and fixed investment for economic growth. They argue that doing so would enable the Chinese government to move more quickly toward adopting a market-based exchange rate since the creation of new jobs in the nontrade sector would offset job losses in the trade sector.
Numerous bills have been introduced in Congress over the past several years that have sought to induce China to reform its currency policy or would attempt to address the perceived effects that policy has on the U.S. economy. For example, one bill in the 108th Congress would have imposed an additional duty of 27.5% on imported Chinese products unless China appreciated its currency to near market levels. In the 111th Congress, the House passed an amended version of H.R. 2378, which would have made certain misaligned currencies (such as the RMB) actionable under U.S. countervailing duty cases on foreign government export subsidies (although the Senate did not take up the bill). In the 112th Congress, the Senate passed S. 1619, which would have provided for the identification of fundamentally misaligned currencies and required action to correct the misalignment for certain "priority" countries. In the 114th Congress, H.R. 820 and S. 433 would seek to treat certain undervalued currencies as an actionable subsidy under U.S. countervailing laws. Exchange rate values also became part of the debate in Congress over the Trans-Pacific Partnership (TPP) agreement as well as the extension of Trade Promotion Authority (TPA), although these were not necessarily China-specific. |185|
The U.S.-China Strategic and Economic Dialogue
On September 29, 2006, President George W. Bush and Chinese President Hu Jintao agreed to establish a Strategic Economic Dialogue (SED) to have discussions on major economic issues at the "highest official level." According to a U.S. Department of the Treasury press release, the intent of the SED was to "discuss long-term strategic challenges, rather than seeking immediate solutions to the issues of the day," in order to provide a stronger foundation for pursuing concrete results through existing bilateral economic dialogues. |186| The first meeting was held in December 2006. Four subsequent rounds of talks were held (the last was in December 2008).
While attending the G-20 summit in London on the global financial crisis on April 1, 2009, President Obama and Chinese President Hu agreed to continue the high-level forum, renaming it the U.S.-China Strategic and Economic Dialogue (S&ED). The new dialogue is based on two tracks. The first (the "Strategic Track") is headed by the Secretary of State on the U.S. side and focuses on political and strategic issues, while the second track (the "Economic Track") is headed by the U.S. Treasury Secretary on the U.S. side and focuses on financial and economic issues. Areas of discussion include economic and trade issues, counterterrorism, law enforcement, science and technology, education, culture, health, energy, the environment (including climate change), nonproliferation, and human rights.
Eight sessions were held under the S&ED. One of the reported benefits of the U.S-China S&ED process is that it brings together top economic officials from both sides (as well as U.S. Cabinet officials and Chinese heads of ministries) on a regular basis, which enables both sides to identify their major positions and priorities on various issues and to develop long-term working relationships. Some in Congress have criticized the S&ED forum, arguing that it produces few concrete results, and that many of the results described in subsequent fact sheets that are jointly issued simply restate agreements or pledges China has already made. Others counter that U.S. engagement with China occurs on multiple levels throughout the year and that the S&ED meetings are in part a cumulative result of this process. In addition, the two sides hold annual meetings under the JCCT, established in 1983, which focuses primarily on bilateral trade and investment issues. The JCCT maintains 16 working groups that meet throughout the year and cover such issues as IPR, information technology, pharmaceutical and medical devices, statistics, commercial law, agriculture, and trade and investment.
Some analysts have argued that the S&ED structure should be reformed. For example, a report by the Center for Strategic and International Studies (CSIS) argues that ceremony has come to overwhelm substance in the S&ED, that pressure for short-term deliverables at each event has detracted from the dialogue's objective of fostering long-term strategic cooperation, and that the structure of the S&ED has undermined the efforts of individual agencies to work on critical elements of the relationship. |187| Others have complained about the lack of benchmarks in the S&ED process to evaluate outcomes of China's commitments. Others complain that the S&ED process often fails to achieve results on major issues. For example, at the July 2013 S&ED, China made no specific commitment on halting cyber theft. A summary of S&ED outcomes can be found in "S&ED Outcomes." The next Administration and the Chinese government will need to determine whether the S&ED should continue and what, if any changes, should be adopted to improve the process.
Concluding Observations
China's rapid economic growth and emergence as a major economic power have given China's leadership increased confidence in its economic model. The key challenges for the United States are to convince China that (1) it has a stake in maintaining the existing international trading system and rules, which are largely responsible for its economic rise, and to take a more active leadership role in maintaining that system; and (2) further economic and trade reforms are the surest way for China to expand and modernize its economy. For example, by boosting domestic spending and allowing the value of its currency to be determined by the market, China would likely import more, which would help speed economic recovery in other countries, promote more stable and balanced economic growth in China, and lessen trade protectionist pressures around the world. Improving IPR protection in China and providing nondiscriminatory treatment to foreign IP firms would likely foster greater innovation in China and attract more FDI in high technology than has occurred under current policies. Lowering trade barriers on imports could increase competition in China, lower costs for consumers, and boost economic efficiency. Some observers contend that reformist-minded officials in China will continue to push for greater free-market reforms, while others argue that vested interests in China (such as SOEs and export-oriented firms) who benefit from the status-quo may make further economic reforms more difficult to realize in the short term.
There are a number of views in the United States over how to more effectively address commercial disputes with China.
- Take a more aggressive stand against China, such as by increasing the number of dispute settlement cases brought against China in the WTO, threatening to impose trade sanctions against China unless it addresses policies (such as cyber theft of U.S. trade secrets) that hurt U.S. economic interests, and making greater use of U.S. trade remedy laws (such as antidumping and countervailing measures) to address China's "unfair" trade practices.
- Intensify bilateral negotiations with China to liberalize trade through existing high-level bilateral dialogues, such as the U.S.-China S&ED and JCCT, and seek to complete the BIT.
- Pursue multilateral and plurilateral trade agreements that include China. Examples include the expansion of the WTO's 1996 Information Technology Agreement (ITA) that was concluded in December 2015 by 53 countries, covering 201 ICT products (see Appendix B); the Environmental Goods Agreement (EGA), which is being negotiated by 17 WTO members and is focused on reducing tariffs on 54 products that benefit the environment; and China's negotiations to join the WTO's procurement agreement (GPA) that currently consists of 47 WTO members. The United States is also currently negotiating with 22 other countries to reach a Trade in Services Agreement (TiSA). China is not a party to these talks, but has expressed interest in joining them. Some reports indicate that the United States has opposed China's participation. |188|
Appendix A. Chinese Policies to Boost Innovation |189|
Made in China 2025
On May 19, 2015, the Leading Group for Creating a Strong Manufacturing Country, a task force created by China's State Council, released the Made in China 2025 initiative. Made in China 2025 is a comprehensive plan to upgrade the Chinese manufacturing sector, focused largely on making intelligent information and communications technology (ICT)-based machines, systems, and networks manage the industrial process, otherwise known as "smart production." |190| China's slowing economy and the unsustainability of its "growth at any costs" model have led the government to focus on new sources of growth, such as promoting innovation.
In 2015, Chinese economic growth slowed to 6.9%, its lowest growth rate in the past 25 years, raising concerns about the strength of the Chinese economy. China's Purchasing Managers' Index (PMI), an indicator of conditions in the manufacturing economy, rose to 50.6 in July 2016, the first strengthening in the health of the manufacturing sector since February 2015. |191| China's PMI has strengthened since July 2016, rising to a two-year high of 51.2 in October 2016. |192| In the past few years, other Southeast Asian countries such as Vietnam and Indonesia have reportedly intensified their efforts to focus on manufacturing, which has slowly diverted some streams of manufacturing to those countries. According to the South China Morning Post, China still lags behind the developed world; although it is the second-largest manufacturing sector in the world, China is still a relatively weak manufacturer when it comes to core technology and innovation. |193| The innovation gap, desire to avoid the middle-income trap, |194| and the slowing economy have all reportedly pushed the Chinese government to pursue the Made in China 2025 plan, moving the manufacturing sector up the value chain, and moving from "Made in China" to "Made by China." |195|
Priorities
The Made in China 2025 plan was the first of a "three step" strategy involving 10-year national plans to transform China into a leading high-value manufacturing economy by 2049, which will mark the 100th anniversary of the founding of the People's Republic of China (PRC). According to the Minister of Industry and Information Technology, Miao Wei, "By 2025, China will basically realize industrialization nearly equal to the manufacturing abilities of Germany and Japan at their early stages of industrialization." |196|
The goals of Made in China 2025 are split into four key categories: innovation, quality efficiency, smart manufacturing, and green development. There are 9 priority tasks, 10 sectors, and 5 definitive projects with timelines that can be sorted into those four categories. The nine priority tasks laid out in Made in China 2025 include improving manufacturing innovation, integrating technology and industry, strengthening green manufacturing, promoting breakthroughs in 10 key sectors, advancing restructuring of the manufacturing sector, promoting manufacturing-related service industries, and internationalizing manufacturing. The 10 key sectors identified include new information technology, numerical control tools and robotics, aerospace equipment, ocean engineering equipment and high-end vessels, high-end rail transportation equipment, energy saving and new energy vehicles, electrical equipment, and agricultural machinery. |197| Within Made in China 2025, there are also five projects with definitive goals and timelines: |198|
- Construction of 15 manufacturing innovation centers by 2020, with 40 by 2025.
- Creation of 1,000 green demonstration factories and 100 green demonstration zones by 2020 and reduced primary pollution emissions by 20%.
- Decreased operating costs for smart manufacturing pilot projects by 30%, shortened production timelines by 30%, and lower rates of defective products by 30%, with decreased costs, timelines, and defects by another 20% by 2025.
- Increased self-sufficiency in development infrastructure by 40% of infrastructure components and key infrastructure materials by Chinese sources by 2020, with an increase to 80% by 2025.
- New indigenous research and development (R&D) in key sectors by 2020, and to achieve significant market share growth in indigenous IP for high-value equipment by 2025.
Made in China 2025 also references strengthened security reviews for investment, mergers and acquisitions, and procurement in manufacturing sectors that are related to national economy and national security; promoting indigenous or domestic innovation; enlarging tax policies for smart manufacturing, and enhancing cooperation with foreign companies in areas such as health care, aviation, and basic manufacturing.
The plan calls for Chinese firms to invest abroad, to become familiar with overseas cultures and markets, and to strengthen investment and operation risk management before investing. According to a report by CSIS, if China genuinely decides to embrace intelligent manufacturing, it could become easier for Chinese companies and multinational corporations (MNCs) to collaborate both in China and abroad and possibly "reduce the zero-sum elements of the business relationship." |199| In addition, if China successfully upgrades its manufacturing capacities, there is also a likely chance of improved overall economic governance, including financial and fiscal systems, a strengthened educational system, and increased access to varied sources of information.
The Made in China 2025 is one component of China's plan to become a center and leader of innovation. Deputy Head of the Ministry of Industry and Information Technology Li Beiguang said that the key to a country becoming a manufacturing power is innovation, and "to promote manufacturing and national competitiveness, it is important to mobilize every conceivable element to stimulate innovation rather than simply support a single industry." |200|
Issues
Made in China 2025 has faced criticisms on its viability. Some analysts say that China will succeed with its more modest goals, such as the immediate aims to improve the quality, productivity, digitization, and expansion of numerically controlled machines, which are all already used by manufacturers in developed countries. However, they contend that other goals such as encouraging companies to use 3D printing and adopting robotics are or may be unrealistic.
Trade Implications
The ambiguity surrounding language in Made in China 2025 objectives may impact foreign MNCs that operate within China and interact with Chinese companies globally. Made in China 2025 mentions "strengthened security reviews" for investments, mergers and acquisitions, and procurement in manufacturing areas related to the national economy and national security, which are not clearly defined. Language in the Made by China 2025 plan also seeks to boost indigenous innovation. For example, it lists the goal of ensuring that domestic Chinese firms will handle the majority of local infrastructure development with specific timetables. For example, the plan states that 40% of core infrastructure components and key infrastructure materials should come from Chinese sources by 2020 and be 2025, to increase further to 80% by 2025. |201| This has led to concerns that such goals will be used to discriminate against foreign firms.
Internet Plus
The Internet Plus plan was announced to the National People's Congress on March 5, 2015, by Premier Li Keqiang, as part of the Report on the Work of the Government (2015), with a follow-up implementation plan issued by the State Council on July 4, 2015. |202| With 721 million users as of 2016, China has the largest absolute number of people in the world using the Internet. |203| The plan reportedly came out of an effort to push for more innovation, as many Chinese leaders view innovation as the key to avoid the middle-income trap and because there is still a prevailing idea in China, especially in the rural regions, that enterprises in the traditional sectors do not know how to link their businesses to the Internet. |204| According to the United States Information Technology Office, launched in cooperation with the Department of Commerce's International Trade Administration, China's Internet Plus seeks to "drive economic growth by integration of Internet technologies with manufacturing and business." |205|
Goals
In his speech on the Internet Plus plan during the 2015 Report on the Work of the Government, Premier Li Keqiang described the plan as such: "We will develop the 'Internet Plus' action plan to integrate the mobile Internet, cloud computing, big data, and the Internet of Things with modern manufacturing, to encourage the healthy development of e-commerce, industrial networks, and Internet banking, and to guide Internet-based companies to increase their presence in the international market. In addition to the 40 billion yuan government fund already in place for investment in China's emerging industries, more funds need to be raised for promoting business development and innovation." |206| Premier Li reiterated these points in the 2016 Report on the Work of the Government, but also highlighted the need to improve the efficiency of communication between governmental departments to cut down on "red tape." |207|
Internet Plus has four primary goals: (1) upgrade and strengthen the security of the Internet infrastructure, (2) expand access to the Internet and related technologies, (3) make social services more convenient and effective, and (4) increase both the quality and effectiveness of economic development. |208| The plan also maps development targets and supportive measures for key sectors such as mass entrepreneurship and innovation, manufacturing, agriculture, energy, finance, public services, logistics, e-commerce, traffic, biology, and artificial intelligence. |209| In order to achieve these goals, the Chinese government will reportedly clear barriers and lower limits for the market entry of Internet Plus-related products, optimize the credit system, and draft a big data strategy and promote legal services for companies that pursue the Internet Plus system. The government has also expressed interest in training and making better use of local and foreign talent, providing financial support and tax preferences to key projects, launching more pilot zones, encouraging innovation demonstration zones, and encouraging local governments to come up with their own plans aligned to Internet Plus. Chinese authorities have also promised that families in large cities will have access to 100 megabyte-per-second Internet, and that broadband services will reach 98% of the population living in incorporated villages. According to the Seconded European Standardization Expert in China (SESEC), a project co-financed by the European Union, the Chinese government has created a new investment fund worth 40 billion RMB, or approximately $6 billion, to further promote new industry innovation and entrepreneurship under Internet Plus. |210|
Internet Plus is intertwined with other economic plans outlined by the Chinese government. For example, a goal of Internet Plus was to increase the percentage of research and development spending as part of GDP from 2.1 to 2.5, a goal that is restated in the 13th Five-Year Plan. |211| The Chinese government has also tied Internet Plus to the "One Belt One Road" initiative, an effort to boost development and economic connectivity across three continents, encouraging Chinese Internet companies to increase their efforts in the global market.
Issues
The release of Internet Plus and Made in China 2025, and the notable mention of both plans in the 13th Five-Year Plan, are all efforts by the Chinese government to increase the growth rate of the economy. Within Internet Plus, there is an emphasis on innovation that the government believes will result from the integration of the Internet with economic and social sectors and that an increasing trend of innovation will benefit from government intervention. Some experts raise concerns about a "helping hand," contending that government intervention could slow the beneficial effect start-ups have on the economy. Gordon Chang in a Forbes Magazine article, for example, contends: "Perhaps the worst thing for tech companies is direct government support, which means meddling by central, provincial, and local officials." |212| Chang also pointed out that new e-commerce companies, like the ones that Internet Plus aims to create, may be net job-destroyers by contributing to the closing of "brick-and-mortar" shops and that many of these new companies may be "zombie shops." Press reports point out the lack of mention of "freedom of the Internet" in Internet Plus, leading them to question how strict Internet censorship would be, especially with the trend of increased censorship since Xi Jinping became president in 2012. |213| They also mention that if Beijing continues to censor access to information, Internet Plus may increase consumer shopping, instead of having any significant and long-term impact on the economy.
Analysts have also criticized the implementation of Internet Plus. Internet Plus places a large emphasis on modernizing the agricultural sector of the economy, but agencies tasked with overseeing the implementation of Internet Plus for agriculture include the Ministry of Agriculture; the National Development and Reform Commission; the Ministry of Science and Technology; the Ministry of Commerce; the General Administration of Quality Supervision, Inspection, and Quarantine; the China Food and Drug Administration; and the State Forestry Administration. A lack of coordination could lead to problems with Internet Plus including, but not limited to, misallocation of state resources, redundant or contradictory policies, and opportunities for local officials to exploit policy overlaps for their own profits. |214|
Implications
There are both positive and negative implications for the United States if Internet Plus is implemented as the Chinese government intends it. Seconded European Standardization Expert in China (SESEC) notes that transforming and upgrading key sectors could open up new sectors, highlighting the example of how mobile Internet reforms promoted the development of taxi-hailing apps in a previously closed vehicle transportation and operation market. If Internet Plus is successful, an example of a possible sector that could open up is the agriculture industry, as there has been some emphasis on modernizing the sector, specifically moving from network sale sectors like e-commerce to the production sector. |215|
Some analysts speculate that Internet Plus could increase censorship, further closing off high-tech sectors from China and halting innovation. During the announcement of Internet Plus, Premier Li Keqiang mentioned more precise web management to "clean up illegal and bad information" to "strengthen the struggle against enemies in online sovereign space and increase control of online public sentiment." |216| In its 2016 U.S.-China Business Council (USCBC) Recommendations for the U.S.-Joint Commission on Commerce and Trade (JCCT), USCBC recommended ensuring "that regulations calling for 'secure and controllable,' 'secure and reliable,' and similarly worded standards included in existing policy documents do not discriminate against foreign companies or procurement of foreign IT equipment and do not create unnecessary requirements that will not enhance the security of networks." |217|
National Informatization Development Strategy
On August 31, 2015, China released its "National Informatization Development Strategy," |218| or big data development plan. |219| In July 2016, China released its Outline of the National Informatization Development Strategy, a guiding document that explains the regulations and direction of information-based development in China over the next 10 years. |220|
According to the United States Information Technology Office, the outline calls for core information technology, such as integrated circuits and basic software, to create a core technology system; strengthens IPR and standards; improves protection regulations for IPR; calls for implementation of a multi-level classification information management system; accelerates the lawmaking process for relevant policies; emphasizes the importance of international cyberspace development and administration cooperation; implements network identity administration regulations; and tightens control over all Internet news services and platforms. |221| The outline also emphasizes the leadership of the Central Network Security and Informatization Leading Group, led by President Xi Jinping.
The outline sets targeted goals for the next 10 years, with targets that will be reached by both 2020 and 2025. By 2020, China wants to strengthen its domestic industry by specifically focusing on certain core technologies, |222| provide Internet access to an additional 350 million people, expand 3G and 4G services, and achieve breakthroughs in 5G technology. By 2025, China wants to further improve household fixed-broadband connectivity rates, build a leading mobile telecommunications network, and increase information consumption values to 12 trillion RMB (U.S. $1.79 trillion) and e-commerce trading values to 67 trillion RMBn (U.S. $10 trillion). |223|
Implications
The National Informatization Development Strategy builds upon the ICT and big data goals set in the 13th Five-Year Plan, Internet Plus, and Made in China 2025. However, as some have noted, the outline differentiates itself from the other goals set in these other plans, in its bolder goals and nationalistic framing of the goals. |224| The strategy further emphasizes the need for China to strengthen its domestic industry, easing its dependence off of foreign sectors.
Efforts to Promote an Indigenous Semiconductor Industry
In June 2014, the Chinese government released a plan called "Guidelines to Promote National Integrated Circuit Industry Development." A year later, the government announced an investment of 1 trillion RMB, or 161 billion USD, in the domestic semiconductor industry to be developed over the next 10 years. |225| The guidelines to improve the semiconductor industry are split into three main strategies: mergers and acquisitions (M&A), market power, and regulation. According to the United States International Trade Administration, "the Chinese government appears to be driven by a desire to acquire know-how in all segments of the semiconductor supply chain," resulting in heavy recruitment of foreign talent by the Chinese government. |226| China wants to "catch up technologically" with other leading semiconductor firms by 2030 and produce 70% of the chips consumed by the Chinese industry. |227|
China purchases over half of all semiconductors produced each year globally, but lacks the capabilities in its domestic semiconductor industry to back up its consumption. In 2014, China accounted for 56.6% of global consumption of semiconductors, and its demand grew at an 18.8% compounded annual growth rate between 2003 and 2014. |228| In order to build up domestic industries and promote indigenous innovation, China wants to lessen its dependency on U.S. technology, especially in the semiconductor industry. Chinese consumption of semiconductors in 2015 was 9% domestically produced and 91% foreign, of which 56.2% was made in the United States, while domestic Chinese chips account for less than one-tenth of local demand. |229| Globally, China makes up 4% of global semiconductor sales, and views its reliance on foreign companies as a national security concern.
Issues
Analysts have compared the Chinese ambitions to the rise of the Taiwanese semiconductor industry, but point out differences between the two situations. According to The Economist, Taiwan was able to succeed because they entered the market during an industry shift to a model that separated the design and fabrication of the chip. However, when Taiwan tried to enter the market for memory chips, it failed due to the lack of a transitional period in the industry. Currently, the global semiconductor industry is facing a period of relatively slow growth. This, in combination with the maturing of the global semiconductor industry, or the increased complexity of semiconductor chips and their associated software, could, some argue, make it more difficult for Chinese firms to succeed. |230|
Other criticisms include the methods and goals that China has undertaken to develop its semiconductor industry. As of March 2016, China, through its Integrated Circuit (IC) Industry Investment Fund, has invested 43 billion RMB (6.61 billion USD) into expanding its semiconductor industry, with much of the money going toward mergers and acquisitions. |231| Analysts note that simply acquiring the technology will not help improve China's competitiveness in the long run, but will only increase the profit margin for China temporarily. Intel alone spends four times as much on research and development on its semiconductors as the entire Chinese chip industry. |232|
The emphasis on increasing domestic demand for domestically made chips is also a concern. Some analysts note that the emphasis on domestically made chips assumes that Chinese firms will buy Chinese-produced microchips because they are made in China, disregarding the idea that the same firms might buy foreign microchips because they are of better quality. |233| If Chinese-produced microchips are of lesser quality, but the Chinese government guides companies toward buying domestically made products, China could end up with a domestic industry that lacks global competitiveness. A government mandate for Chinese high tech firms to use Chinese-made chips could also undermine their global competitiveness as well.
Implications
The United States is a leading actor in the global semiconductor industry, and has great interest in Asia, with U.S. semiconductor exports to the broader Asia-Pacific region representing 85% of total U.S. semiconductor goods exports in 2014 at $36.5 billion. Between 2014 and 2015, semiconductor exports grew from $8.03 billion to $8.45 billion, a growth of 5.2%; 82% of all semiconductor products produced in the United States are sold to customers overseas, supporting 250,000 U.S. jobs and an additional 1 million jobs in related sectors. In 2015, U.S. companies accounted for 50% of total semiconductor sales. |234| The Department of Commerce's International Trade Administration views policies promoting Chinese domestic industries as "potentially discriminatory" and posing "real long-term threats to not only U.S. firms but the entire semiconductor ecosystem." |235|
In the short term, some note that there will be larger investment in both U.S. and foreign companies that develop semiconductors, but in the long term, it is possible that once Chinese companies have the intellectual property, there could be less reliance on U.S. companies. In January 2016, the Chinese provincial government of Guizhou and U.S. firm Qualcomm signed an agreement to form a new joint venture (with an initial registered capital of $280 million), focusing on the "design, development and sale of advanced server chipset technology in China." The Guizhou provincial government investment arm will have a 55% controlling share. |236| Qualcomm will provide investment capital, license its server technology to the joint venture, and assist with R&D process and implementation expertise.
If China successfully develops its semiconductor industry, it may enjoy a bigger share of the global electronics industry's profits, as profit margins for successful semiconductor firms are around 40% or more. Analysts say that there will be a continuation of strong but slowing growth in demand for semiconductors by China and a large increase in their demand for semiconductor manufacturing equipment in the short term as China continues to develop their industry. |237|
On January 2017, the President's Council of Advisors on Science and Technology issued a issued a report on U.S. semiconductor innovation, competitiveness, and security, which warned that a "concerted push by China to reshape the market in its favor, using industrial policies backed by over one hundred billion dollars in government-directed funds, threatens the competitiveness of U.S. industry and the national and global benefits it brings" and that such policies "put U.S. national security at risk." |238|
Appendix B. Plurilateral Agreements
This section provides an overview of three plurilateral trade agreements in the World Trade Organization (WTO) that involve both the United States and China: the Information Technology Agreement (ITA), the Environmental Goods Agreement (EGA), and the WTO's Government Procurement Agreement (GPA).
The WTO Information Technology Agreement |239|
The Information Technology Agreement (ITA) was first concluded in 1996 and provided tariff-free treatment for a specific list of information technology (IT) and telecommunications products. It was a plurilateral agreement applied on a most-favored nation (MFN) basis, in which all WTO members benefitted from the tariff cuts. The original ITA had 29 parties (eventually expanded to 82) and represented about 97% of the world trade in IT products.
Negotiations to expand the ITA (ITA-2) to cover new products began in June 2012, and concluded in December 2015, after 17 rounds of negotiations. ITA-2 was agreed to by 24 participants representing 53 WTO members |240| and covers an additional 201 ICT products valued at over $1.3 trillion a year and accounting for 7% of the total global trade, according to the WTO. The parties in ITA-2 account for approximately 90% of the world trade in the products covered in the expanded agreement. The products include new generation semiconductors, semiconductor manufacturing equipment, optical lenses, GPS equipment, medical equipment such as magnetic resonance imaging products, and ultra-sonic scanning apparatuses.
ITA-2 eliminates the tariffs for the 425 eight-digit tariff line items agreed to under the expansion. According to the USTR, it increases monetary gains for the IT industry due to the elimination of import duties; improves market access, predictability, and certainty for investors and traders; and prevents participating members from legally imposing import duties on covered products. The tariff reductions began in July 2016, with some being implemented immediately and others to be phased in in three, five, and seven years. ITA-2 also implies a commitment by all signatories to tackle non-tariff barriers in the IT sector in the future, and for all signatories to keep a list of products under review to determine if future expansions are needed. Prior to the ITA-2 conclusion, U.S. and Chinese tariffs on the tariff items averaged 1.2% and 5.8%, respectively (see Figure B-1).
Figure B-1. Current MFN Duty Levels on Products Covered in ITA-2
(percentage)
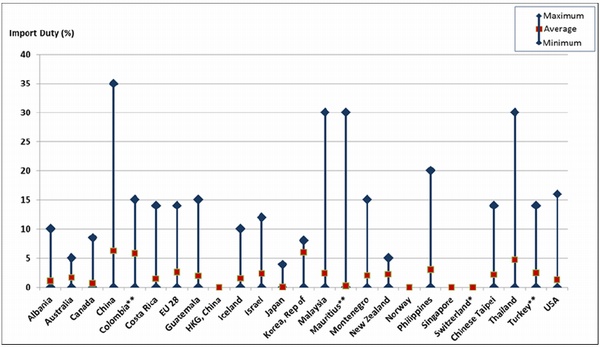
Source: World Trade Organization.
Note: Based on HTS 6 digits before the implementation of ITA-2.China's Position
China is the leading exporter of IT products in the world, followed by the United States and Singapore. Many observers in the United States and the European Union attributed the lengthiness of the negotiations to China's perceived intransigence, but China has also blamed the United States for the breakdown in negotiations. Chinese Minister of Commerce Gao Hucheng stated that "the development level of the participants are different, so it is normal that they have different interest demands for products. But United States' terms were far beyond the bearing capacity of China's industry, and this is the basic reason why the negotiations have not reached agreements." |241|
Negotiations on the products that would be included in ITA-2 were resolved on July 28, 2015, through the "Declaration on the Expansion of Trade in Information Technology Products." The final tariff schedules for all products covered under ITA-2 were due on October 30, 2015, but negotiations continued until December 16, 2015, when 24 countries negotiating ITA-2 reached a compromise on the "critical mass" issue, or a provision that would allow countries to withdraw their tariff cuts if the parties at any time represent less than a critical mass, or 90% of trade in the covered products. |242| The 24 countries in the negotiation, including the United States and China, eventually agreed on non-binding compromise language that will commit members to hold discussions in the future if the membership of ITA-2 no longer represents a critical mass.
During the negotiations, U.S. industry officials argued that China stood to benefit the most from an ITA-2 since it was the largest importer of ICT, estimated at $414 billion in 2014. |243| China countered this argument, with Chinese Ambassador to the WTO Yu Jianhua complaining that once the ITA expansion was completed, China would lose over $27 billion in tariff revenues. He also said that "many industries in China are still in a critical growth stage" and that "it is reasonable to have some sensitive products which should be allowed for exclusion." |244|
The 201 products agreed to in ITA-2 covere 425 eight-digit tariff lines. Out of the 425 eight-digit tariff lines, China has bound tariffs for 159 products. Of the remaining 266 lines, 102 of them (38%) are subject to a five-year phaseout, 50 (19%) are subject to a seven-year phaseout, and the remaining 114 (43%) will be phased out immediately or within a three-year period. On the other hand, the United States will eliminate all of its tariffs on the products covered under ITA-2 within the next three years (see Figure B-2).
Implications
Compared to China, certain countries took a more timely approach to phasing out their tariff schedules, such as the United States and Japan, with the United States phasing out all tariffs within a three-year period, and Japan phasing out all their tariffs immediately on July 1, 2016. Other countries, such as China, have taken a longer phaseout period, with zero-bound tariffs for 63.8% of tariffs within a four-year period, and 88.24% of their products within a six-year period (see Figure B-2).
China's position on the ITA-2 agreement was viewed by many analysts as somewhat protectionist and a reflection of its industrial policies to promote its domestic ICT industries, and many blamed China for delaying the completion of the agreement. Some observers contend that the difficulty in getting China to compromise on the ITA-2 agreement has led the United States to oppose China's participation in the current TiSA negotiations out of concern that China might attempt to water down or delay negotiations for an agreement. |245|
Figure B-2. ITA-2 Tariff Phase-out Schedule for Major Members
(percentage)
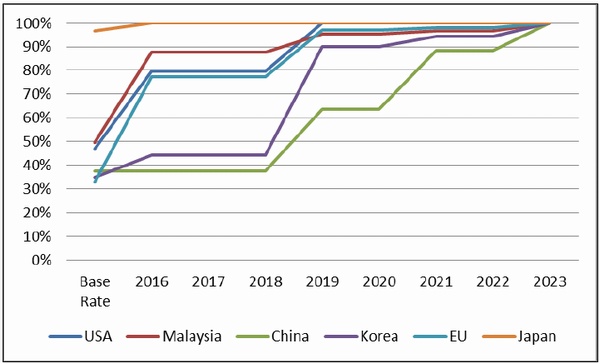
Source: World Trade Organization.
Note: Some countries released their tariff schedule to six-digit tariff lines; other countries released eight-digit tariff schedules.The Environmental Goods Agreement |246|
The Environmental Goods Agreement (EGA) is a plurilateral agreement that is being negotiated by 18 members (representing 47 nations) |247| of the World Trade Organization that seeks to eliminate or reduce tariff barriers for environmental goods. |248| These 18 countries account for 86% of global environmental goods trade. |249| The EGA came out of the 2001 Doha Ministerial Declaration, which instructed WTO members to negotiate on the reduction or the possible elimination of tariff and non-tariff barriers on environmental goods and services. |250| Environmental goods are defined by the European Union (EU) as products that "directly contribute to environmental protection and climate change mitigation," which includes products such as carbon dioxide scrubbers, recycling machinery, and renewable energy products. |251| Negotiations for the EGA were officially launched on July 8, 2014, in Geneva, Switzerland, with 18 negotiating rounds held as of October 2016. |252|
As with past similar agreements on tariff liberalization, such as ITA-2, participants may attempt to achieve a "critical mass" threshold that covers 90% or more of the trade in environmental goods in the EGA (similar to goal of the ITA-2) before it can go into effect. The current list is estimated to cover 86% of such trade.
According to USTR, "the EGA negotiations will build on a list of 54 environmental goods |253| on which leaders of the Asia-Pacific Economic Partnership (APEC) agreed to reduce tariffs to five percent or less by the end of 2015." |254| The USTR estimates that global trade in environmental goods totals nearly $1 trillion annually and that U.S. exports of such products in 2013 were $106 billion, growing at an annual rate of 8% since 2009. U.S. exporters face tariffs as high as 35% for renewable and clean energy generation, 20% for air pollution control, 21% for water and wastewater treatment, 20% for solid and hazardous waste treatment, and 20% for environmental monitoring and analysis. |255| The USTR contends that eliminating tariffs on environmental goods and services will level the playing field for U.S. exporters, increase market access for U.S. manufacturers and workers, and support more green jobs. |256|
While U.S. officials indicate that they would like to build on APECs list of 54 environmental goods, there does not appear to be a consensus on what that would cover. Some sources state that China raised concerns on certain items on the APEC list, and expressed concerns over moving toward full tariff elimination, while both the United States and the EU aim for full tariff elimination. |257|
Recent Developments
The October 2016 EGA talks reportedly yielded little progress. According to Bloomberg BNA, "Several negotiators admonished China for its muted engagement and unwillingness to offer meaningful tariff concessions for various products that have commercial sensitivities for its domestic industries." |258| On December 4, 2016, the EGA ministers were unable to reach an anticipated deal in Geneva, Switzerland. Although there was agreement on the final terms of the EGA, the WTO released a statement saying, "The intensive discussions set the stage for further talks in the near future." |259| Several stakeholders in the agreements blamed China for the derailment of the talks, with European Trade Commissioner Cecilia Malstrom saying that "China came in with their list, bringing in totally new elements of perspective, which was very late in the process." |260|
China's Accession to the WTO Government Procurement Agreement (GPA)
Government procurement policies are largely exempt from WTO rules, except for those members which have acceded to the GPA. |261| When China joined the WTO in 2001, it indicated its intention to become a member of WTO's GPA as soon as possible, but, to date, has failed to submit terms acceptable to current GPA members.
China's accession to the GPA is a major U.S. priority. China's government procurement spending in 2014 was estimated by the WTO at $281 billion. |262| A study by the European Union Chamber of Commerce in China estimates that this figure could be well over $1 trillion if all levels of government are included, plus SOEs. |263| China currently maintains a number of restrictive government procurement practices and policies that favor domestic Chinese firms. China's accession to the GPA could result in significant new opportunities for U.S. firms.
China did not formally enter into negotiations to join the GPA until 2007, and its initial offer was deemed unacceptable by the other WTO GPA parties. China promised to revise its GPA offer, but did not do so until July 2010. That offer was deemed an improvement over the previous offer but was not accepted, in part because it excluded purchases by local and provincial governments, as well as SOEs. A revised offer in December 2011 only covered public entities in three cities and two provinces. |264| Commenting on China's 2011 offer, the USTR's office stated:
China began its negotiations to join the GPA four years ago this month. Since that time, China has submitted three offers, each an improvement over the last. But China still has some distance to go before the procurement that it is offering is comparable to the extensive procurement that the United States and other Parties cover under the GPA. For example, we are urging China to cover state-owned enterprises, add more sub-central entities and services reduce its thresholds for the size of covered contracts, and remove other broad exclusions. |265|
China submitted a new offer in November 2012. According to press reports, the U.S. representative to the WTO GPA Committee stated that China's offer was "only another step but far from what we had expected." In particular, the United States and other GPA parties continue to want China to improve its offer by including coverage of SOEs, lowering thresholds above which the GPA's nondiscrimination disciplines apply, remove several broad exclusions to coverage, and expand coverage of sub-central entities. Some Members also stated opposition to China's proposal that it be allowed a five-year implementation period. |266| On December 22, 2014, China submitted its fifth offer to join the GPA, but on February 11, 2015, GPA members determined it was not comprehensive enough to warrant approval. China announced that it would be it difficult or impossible for it to make significant further additions to entity coverage. GPA members urged China to submit a new offer in 2016.
Appendix C. S&ED Outcomes
Below are summaries of the outcomes of the S&ED meetings from 2009 to 2016.
The June 2016 Economic Track
The June 2016 was the eighth and final S&ED session under the Obama Administration. It was headed by then U.S. Treasury Secretary Jacob Lew and Chinese Vice Premier Wang Yang and included leaders from 16 U.S. government agencies and senior officials from Chinese ministries and agencies. China committed that it would
- continue to reform its foreign exchange regime, further develop RMB trading and clearing capacity in the United States, and expand access to China's financial markets;
- improve the transparency and scope of its economic and financial data;
- expand policies to promote private consumption, including boosting tax revenues for local governments and tax reform and improving the social safety net system;
- continue to liberalize prices for electricity, petroleum, natural gas, transport, post and telecommunications, and municipal public utilities sectors;
- expand SOE dividend payments and report on how these funds will be spent;
- take steps to address China's steel overcapacity, including by making firms more responsive to market forces;
- improve the approval process for agricultural biotechnology products;
- ensure that all of its industry development plans will treat foreign and domestic enterprises equally;
- not impose nationality-based conditions on the purchase, sale, or use of ICT products and affirm that "access to a full range of global technology solutions ordinarily strengthens the cybersecurity of commercial enterprises";
- establish procedures for licensing domestic and foreign suppliers to provide electronic payment services for domestic currency payment card transactions in China; and
- boost cooperation on bilateral financial flows, export financing, and low carbon technologies.
The June 2015 Economic Track
The session was held in Washington, DC. China pledged that it would improve transparency and expand consultations with the United States on proposed rules on information and communications technology (ICT). Many foreign ICT firms contended that such rules are discriminatory or could require them to turn over sensitive technologies and intellectual property to the Chinese government. On proposed ICT regulations in the banking sector, China pledged that it would seek and take into account comments from foreign and domestic parties on draft regulations and would ensure that such regulations are nondiscriminatory and do not impose nationality-based conditions or restrictions on foreign firms. The two sides also reaffirmed that reaching a BIT remained a high priority and pledged to intensify negotiations and exchange improved "negative list" offers (i.e., exceptions) in early September 2015. The U.S. side raised the issue of cybersecurity. U.S. Treasury Secretary Jacob Lew stated: "We have a shared interest and a joint responsibility to pursue policies that support the global economy as well as uphold and continue to improve the global economic and financial architecture. That includes responsibilities to abide by certain standards of behavior within cyberspace. We remain deeply concerned about government-sponsored cyber theft from companies and commercial sectors." The cyber issue was also raised by President Obama when he met with a high-level Chinese delegation of government officials.
The July 2014 Economic Track
The July 2014 S&ED session addressed a number of issues. The most significant result of the session, according to some analysts, was an agreement to accelerate negotiations for a BIT and to begin the "negative list" negotiation early in 2015. China further pledged that it would
- ensure that economic efficiency, rather than the promotion of individual competitors or industries, would be the focus of China's AML and that enforcement would be fair, objective, transparent, and nondiscriminatory;
- continue moving to a market-determined exchange rate, increase exchange rate flexibility, reduce foreign exchange intervention to enhance the transparency of its foreign exchange holdings, and take steps to boost private consumption;
- take a number of steps to reform SOEs and level the playing field for foreign-invested firms;
- accelerate price reforms for petroleum, electricity, and natural gas and address excess production capacity in the steel sector;
- liberalize FDI restrictions, including those on various services;
- strengthen trade secrets and IPR protection;
- promote regulatory transparency, and improve administrative licensing, enhance the availability of government documents, and boost regulations to improve drug safety; and
- continue to liberalize the financial sector and to further open up various sectors to foreign investment.
The May 2013 Economic Track
The fifth round of the S&ED talks was held in Washington, DC. China pledged that it would
- negotiate a high-standard bilateral investment treaty with the United States that would include all stages of investment and all sectors based on a negative list approach;
- submit a new and improved offer to join the WTO GPA by the end of 2013 that would include lowered thresholds and increased coverage of sub-central entities;
- establish a pilot Free Trade Zone program in Shanghai which would enable foreign enterprises to compete on the same terms as Chinese firms across a wide range of services sectors;
- affirm its support for concluding negotiations by 2014 for new comprehensive international agreement setting guidelines on export financing by the major providers of export credits that would be consistent with international best practices;
- eliminate preferential input pricing for energy, land, and water given to SOEs and develop a market-based mechanism for determining;
- strengthen financial regulatory cooperation; and
- continue to implement polices to boost private consumption such as raising social security and employment spending by two percentage points of total fiscal spending by the end of 2015.
The May 2012 Economic Track
The fourth S&ED round was held in Beijing and focused largely on economic rebalancing and boosting foreign access to China's financial services sector. |267| China pledged that it would
- increase the number of SOEs that pay dividends;
- participate in negotiations (beginning in the summer of 2012) for new rules on official export financing with the United States and other major exporters;
- provide nondiscriminatory treatment to all enterprises, regardless of type of ownership, in terms of credit, taxation, and regulatory policies so that U.S. firms can more easily compete against Chinese SOEs;
- submit a new robust offer in 2012 to join the WTO's GPA and to intensify efforts to negotiate a BIT with the United States;
- open up more sectors to FDI and improve the transparency of its investment approval process;
- prioritize the protection of trade secrets, extend efforts to promote the use of legal software by Chinese enterprises, treat IPR owned or developed in other countries the same as IPR owned or developed in China, and hold discussions with U.S. officials on the implementation of China's commitment not to make technology transfer a pre-condition for doing business in China;
- take steps to raise household income and lower prices of consumer goods, such as cutting import tariffs, reducing taxes on services, and raising deposit rates; and
- expand market access to domestic financial markets by boosting the permitted level of foreign investment in its stock and bond markets, raising the permitted foreign equity stake in domestic securities joint ventures from 33% to 49%, and allowing foreign investors to establish joint venture brokerages to trade commodity and financial futures (with up to a 49% equity stake).
The May 2011 Economic Track
The third round of the S&ED was held in Washington, DC. Prior to the meeting, U.S. officials identified several goals for the economic track of the S&ED, including ensuring that China followed through on previous economic and trade commitments (such as on IPR protection and indigenous innovation policies) and encouraging China to make a number of reforms to its financial sector (such as adopting market-based interest rates on bank deposits and expanding market access in China for U.S. financial firms). China pledged to continue to promote domestic consumption, improve IPR enforcement, eliminate all of its indigenous innovation products catalogues, improve transparency of its economic and trade policies, and provide significant new opportunities for U.S. financial services firms in China.
May 2010 Economic Track Session
The May S&ED economic session focused heavily on the continuing efforts relating to the four pillars identified in the July 2009 session. Although few concrete accomplishments were announced at the end of the meetings, the two agreed to intensify talks on a number of bilateral economic and trade issues. The two sides pledged to
- sign a cooperation protocol on small and medium-sized firms (SMEs);
- boost economic cooperation at the central and local government level, such as promoting the establishment of state-to-province and city-to-city partnerships;
- conduct "intensive expert and high-level discussions" as early as the summer of 2010 on innovation issues (such as China's indigenous innovation proposals) and take into account the results of these talks in formulating and implementing their innovation measures; |268|
- improve cooperation to address health and safety issues relating to U.S. sales of soybeans to China;
- establish a cooperative mechanism between the U.S. Export-Import Bank and the Export-Import Bank of China on trade finance, and develop initiatives to promote exports by SMEs;
- explore the possibility of cooperating to enable the United States to treat China as a market economy, and treat certain Chinese firms as market-oriented industries, for the purpose of U.S. trade remedy laws; and
- boost investment opportunities and transparency. |269|
The July 2009 Economic Track Session
The first round of the S&ED was held in Washington, DC, and involved 12 U.S. Cabinet officials and agency heads and 15 Chinese ministers, vice ministers, and agency heads. The session was focused heavily on issues relating to the global economic crisis. Then-Secretary of the Treasury Timothy Geithner stated: "Recognizing that cooperation between China and the United States will remain vital not only to the well-being of our two nations but also the health of the global economy, we agreed to undertake policies to bring about sustainable, balanced global growth once economic recovery is firmly in place."
The two sides agreed to establish a framework of cooperation based on four pillars:
- advancing macroeconomic and structural policies to achieve sustainable and balanced growth;
- promoting more resilient, open, and market-oriented financial systems;
- strengthening trade and investment ties; and
- strengthening the international financial architecture.
These pillars appear to have been aimed at deepening bilateral cooperation in response to the global economic crisis, continuing commitments on both sides to promote policies that seek to achieve more balanced economic growth, encouraging China to continue economic and financial reforms, expanding China's role and/or participation in international economic forums, |270| and attempting to avoid new forms of trade protection.
[Source: By Wayne M. Morrison, Congressional Research Service, RL33536, 09Feb17. Wayne M. Morrison is a Specialist in Asian Trade and Finance.]
Notes:
1. The White House, Office of Science and Technology Policy, Report on Ensuring Long-Term U.S. Leadership in Semiconductors, January 6, 2017, available at https://obamawhitehouse.archives.gov/sites/default/files/microsites/ostp/PCAST/pcast_ensuring_long-term_us_leadership_in_semiconductors.pdf. [Back]
2. This report focuses primarily on U.S.-China trade relations. For information on China's economy, see CRS Report RL33534, China's Economic Rise: History, Trends, Challenges, and Implications for the United States, by Wayne M. Morrison. For general information on U.S.-China political ties, see CRS Report R41108, U.S.-China Relations: An Overview of Policy Issues, by Susan V. Lawrence. [Back]
3. The United States suspended China's MFN status in 1951, which cut off most bilateral trade. China's MFN status was conditionally restored in 1980 under the provisions set forth under Title IV of the 1974 Trade Act, as amended (including the Jackson-Vanik freedom-of-emigration provisions). China's MFN status (which was re-designated under U.S. trade law as "normal trade relations" status, or NTR) was renewed on an annual basis until January 2002, when legislation was enacted in 2000 (P.L. 104-286) granting permanent NTR (PNTR) to China once it joined the WTO (which it did in December 2001). [Back]
4. In comparison, total global U.S. merchandise exports fell by 7.3% in 2015 and by 3.3% in 2016. [Back]
5. Source: Economist Intelligence Unit, Country Data. [Back]
6. China had 120 million outbound tourists in 2015 who spent an estimated $104.5 billion. The number of outbound tourists is projected by the China Tourism Academy to total 133 million in 2016. [Back]
7. U.S. Department of Commerce, International Trade Administration, Travel & Tourism Office, News, available at http://travel.trade.gov/tinews/archive/tinews2016/20160728.asp. [Back]
8. Statista, at http://www.statista.com/statistics/278204/china-mobile-users-by-month/. [Back]
9. E-Marketer, Worldwide Retail Ecommerce Sales: E-marketer's Updated Estimates and Forecast Through 2019, 2016, available at http://www.emarketer.com/public_media/docs/eMarketer_eTailWest2016_Worldwide_ECommerce_Report.pdf. [Back]
10. Boeing Corporation, Current Market Outlook 2015-2034, available at http://www.boeing.com/resources/boeingdotcom/commercial/about-our-market/assets/downloads/Boeing_Current_Market_Outlook_2015.pdf. [Back]
11. Internet World Stats, available at http://www.internetworldstats.com/stats.htm. [Back]
12. A large share of these vehicles was produced by GM and its joint-venture partners in China. GM's website states that it currently has 11 joint ventures and two wholly owned foreign enterprises (employing 58,000 workers) in China. [Back]
13. General Motors, 2016 Full-Year and Fourth-Quarter Earnings, February 2017, available at http://media.gm.com/content/dam/Media/gmcom/investor/2017/feb/earnings/q4-documents/GeneralMotors-q4-2016-Earnings.pdf. [Back]
14. General Motors, Media, China, General Motors Announces Growth Strategy for China, March 21, 2016, available at http://media.gm.com/media/cn/en/gm/news.detail.html/content/Pages/news/cn/en/2016/Mar/0321_annoucement.html. [Back]
15. Source: USITC DataWeb. Data for 2016 are estimates based on actual data for January-November 2016. [Back]
16. Credit Suisse, Global Wealth in 2015: Underlying Trends Remain Positive, October 3, 2015, available at https://www.credit-suisse.com/us/en/about-us/research/research-institute/news-and-videos/articles/news-and-expertise/2015/10/en/global-wealth-in-2015-underlying-trends-remain-positive.html. [Back]
17. The U.S.-China Business Council, Understanding the US-China Trade Relationship, January 2017, available at https://www.uschina.org/sites/default/files/Oxford%20Economics%20US%20Jobs%20and%20China%20Trade%20Report.pdf. [Back]
18. In comparison, total global U.S. merchandise imports in 2016 declined by 2.7%. [Back]
19. Data for the first three quarters of 2016 indicate that U.S. services exports to, and imports from, China likely totaled $53.1 billion and $15.8 billion, resulting in a U.S. trade surplus of $37.3 billion. [Back]
20. Pacific Rim countries include Australia, Brunei, Cambodia, China, Hong Kong, Indonesia, Japan, South Korea, Laos, Macao, Malaysia, New Zealand, North Korea, Papua New Guinea, the Philippines, Singapore, Taiwan, Thailand, Vietnam, and several small island nations. [Back]
21. China's share of U.S. computer exports (61%) were down from 2014 levels (64%), in part from a decline in U.S. computer imports from China and increased imports from Mexico. [Back]
22. China's accession to the WTO (with the reduction of trade and investment barriers) appears to have been a major factor behind the migration of computer production from other countries to China. [Back]
23. World Bank, World Integrated Trade Solution, available at http://wits.worldbank.org/Default.aspx?lang=en. [Back]
24. Apple Corporation, 2015 Supplier List, February 2016. [Back]
25. ADB Institute, How the iPhone Widens the United States Trade Deficit with the People's Republic of China, December 2010, available at http://www.adb.org/publications/how-iphone-widens-united-states-trade-deficit-peoples-republic-china. Note, given the changing nature of Apple's supply chains, it is unclear if the estimates of value-added still hold true today. [Back]
26. Communications of the ACM, Who Captures Value in a Global Innovation Network? The Case of Apple's iPod, March 2009. [Back]
27. EPI, China Trade, Outsourcing and Jobs, December 11, 2014, available at http://www.epi.org/publication/china-trade-outsourcing-and-jobs/. [Back]
28. U.S. Department of Commerce, International Trade Administration, Jobs Supported by Exports 2015: An Update, April 8, 2016. [Back]
29. Federal Reserve Bank of San Francisco, FRBSFEconomic Letter, August 11, 2016, available at http://www.frbsf.org/economic-research/publications/economic-letter/2011/august/us-made-in-china/. [Back]
30. NBER, Import Competition and the Great U.S. Employment Sag of the 2000s, August 2014, available at http://www.nber.org/papers/w20395.pdf. [Back]
31. NBER, The China Shock: Learning from Labor Market Adjustment to Large Changes in Trade, January 2016, available at http://nber.org/papers/w21906. [Back]
32. Ball State University, The Myth and the Reality of Manufacturing in America, June 2015, available at http://conexus.cberdata.org/files/MfgReality.pdf. [Back]
33. Investment is often a major factor behind trade flows. Firms that invest overseas often import machinery, parts, and other inputs from the parent company abroad to manufacture products for export or sale locally. Other such invested overseas firms may produce inputs and ship them to their parent company for final production. [Back]
34. U.S. Department of the Treasury, Federal Reserve Bank of New York, and Board of Governors of the Federal Reserve System, Foreign Portfolio Holdings of U.S. Securities as of June 30, 2015, p.1, available at http://ticdata.treasury.gov/Publish/shl2015r.pdf. [Back]
35. 15 CFRS 806.15(a)(1). The 10% ownership share is the threshold considered to represent an effective voice or lasting influence in the management of an enterprise. See BEA, International Economic Accounts, BEA Series Definitions, available at http://www.bea.gov/international. [Back]
36. BEA also reports FDI data according to broad industrial sections, including mining; utilities; wholesale trade; information; depository institutions; finance (excluding depository institutions); professional, scientific, and technical services; nonbank holding companies; manufacturing (including food, chemicals, primary and fabricated metals, machinery, computers and electronic products, electrical equipment, appliances and components, transportation equipment, and other manufacturing); and other industries. [Back]
37. United Nations Conference on Trade and Development, World Investment Report 2016, June 22, 2016, available at http://unctad.org/en/PublicationsLibrary/wir2016_Overview_en.pdf. [Back]
38. For additional information on this issue, see CRS Report RL34314, China's Holdings of U.S. Securities: Implications for the U.S. Economy, by Wayne M. Morrison and Marc Labonte. [Back]
39. About 70% of China's total holdings of U.S. government and private securities are in U.S. Treasury securities. [Back]
40. China was the second-largest foreign holder of U.S. public and private securities as of June 2015 (after Japan at $1.9 trillion). Sources: U.S. Department of the Treasury, Foreign Portfolio Holdings of U.S. Securities as of June 2015, May 31, 2016, available at http://ticdata.treasury.gov/Publish/shl2015r.pdf. [Back]
41. Some describe foreign holdings of U.S. Treasury securities as "foreign ownership of U.S. government debt." [Back]
42. China's holdings of U.S. Treasuries could be higher as Department of the Treasury data may not always capture Chinese purchases of U.S. Treasury securities that may occur in global financial centers. [Back]
43. In addition to China's FDI in the United States and its holdings in U.S. Treasury securities, China (as of June 2015) held $331 billion in U.S. equities (such as stocks), up from $3 billion in June 2005. It also held $222 billion in U.S. agency securities. [Back]
44. U.S. Department of the Treasury, Bureau of the Fiscal Service, Treasury Bulletin, June 2016. Congressional Research Service [Back]
45. Office of the Secretary of Defense, Report to Congress, Assessment of the National Security Risks Posed to the United States as a Result of the U.S. Federal Debt Owed to China as a Creditor of the U.S. Government, July 2012. [Back]
46. According to the BEA, direct investment implies that a person in one country has a lasting interest in, and a degree of influence over, the management of, a business enterprise in another country. As such, it defines FDI as ownership or control of 10% or more of an enterprise's voting securities, or the equivalent, is considered evidence of such a lasting interest or degree of influence over management. [Back]
47. Data on country sources of U.S. FDI inflows should be interpreted with caution as they may not fully reflect the ultimate beneficiary of that investment owner (UBO). For example, a foreign company located in one country that invests in the United States may be owned by a multinational corporation headquartered in another country. [Back]
48. The Rhodium Group, China Investment Monitor: Methodology Update, July 21, 2015, available at http://rhg.com/notes/china-investment-monitor-methodology-update. [Back]
49. BEA does make report data of the ultimate beneficiary owner (UBO). It estimated the stock of Chinese FDI in the United States through 2015 at $20.8 billion, which is 40.5% higher than BEA's its conventional measurement. However, BEA's UBO data on the stock of Chinese investment in the United States was one-third the size of Rhodium's estimate. [Back]
50. The Rhodium Group, China Investment Monitor, available at http://rhg.com/interactive/china-investment-monitor. [Back]
51. U.S.-China Business Council, China's WTO Compliance, September 20, 2013. [Back]
52. OECD, FDI Regulatory Restrictiveness Index, at http://www.oecd.org/investment/fdiindex.htm. [Back]
53. USCBC, 2015 China Business Environment Survey Report, September 10, 2015, available at https://www.uschina.org/reports. [Back]
54. AmCham China, 2016 China Business Climate Survey Report, January 2016, p. 28, available at http://www.amchamchina.org/policy-advocacy/business-climate-survey/. [Back]
55. European Chamber, European Business in China, Business Confidence Survey, 2016, available at http://www.europeanchamber.com.cn/en/publications-business-confidence-survey. [Back]
56. For additional information, see CRS In Focus IF10307, A U.S.-China Bilateral Investment Treaty (BIT): Issues and Implications, by Wayne M. Morrison. [Back]
57. The Administration began efforts to review and revise the U.S. BIT model in 2009. The previous model BIT dated to 2004. The Administration's review process likely meant that negotiations with China for a BIT were limited. Model BIT can be found at https://ustr.gov/sites/default/files/BIT%20text%20for%20ACIEP%20Meeting.pdf. [Back]
58. See, CRS In Focus IF10052, U.S. International Investment Agreements (IIAs), by Martin A. Weiss and Shayerah Ilias Akhtar. [Back]
59. U.S. Department of the Treasury, Remarks of Treasury Secretary Jacob J. Lew at the Close of the Fifth U.S.-China Strategic and Economic Dialogue, July 13, 2013. [Back]
60. U.S. Department of the Treasury, U.S.-China Joint Fact Sheet Sixth Meeting of the Strategic and Economic Dialogue, July 11, 2014. [Back]
61. The White House, Fact Sheet: U.S.-China Economic Relations, September 4, 2016, available at https://www.whitehouse.gov/the-press-office/2016/09/04/fact-sheet-us-china-economic-relations. [Back]
62. USTR, Remarks by Ambassador Michael Froman to AmCham China and the U.S. Chamber of Commerce, April 27, 2015, available at https://ustr.gov/about-us/policy-offices/press-office/speechestranscripts/2015/april/remarks-ambassador-michael. [Back]
63. See, for example, the U.S.-China Economic and Security Commission, Policy Considerations for Negotiating a U.S.China Bilateral Investment Treaty, August 1, 2016, available at http://www.uscc.gov/Research/policy-considerations-negotiating-us-china-bilateral-investment-treaty. [Back]
64. U.S.-China Economic and Security Review Commission, 2015 Report to Congress, November 2015, p. 33. [Back]
65. U.S.-China Economic and Security Review Commission, 2015 Report to Congress, November 2016, p. 126. [Back]
66. The impact of globalization has been a somewhat controversial topic in the United States. Some argue that it has made it easier for U.S. firms to shift production overseas, resulting in lost jobs in the United States (especially in manufacturing) and lower wages for U.S. workers. Others contend that globalization has induced U.S. firms to become more efficient and to focus a greater share of their domestic manufacturing on higher-end or more technologically advanced production (while sourcing lower-end production abroad), making such firms more globally competitive. The result has been that the United States continues to be a major global manufacturer in terms of value-added, but there are fewer U.S. workers in manufacturing. [Back]
67. World Trade Organization, Trade Policy Review Body, Trade Policy Review, Report by the Secretariat, China, Revision, 2010, Part 2, p. 1. [Back]
68. WTO, Trade Policy Review, China, June 15, 2016, p. 20, available at https://www.wto.org/english/tratop_e/tpr_e/s342_e.pdf. [Back]
69. U.S. Trade Representative, 2013 USTR Report to Congress on China's WTO Compliance, December 2013, p. 2. [Back]
70. U.S. -China Economic and Security Review Commission, An Analysis of State-owned Enterprises and State Capitalism in China, by Andrew Szamosszegi and Cole Kyle, October 26, 2011, p. 1. [Back]
71. Xinhua News Agency, October 24, 2012. [Back]
72. Xinhua News Agency, October 24, 2010. [Back]
73. Testimony for the U.S.-China Economic and Security Review Commission by Derek Scissors, Ph.D, Chinese State Owned Enterprises and the US Policy on China, February 12, 2012. [Back]
74. Anderson, G.E., PhD, Designated Drivers, How China Plans to Dominate the Global Auto Industry, 2012, p. 2. [Back]
75. Lund University, Lending for Growth? An Analysis of State-Owned Banks in China, by Fredrik N.G. Anderson, Katarzyna Burzynska, and Sonja Opper, June 2013, p. 41. [Back]
76. The Economist, "State Capitalism's Global Reach, New Masters of the Universe, How State Enterprise is Spreading," January 21, 2012. [Back]
77. The listing can be found at http://beta.fortune.com/global500/. [Back]
78. Lund University, Lending for Growth? An Analysis of State-Owned Banks in China, by Fredrik N.G. Anderson, Katarzyna Burzynska, and Sonja Opper, June 2013, p. 41. [Back]
79. Lenovo, Investor Relations, Stock Information, Shareholding. [Back]
80. McGregor, Richard, The Party, the Secret World of China's Communist Rulers, 2010, p. 204. [Back]
81. The New York Times, Ping An's Hidden Shareholders: Friends and Family of Wen Jiabao, November 23, 2012. [Back]
82. The New York Times, Starwood Bidder Is a Reclusive Chinese Insurer With Opaque Backing, March 29, 2016. [Back]
83. The Wall Street Journal, Subsidies Stoke China's Domestic Car Makers, May 23, 2014. [Back]
84. An English translation of the MLP can be found at http://sydney.edu.au/global-health/international-networks/National_Outline_for_Medium_and_Long_Term_ST_Development1.doc. [Back]
85. As some observers describe it, China wants to go from a model of "made in China" to "innovated in China." [Back]
86. The MLP identifies main areas and priority topics, including energy, water and mineral resources, the environment, agriculture, manufacturing, communications and transport, information industry and modern service industries, population and health, urbanization and urban development, public security, and national defense. The report also identifies 16 major special projects and 8 "pioneer technologies." [Back]
87. R&D Magazine, December 22, 2009. [Back]
88. U.S. business representatives also claim that the Chinese government is using tax incentives, standards setting and requirements, security regulations, subsidies, technology transfer requirements, and other measures to promote the goals of indigenous innovation. [Back]
89. AmCham China, 2011 White Paper, April 26, 2011, p. 66. [Back]
90. Some U.S. business representatives argue that one of the main goals of China's indigenous innovation regulations is to induce foreign firms to boost their R&D activities in China in order to qualify for government contracts. [Back]
91. WTO, Transitional Review Under Section 18 of the Protocol on the Accession of the People's Republic of China, Report to the General Council by the Chair, November 17, 2011, p. 4. [Back]
92. Wall Street Journal, China Defends Rule On 'Indigenous' Tech, December 15, 2009. [Back]
93. The White House, U.S. - China Joint Statement, January 19, 2011. [Back]
94. According to a U.S. fact sheet on the meeting "China pledged to eliminate all of its government procurement indigenous innovation products catalogues and revise Article 9 of the draft Government Procurement Law Implementing Regulations (which have preferences in government procurement to national indigenous innovation products), in fulfillment of President Hu's January 2011 commitment not to link Chinese innovation policies to government procurement preferences. See U.S. Department of the Treasury, The 2011 U.S.-China Strategic and Economic Dialogue U.S. Fact Sheet - Economic Track, May 10, 2011. [Back]
95. U.S. Department of Commerce, 22nd U.S. -China Joint Commission on Commerce and Trade Fact Sheet, November 21, 2011. [Back]
96. U.S.-China Business Council, Status Report: China's Innovation and Government Procurement Policies, May 1, 2013, at https://www.uschina.org/files/public/documents/2013/05/innovation-status-report.pdf. [Back]
97. U.S.-China Business Council, USCBC 2012 China Business Environment Survey Results: Continued Growth and Profitability; Tempered Optimism Due to Rising Costs, Competition, and Market Barriers, October 2012, p. 6, available at https://www.uschina.org/info/members-survey/2012/pdfs/uscbc-2012-member-survey-results.pdf. [Back]
98. Foreign Affairs, China's Innovation Wall: Beijing's Push for Homegrown Technology, September 28, 2010. [Back]
99. U.S. Chamber of Commerce, China's Drive for 'Indigenous Innovation' - A Web of Industrial Policies, February 2011, p. 4. [Back]
100. USITC, China: Intellectual Property Infringement, Indigenous Innovation Policies, and Frameworks for Measuring the Effects on the U.S. Economy (Investigation No. 332-514, USITC Publication 4199, November 2010, pp. 6-7. [Back]
101. China was the fourth largest U.S. export market for such services for countries where data is available. See, BEA, International Trade Data, U.S. Trade in Services, available at http://www.bea.gov/iTable/iTable.cfm?ReqID=62&step=1#reqid=62&step=1&isuri=1&6210=4. [Back]
102. U.S. Department of Commerce, U.S. Fact Sheet: 26th U.S.-China Joint Commission on Commerce and Trade, November 23, 2016, available at https://www.commerce.gov/news/fact-sheets/2015/11/us-fact-sheet-26th-us-china-joint-commission-commerce-and-trade. [Back]
103. Translation from the Council on Foreign Relations, National Security Law of the People's Republic of China, July 1, 2015, available at http://www.cfr.org/homeland-security/national-security-law-peoples-republic-china/p36775. [Back]
104. The letter can be found at https://www.uschina.org/sites/default/files/Industry%20letter%20on%20TBT%20notification%20of%20CIRC%20Tech%20Regulations%20(ENG).pdf. [Back]
105. Inside U.S. Trade's, China Trade Extra, "U.S. Signals It Wants China To Slow Implementation Of Draft Insurance Regs," June 3, 2016. [Back]
106. A translated copy of the law can be found at the China Law Translate at http://chinalawtranslate.com/?lang=en. [Back]
107. Translation from China Law Translate, available at http://chinalawtranslate.com/?lang=en. [Back]
108. The law follows China's assertion of its right to "cyber-sovereignty, which it describes as "an individual country's right to choose its own Internet regulation model." See Xinhuanet, "China Voice: Why does cyber-sovereignty matter?," December 12, 2016, available at http://news.xinhuanet.com/english/2015-12/16/c_134923687.htm. [Back]
109. See translation of the law at http://chinalawtranslate.com/cybersecuritylaw/?lang=en#LBQMwbmaWhGozeMj.99. [Back]
110. For additional information on digital trade issues, see CRS Report R44565, Digital Trade and U.S. Trade Policy, coordinated by Rachel F. Fefer. [Back]
111. Lawfare, Understanding China's Cybersecurity Law, November 8, 2016, available at https://www.lawfareblog.com/understanding-chinas-cybersecurity-law. [Back]
112. U.S. Chamber of Commerce, Preventing Deglobalization, March 17, 2016, p.8., available at https://www.uschamber.com/sites/default/files/documents/files/preventing_deglobalization_1.pdf. [Back]
113. See CRS Report RL34292, Intellectual Property Rights and International Trade, by Shayerah Ilias Akhtar and Ian F. Fergusson. [Back]
114. U.S. Department of Commerce, Intellectual Property and the U.S. Economy: 2016 Update, March 2012, available at https://www.uspto.gov/sites/default/files/documents/IPandtheUSEconomySept2016.pdf. [Back]
115. U.S. Bureau of Economic Affairs, International Data, International Services, at http://www.bea.gov/index.htm. [Back]
116. Nam Pham, The Impact of Innovation and the Role of Intellectual Property Rights on U.S. Productivity, Competitiveness, Jobs, Wages and Exports, 2010, NDP Consulting. [Back]
117. Communications of the ACM, Who Captures Value in a Global Innovation Network? The Case of Apple's iPod, March 2009. [Back]
118. The Commission on the Theft of American Intellectual Property, the Report of the Commission on the Theft of Intellectual Property, May 2013. [Back]
119. U.S. Department of Homeland Security, Intellectual Property Rights Seizure Statistics, Fiscal Year 2016, January 2017, available at https://www.cbp.gov/sites/default/files/assets/documents/2017-Jan/FY%2016%20IPR%20Stats%20FINAL%201.25.pdf. [Back]
120. AmCham China, China Business Climate Survey Report, 2016, January 2016, available at http://www.amchamchina.org/about/press-center/amcham-statement/amcham-china-releases-2016-business-climate-survey. [Back]
121. European Chamber, European Business in China, Business Confidence Survey: 2016, July 7, 2016, available at http://www.europeanchamber.com.cn/en/publications-business-confidence-survey. [Back]
122. USCBC, 2016 Membership Survey: The Business Environment in China, August 25, 2016, available at https://www.uschina.org/reports/uscbc-2016-membership-survey-business-environment-china. [Back]
123. USTR, the 2016 National Trade Estimate Report, March 23, 2016, p.91, available at https://ustr.gov/sites/default/files/2016-NTE-Report-FINAL.pdf. [Back]
124. Freedom House, Freedom on the Net 2015, available at https://freedomhouse.org/sites/default/files/FH_FOTN_2015Report.pdf. [Back]
125. The United States International Trade Commission, China: Effects of Intellectual Property Infringement and Indigenous Innovation Policies on the U.S. Economy, USITC Publication 4226, May 2011, p. xiv. [Back]
126. BSA, Shadow Market, 2011 BSA Global Software Piracy Study, Ninth Edition, May 2012, at http://portal.bsa.org/globalpiracy2011/downloads/study_pdf/2011_BSA_Piracy_Study-Standard.pdf. [Back]
127. OECD, Trade in Counterfeit and Pirated Goods, Mapping the Economic Impact, 2016, p. 5. [Back]
128. Quartz, "Chinese government study based on shoddy data claims 40% of China's online products are shoddy," November 3, 2015, available at http://qz.com/539824/chinese-government-study-based-on-shoddy-data-claims-40-of-chinas-online-products-are-shoddy/. [Back]
129. Testimony of Jeremie Waterman, Senior Director, Greater China, U.S. Chamber of Commerce, before the U.S. International Trade Commission, Hearing on China: Intellectual Property Infringement, Indigenous Innovation Policies, and Frameworks for Measuring the Effects on the U.S. Economy, June 15, 2010. [Back]
130. AMSC claims Sinovel had obtained the intellectual property from a former AMSC employee who was then under arrest in Austria for economic espionage and fraudulent manipulation of data. [Back]
131. AMSC Press Release, "AMSC Filing Criminal and Civil Complaints Against Sinovel," September 14, 2011. [Back]
132. AMSC, Press Release, April 10, 2012, at http://ffiles.shareholder.com/downloads/AMSC/2346100399x0x558743/f01e0c5a-a526-4102-a818-f61f2d71ef79/AMSC_News_2012_4_10_Commercial.pdf. [Back]
133. "Data Theft Case May Test U.S. China Ties," Boston Globe, September 19, 2011. [Back]
134. AMSC, Press Release, April 23, 2015, available at http://ir.amsc.com/releasedetail.cfm?ReleaseID=908308. [Back]
135. Motion Picture Association of America, 2015 Theatrical Statistics, April 2016, available at http://www.mpaa.org/wp-content/uploads/2016/04/MPAA-Theatrical-Market-Statistics-2015_Final.pdf. [Back]
136. Such restrictions are mainly imposed to protect China's domestic film industry from foreign competition. [Back]
137. The White House, Press Release, February 17, 2012, at http://www.whitehouse.gov/the-press-office/2012/02/17/united-states-achieves-breakthrough-movies-dis,pute-china. [Back]
138. China also allows 30-40 imported foreign movies into the country on a flat fee basis and foreign firms can co-produce movies in China or provide films for TV or online viewing. See, China Briefing, Navigating Restrictions in China's Film Industry, December 2015, available at http://www.hollywoodreporter.com/news/china-box-office-grows-astonishing-851629. [Back]
139. Bloomberg, China Could Beat Hollywood by 2017, February 25, 2016. [Back]
140. The Hollywood Reporter, China Box Office Grows Astonishing 48.7 Percent in 2015, Hits $6.78 Billion, December 31, 2015, available at http://www.hollywoodreporter.com/news/china-box-office-grows-astonishing-851629. [Back]
141. China denies that public officials exert such pressure and that any technology transfers that do occur in China are the result of commercial agreements between companies. [Back]
142. U.S. Chamber of Commerce, China's Drive for 'Indigenous Innovation' - A Web of Industrial Policies, July 29, 2010. [Back]
143. AmCham China, 2012 China Business Climate Survey Report, March 2012, available at http://www.amchamchina.org/businessclimate2012. [Back]
144. U.S. Department of Commerce, U.S.-China Joint Fact Sheet on 25th Joint Commission on Commerce and Trade, December 29, 2014, available at https://www.commerce.gov/news/fact-sheets/2014/12/us-china-joint-fact-sheet-25th-joint-commission-commerce-and-trade. [Back]
145. The White House, Fact Sheet: U.S.-China Economic Relations, September 4, 2016, available at https://www.whitehouse.gov/the-press-office/2016/09/04/fact-sheet-us-china-economic-relations. [Back]
146. The report did not identify China (or any country) as the source of the intrusions. McAfee, Revealed: Operation Shady Rat, An Investigation of Targeted Intrusions Into More Than 70 Global Companies, Governments, and Nonprofit Organizations During the Last Five Years, 2011. [Back]
147. House Permanent Select Committee on Intelligence, Chairman Mike Rogers Opening Statement at the Hearing on Cyber Threats and Ongoing Efforts to Protect the Nation, October 4, 2011. [Back]
148. DNI, Office of the National Counterintelligence Executive, Foreign Spies Stealing U.S. Economic Secrets in Cyberspace, Report to Congress on Foreign Economic Collection and Industrial Espionage: 2009-2011, October 2011. [Back]
149. Mandiant, APT1: Exposing One of China's Cyber, Espionage Units, February 19, 2013, p. 2. [Back]
150. U.S. Asia Society, Complete Transcript: Thomas Donilon at Asia Society, New York March 11, 2013. [Back]
151. National Public Radio, Chinese Cyber-Hacking Discussed At Obama-Xi Summit, June 9, 2013, available at http://www.npr.org/sections/thetwo-way/2013/06/09/190058558/chinese-cyber-hacking-discussed-at-obama-xi-summit. [Back]
152. U.S. Department of Justice, at http://www.justice.gov/iso/opa/resources/5122014519132358461949.pdf. [Back]
153. A copy can be found at http://www.treasury.gov/resource-center/sanctions/Programs/Documents/cyber_eo.pdf. The EO was extended for an additional year by President Obama on March 29, 2016. [Back]
154. The White House, Press Release, September 12, 2015, available https://www.whitehouse.gov/the-press-office/2015/09/12/readout-senior-administration-officials-meeting-secretary-central. [Back]
155. The November 2015 meeting of the G-20 countries (which includes China) included language in its communique: "In the ICT environment, just as elsewhere, states have a special responsibility to promote security, stability, and economic ties with other nations. In support of that objective, we affirm that no country should conduct or support ICT-enabled theft of intellectual property, including trade secrets or other confidential business information, with the intent of providing competitive advantages to companies or commercial sectors." [Back]
156. U.S. Department of Justice, First U.S.-China High-Level Joint Dialogue on Cybercrime and Related Issues Summary of Outcomes, December 2, 2015, available at https://www.justice.gov/opa/pr/first-us-china-high-level-joint-dialogue-cybercrime-and-related-issues-summary-outcomes-0. [Back]
157. Cyber Administration of China, Sino-US High-level Joint Dialogue Hotline on Combating Cybercrime and Related Matters, August 28, 2016, available (in Chinese) at http://www.cac.gov.cn/2016-08/28/c_1119466923.htm. [Back]
158. U.S. Department of Justice, Second U.S.-China Cybercrime and Related Issues High Level Joint Dialogue, June 14, 2016, available at https://www.justice.gov/opa/pr/second-us-china-cybercrime-and-related-issues-high-level-joint-dialogue. [Back]
159. Section 337 of the Tariff Act of 1930 tasks the USITC to investigate certain unfair practices in import trade. [Back]
160. Section 337 of the Tariff Act of 1930 (19 U.S.C. �1337) enables U.S. firms to seek relief from imports that infringe on U.S. IPR (such as patent or registered trademark infringement and misappropriation of trade secrets), and other forms of unfair competition (such as violations of U.S. antitrust laws). Relief under Section 337 cases can result in a U.S. ban on certain products from entering the United States. [Back]
161. CrowdStrike Blog, The Latest on Chinese-affiliated Intrusions into Commercial Companies, October 19, 2015, available at https://www.crowdstrike.com/blog/the-latest-on-chinese-affiliated-intrusions-into-commercial-companies/. [Back]
162. Fireeye, Redline Drawn, China Recalculates its Use of Cyber Espionage, June 2016, p.3, available at https://www.fireeye.com/content/dam/fireeye-www/current-threats/pdfs/rpt-china-espionage.pdf. [Back]
163. CrowdStrike, 2015 Global Threat Report, September 5, 2015, available at https://www.crowdstrike.com/global-threat-report-2015/. [Back]
164. Following China's WTO accession, the United States, in January 2002, granted China permanent normal trade relations (PNTR) status (prior to that time, that status was on a conditional basis) to ensure that the United States and China had a formal trade relationship under the rules of the WTO. [Back]
165. China generally implemented its tariff reductions on schedule. [Back]
166. USTR, 2015 Report to Congress on China's WTO Compliance, December 2015, available at https://ustr.gov/sites/default/files/2015-Report-to-Congress-China-WTO-Compliance.pdf. [Back]
167. These industries include energy and environmental protection, new generation information technology, biotechnology, high-end equipment manufacturing, new energy, new materials, and new-energy vehicles. [Back]
168. The United States has been the largest target of China's dispute settlement cases in the WTO as well. [Back]
169. These cases can be found on the WTO's Dispute Settlement website at https://www.wto.org/english/tratop_e/dispu_e/dispu_by_country_e.htm. [Back]
170. See, CRS In Focus IF10385, China's Status as a Nonmarket Economy (NME), by Wayne M. Morrison. [Back]
171. From 2006 to 2015 U.S. agricultural exports nearly tripled. However, in 2015, U.S. agricultural exports declined by 16.4% from the previous year and during the first seven months of 2016, they were down 21.6% year-on-year. [Back]
172. The report can be found at https://www.uschamber.com/sites/default/files/documents/files/cultivating_opportunity_full.pdf. [Back]
173. OECD, Agricultural Policy Monitoring and Evaluation 2016, June 2016, available at http://www.oecd-ilibrary.org/content/book/agr_pol-2016-en. [Back]
174. USTR, Press Release, September 9, 206, available at https://ustr.gov/about-us/policy-offices/press-office/press-releases/2016/september/united-states-challenges. [Back]
175. USTR, Press Release, December 15, 2016, available at https://ustr.gov/about-us/policy-offices/press-office/press-releases/2016/december/united-states-challenges-chinese. [Back]
176. Much of China's trade is believed to be in U.S. dollars (e.g., exporters are often paid in dollars). The central government requires firms to exchange most of their dollars for RMB. [Back]
177. The official name of China's currency is the renminbi, which is denominated in units of yuan. [Back]
178. See CRS Insight IN10601, Treasury's Recent Report on Foreign Exchange Rate Policies, by Rebecca M. Nelson. [Back]
179. The RMB-dollar exchange rate on December 16, 2016 was 6.95. [Back]
180. China Daily," Full text: President Xi's speech on China-US ties," September 24, 2015. [Back]
181. International Monetary Fund, Communiqué: G20 Finance Ministers and Central Bank Governors Meeting, April 15, 2016, available at https://www.imf.org/en/News/Articles/2015/09/28/04/51/cm041616. [Back]
182. It requires Treasury to include in its report an enhanced analysis of countries that have a significant trade surplus with the United States, a material current account surplus, and engage in persistent one-sided intervention in the foreign exchange market. The enhanced analysis is to describe developments with respect to currency intervention, a description of the real effective exchange rate and estimate of undervaluation, analysis of changes in the capital controls and trade restrictions of that country, and patterns in the reserve accumulation of that country. Treasury must then assess whether a country has a significant bilateral trade surplus with the United States, has a material current account surplus, and has engaged in persistent one-sided intervention in the foreign exchange market. [Back]
183. OPIC is already banned from operating in China under previous law. [Back]
184. The October 2016 is available at https://www.treasury.gov/resource-center/international/exchange-rate-policies/Documents/2016-10-14%20%28Fall%202016%20FX%20Report%29%20FINAL.PDF. [Back]
185. See, CRS Report R43242, Current Debates over Exchange Rates: Overview and Issues for Congress, by Rebecca M. Nelson. [Back]
186. U.S. Department of the Treasury, Press Release, December 15, 2006. [Back]
187. CSIS, Crafting Asia Economic Strategy in 2013, January 28, 2013, at http://csis.org/publication/crafting-asia-economic-strategy-2013. [Back]
188. Financial Times, "China to rejoin IT trade talks to cut tariffs on electronic goods," October 6, 2013, available at https://www.ft.com/content/e12d1334-2e9b-11e3-be22-00144feab7de. [Back]
189. Written by Ashley Feng, Research Associate, Foreign Affairs, Defense, and Trade Division. [Back]
190. Germany Trade & Invest, Industrie 4.0: Smart Manufacturing for the Future, Berlin, Germany, July 2014, http://www.gtai.de/GTAI/Content/EN/Invest/_SharedDocs/Downloads/GTAI/Brochures/Industries/industrie4.0-smart-manufacturing-for-the-future-en.pdf. [Back]
191. Caixin Purchasing Managers' Index, "Caixin China General Manufacturing PMI: Operating conditions improve for first time since February 2015," press release, August 1, 2016, https://www.markiteconomics.com/Survey/PressRelease.mvc/b39068da1f39471490e6598743d824f5. [Back]
192. Coco Feng, "Emerging Sectors Slow as Manufacturing Sees Uptick, Survey Shows," Caixin, November 2, 2016. [Back]
193. Li Hui, "Made in China 2025: How Beijing is revamping its manufacturing sector," South China Morning Post, June 9, 2015. [Back]
194. The middle-income trap is a theoretical "trap" in which a country has attained a certain level of per capita income, but is unable to keep up with fully developed countries. [Back]
195. "Still made in China," The Economist, September 12, 2015, print edition. [Back]
196. Yamei Wang, "Made in China 2025" plan unveiled to boost manufacturing,"Xinhua, May 19, 2015. [Back]
197. State Council of the People's Republic of China, " 'Made in China 2025' plan issued," press release, May 19, 2015, http://english.gov.cn/policies/latest_releases/2015/05/19/content_281475110703534.htm. [Back]
198. Dan Markus and Nick Marro, " 'Made in China' Now 'Made by China': Update," The U.S.-China Business Council, May 27, 2015. [Back]
199. Scott Kennedy, Made in China 2025, Center for Strategic and International Studies, June 1, 2015, https://www.csis.org/analysis/made-china-2025. [Back]
200. Yamei Wang, " 'Made in China 2025' plan unveiled to boost manufacturing," Xinhua, May 19, 2015. [Back]
201. Dan Markus and Nick Marro, " 'Made in China' Now 'Made by China': Update," The U.S.-China Business Council, May 27, 2015. [Back]
202. "[Text in Chinese]" ("Guiding Opinions on Actively Promoting the "Internet Plus Action Plan") (in Chinese), July 4, 2015, http://www.gov.cn/zhengce/content/2015-07/04/content_10002.htm. [Back]
203. "Internet Users by Country (2016)," Internet Live Stats, (2016). [Back]
204. Gao Yuan, "Internet Plus plan a real wake-up call for Chinese companies," China Daily, March 10, 2016. [Back]
205. United States Information Technology Office, "China Pursues "Internet Plus" Strategy," press release, 2015, http://www.usito.org/news/china-pursues-internet-plus-strategy. [Back]
206. State Council of the People's Republic of China, "Full Text: Report on the Work of the Government (2015)," press release, March 16, 2015, http://english.gov.cn/archive/publications/2015/03/05/content_281475066179954.htm. [Back]
207. State Council of the People's Republic of China, "Full Text: Report on the Work of the Government (2016)," press release, March 17, 2016, http://english.gov.cn/premier/news/2016/03/17/content_281475309417987.htm. [Back]
208. Lincoln E. Davidson, "'Internet Plus and the Salvation of China's Rural Economy," July 17, 2015. [Back]
209. State Council of the People's Republic of China, "China unveils Internet Plus action plan to fuel growth," press release, July 4, 2015, http://english.gov.cn/policies/latest_releases/2015/07/04/content_281475140165588.htm. [Back]
210. Betty Xu, China Internet Plus Strategy, Seconded European Standardization Expert in China, February 5, 2015, http://sesec.eu/app/uploads/2015/06/2015_05_SESECIII_Newsletter_April_2015_Annex02_China_Internet_Plus_Strat....pdf. [Back]
211. "[Text in Chinese]" ("People's Republic of China 13th Five-Year Plan for National Economic and Social Development, Chapter 3: Main Targets") (in Chinese), March 17, 2016, http://www.sdpc.gov.cn/fzgggz/fzgh/ghwb/gjjh/201603/P020160318564052484043.pdf. [Back]
212. Gordon G. Chang, "China's 'Internet Plus' Strategy, A Net Minus," Forbes, April 19, 2015. [Back]
213. George Chen, "Can Li Keqiang's Internet Plus strategy really save China?," South China Morning Post, March 8, 2015. [Back]
214. Lincoln E. Davidson, " 'Internet Plus' and the Salvation of China's Rural Economy," The Diplomat, July 17, 2015. [Back]
215. Betty Xu, China Internet Plus Strategy, Seconded European Standardization Expert in China, February 5, 2015, http://sesec.eu/app/uploads/2015/06/2015_05_SESECIII_Newsletter_April_2015_Annex02_China_Internet_Plus_Strat....pdf. [Back]
216. Lulu Chang, "China Outlines its Latest Five Year Plan, Called Internet Plus," Digital Trends, March 6, 2016. [Back]
217. The US-China Business Council, 2016 US-China Business Council Recommendations for the US-China Joint Commission on Commerce and Trade (JCCT), 2016, https://www.uschina.org/sites/default/files/2016%20USCBC%20JCCT%20Recommendations.pdf. [Back]
218. "[Text in Chinese]" ("National Informatization Development Strategy") (in Chinese), http://www.gov.cn/zhengce/content/2015-09/05/content_10137.htm. [Back]
219. Office of the United States Trade Representative, 2015 USTR Report to Congress on China's WTO Compliance, December 2015, https://ustr.gov/sites/default/files/2015-Report-to-Congress-China-WTO-Compliance.pdf. [Back]
220. United States Information Technology Office, "State Council Released an Outline of the National Informatization Development Strategy," press release, 2016, http://www.usito.org/news/state-council-released-outline-national-informatization-development-strategy. [Back]
222. Core technologies include products such as integrated circuits and broadband networks. [Back]
223. "Outline of the National Informatization Development Strategy," China Copyright and Media, July 27, 2016. [Back]
224. Frank Zhao and Jesse Heatley, "China's Master Plan for IT Dominance," The Diplomat, August 11, 2016. [Back]
225. Ma Xiaochun and Zhang Qian, "The chips are up," People's Daily, August 5, 2015. [Back]
226. International Trade Administration, China, 2016 Top Markets Report Semiconductors and Semiconductor Manufacturing Equipment Country Case Study, 2016, http://trade.gov/topmarkets/pdf/Semiconductors_China.pdf. [Back]
227. "Chips on their shoulders," The Economist, January 23, 2016, Print edition. [Back]
228. Dezan Shira & Associates, Chips All In: Investing in China's Semiconductor Industry, March 2, 2016, http://www.china-briefing.com/news/2016/03/02/chips-all-in-investing-in-chinas-semiconductor-industry.html. [Back]
229. Ian King, "China Has Big Plans for Homegrown Chips," Bloomberg Businessweek, June 25, 2015. [Back]
230. "Chips on their shoulders," The Economist, January 23, 2016, Print edition. [Back]
231. Bien Perez, "China's chip industry bolstered by acquisitions worth US$6.61 billion by government-backed fund," South China Morning Post, March 30, 2016. [Back]
232. "Chips on their shoulders," The Economist, January 23, 2016, Print edition. [Back]
234. Semiconductor Industry Association, U.S. Semiconductor Industry Supports the Trans-Pacific Partnership, http://www.semiconductors.org/clientuploads/directory/DocumentSIA/International%20Trade%20and%20IP/TPP%20Benefits%20to%20the%20Semiconductor%20Industry-%20March%202016.pdf. [Back]
235. International Trade Administration, China, 2016 Top Markets Report Semiconductors and Semiconductor Manufacturing Equipment Country Case Study, 2016, http://trade.gov/topmarkets/pdf/Semiconductors_China.pdf. [Back]
236. Qualcomm, Press Release, January 17, 2016, available at https://www.qualcomm.com/news/releases/2016/01/16/qualcomm-and-guizhou-province-sign-strategic-cooperation-agreement-and-form. [Back]
237. The Economist, "Chips on their shoulders," January 23, 2016. [Back]
238. The White House, Office of Science and Technology Policy, Report on Ensuring Long-Term U.S. Leadership in Semiconductors, January 6, 2017, available at https://obamawhitehouse.archives.gov/sites/default/files/microsites/ostp/PCAST/pcast_ensuring_long-term_us_leadership_in_semiconductors.pdf. [Back]
239. Written by Ashley Feng, Research Associate, Foreign Affairs, Defense, and Trade Division. [Back]
240. The parties include Albania, Australia, Canada, China, Colombia, Costa Rica, the European Union (and its 28 members), Guatemala, Hong Kong, Iceland, Israel, Japan, South Korea, Malaysia, Mauritius, Montenegro, New Zealand, Norway, Philippines, Singapore, Switzerland and Liechtenstein, Taiwan, Thailand, and the United States. [Back]
241. People's Republic of China, Ministry of Commerce, "Gao Hucheng, Minister of Commerce, Released a Statement on Information Technology Agreement (ITA) Negotiations on Wider Coverage, November 25, 2013, available at http://english.mofcom.gov.cn/article/newsrelease/significantnews/201311/20131100403520.shtml. [Back]
242. Earlier in the day, the United States and China issued a joint statement on the ITA expansion agreement, stating that they had reached an agreement on the staging of their respective schedules. See USTR, Press Release, December 16, 2016. [Back]
243. Peterson Institute for International Economics, ITA-2 Success in Nairobi, December 18, 2015. [Back]
244. ITIF, How ITA Expansion Benefits the Chinese and Global Economies, April 2014, p. 15, available at http://www2.itif.org/2014-ita-expansion-benefits-chinese-global-economies.pdf. [Back]
245. Financial Times, "China in push to join US-led $4tn services trade talks," September 23, 2013. [Back]
246. Written by Ashley Feng, Research Associate, Foreign Affairs, Defense, and Trade Division. [Back]
247. The 18 participants are Australia, Canada, China, Costa Rica, the European Union, Hong Kong, Iceland, Israel, Japan, Korea, Liechtenstein New Zealand, Norway, Singapore, Switzerland, Taiwan, Turkey, and the United States. [Back]
248. "Eliminating trade barriers on environmental goods and services," World Trade Organization, July 6, 2016. [Back]
249. "The WTO Environmental Goods Agreement: Why Even A Small Step Forward Is a Good Step," World Bank, September 22, 2014. [Back]
250. "DOHA WTO Ministerial 2001: Ministerial Declaration," World Trade Organization, November 14, 2001. [Back]
251. "The Environmental Goods Agreement (EGA): Liberalising trade in environmental goods and services," European Commission, June 6, 2016. [Back]
252. Inside U.S. Trade, This Week in Trade, October 17, 2016. [Back]
253. A listing of these goods can be found at http://www.apec.org/Meeting-Papers/Leaders-Declarations/2012/2012_aelm/2012_aelm_annexC.aspx. [Back]
254. "Fact Sheet: WTO Environmental Goods Agreement: Promoting Made-in-America Clean Technology Exports, Green Growth and Jobs," Office of the United States Trade Representative, July 2014. [Back]
255. "Environmental Goods Agreement," Office of the United States Trade Representative, July 2016. [Back]
256. "Fact Sheet: WTO Environmental Goods Agreement: Promoting Made-in-America Clean Technology Exports, Green Growth and Jobs," Office of the United States Trade Representative, July 2014. [Back]
257. "Environmental goods agreement trade talks stall ahead of Nairobi ministerial," International Centre for Trade and Sustainable Development, December 9, 2015. [Back]
258. Bloomberg BNA, Environmental Goods Talks Lag as Agreement Window Narrows, October 20, 2016, available at http://www.bna.com/environmental-goods-talks-n57982078980/. [Back]
259. World Trade Organization, "Progress made on Environmental Goods Agreement, setting stage for further talks," press release, December 4, 2016, https://www.wto.org/english/news_e/news16_e/ega_04dec16_e.htm. [Back]
260. Jack Caporal, "Key lawmaker, EU and industry all blame China for torpedoing EGA deal," World Trade Online, December 7, 2016. [Back]
261. The GPA is a plurilateral agreement among 43 WTO members (including the United States, Japan, and the 28 members of the European Union) that effectively provides some market access for various nondefense government procurement projects to signatories to the agreement. Each member of the Agreement submits lists of government entities and goods and services (with thresholds and limitations) that are open to bidding by firms of the other GPA members. WTO members that are not signatories to the GPA, including those that are GPA observers (such as China), do not enjoy any rights under the GPA. Nor are non-GPA signatories in the WTO generally obligated to provide access to their government procurement markets. For more information, see https://www.wto.org/english/tratop_e/gproc_e/gp_gpa_e.htm. [Back]
262. WTO, Trade Policy Review, Report by the Secretariat, China, June 14, 2016, p.98, available at https://www.wto.org/english/tratop_e/tpr_e/s342_e.pdf. [Back]
263. European Chamber of Commerce in China, Public Procurement in China: European Business Experiences Competing for Public Contracts in China, 2011, p. 15, at http://www.europeanchamber.com.cn/en/publications-public-procurement-study-european-business-experiences-competing-for-public-contracts-in-china. [Back]
264. Inside U.S. Trade, December 8, 2011. [Back]
265. USTR Press Release, December 2011. [Back]
266. Inside U.S. Trade, December 12, 2012. [Back]
267. The session was somewhat overshadowed by events relating to Chinese human rights advocate Chen Guangcheng who had been temporarily sheltered at the U.S. embassy in Beijing prior to the session. [Back]
268. The United States also pledged that it would review Chinese concerns relating to U.S. restrictions on high technology exports to China resulting from the current U.S. export control regime. [Back]
269. The United States pledged that it welcomed investment from China and confirmed that review of foreign investment by the Committee on Foreign Investment in the United States ensures the consistent and fair treatment of all foreign investment without prejudice to the place of origin. China promised to revise its Catalogue Guiding Foreign Investment in Industries and encourage and expand areas open to foreign investment, including those relating to high-technology, energy, and the environment. China also pledged to streamline the process for investment approval. [Back]
270. The United States is seeking to broaden China's participation in international economic institutions in order to promote the goal of helping to make China a "responsible stakeholder" in the global economy. This implies that, since China greatly benefits from the global trading system and is a major global economy, it should shoulder a greater responsibility in maintaining and promoting that system (rather than just enjoying the benefits of that system. [Back]
Economic, Social and Cultural Rights
 | This document has been published on 23Feb17 by the Equipo Nizkor and Derechos Human Rights. In accordance with Title 17 U.S.C. Section 107, this material is distributed without profit to those who have expressed a prior interest in receiving the included information for research and educational purposes. |