| Information |  | |
Derechos | Equipo Nizkor
| ||
| Information | | |
Derechos | Equipo Nizkor
| ||
Dec13
IMF Working Paper
Financial and Sovereign Debt Crises: Some Lessons Learned and Those Forgotten |1|
Abstract Even after one of the most severe multi-year crises on record in the advanced economies, the received wisdom in policy circles clings to the notion that high-income countries are completely different from their emerging market counterparts. The current phase of the official policy approach is predicated on the assumption that debt sustainability can be achieved through a mix of austerity, forbearance and growth. The claim is that advanced countries do not need to resort to the standard toolkit of emerging markets, including debt restructurings and conversions, higher inflation, capital controls and other forms of financial repression. As we document, this claim is at odds with the historical track record of most advanced economies, where debt restructuring or conversions, financial repression, and a tolerance for higher inflation, or a combination of these were an integral part of the resolution of significant past debt overhangs.
Contents
I. Introduction
II. Financial Liberalization, Financial Crises, and Crisis Prevention
III. Today's Multifaceted Debt Overhang
IV. How Will the Debt Be Reduced?
V. The Return of Financial Repression
VI. Final ThoughtsTables
1. Selected Episodes of Domestic or External Debt Default, Restructuring, or Conversions: Advanced Economies, 1920s-1960s
2. Defaults on World War I Debt to the United States in the 1930s: Timing and MagnitudeFigures
1. Varieties of Crises: World Aggregate, 1900-2010
2. Gross Central Government Debt as a Percentage of GDP: Advanced and Emerging Market Economies, 1900-2011 (unweighted average)
3. Gross Total (Public plus Private) External Debt as a Percentage of GDP: 22 advanced and 25 emerging market economies, 1970-2011
4. Private Domestic Credit as a Percentage of GDP, 1950-2011
5. Sovereign Default, Total (domestic plus external) Public Debt, and Inflation Crises: World Aggregates, 1826-2010
6. Sovereign Default, Total (domestic plus external) Public Debt, and Systemic Banking Crises: Advanced Economies, 1880-2010
7. The Sequencing of Crises: The Big Picture
I. Introduction Even after one of the most severe crises on record (in its fifth year as of 2012) in the advanced world, the received wisdom in policy circles clings to the notion that advanced, wealthy economies are completely different animals from their emerging market counterparts. Until 2007-08, the presumption was that they were not nearly as vulnerable to financial crises. |2| When events disabused the world of that notion, the idea still persisted that if a financial crisis does occur, advanced countries are much better at managing the aftermath, thanks to their ability to vigorously apply countercyclical policy. Even as the recovery consistently proved to be far weaker than most forecasters were expecting, policymakers continued to underestimate the depth and duration of the downturn.
In Europe, where the financial crisis transformed into sovereign debt crises in several countries, the current phase of the denial cycle is marked by an official policy approach predicated on the assumption that normal growth can be restored through a mix of austerity, forbearance, and growth. The claim is that advanced countries do not need to apply the standard toolkit used by emerging markets, including debt restructurings, higher inflation, capital controls, and significant financial repression. Advanced countries do not resort to such gimmicks, policymakers say. To do so would be to give up hard-earned credibility, thereby destabilizing expectations and throwing the economy into a vicious circle. Although the view that advanced country financial crises are completely different, and therefore should be handled completely differently, has been a recurrent refrain, notably in both the European sovereign debt crises and the U.S. subprime mortgage crisis, this view is at odds with the historical track record. In most advanced economies, debt restructuring or conversions, financial repression, and higher inflation have been integral parts of the resolution of significant debt overhangs.
It is certainly true that policymakers need to manage public expectations. However, by consistently choosing instruments and calibrating responses based on overly optimistic medium-term scenarios, they risk ultimately losing credibility and destabilizing expectations rather than the reverse. |3| Nowhere is the denial problem more acute than in the collective amnesia about advanced country deleveraging experiences (especially, but not exclusively, before World War II) that involved a variety of sovereign and private restructurings, defaults, debt conversions, and financial repression. This denial has led to policies that in some cases risk exacerbating the final costs of deleveraging.
This paper extends earlier work on pre-World War II sovereign defaults by further documenting lesser-known domestic default episodes but particularly by delving deeper into the widespread default by both advanced and emerging European nations on World War I debts to the United States during the 1930s, as in Reinhart (2013). We examine this largely forgotten episode of debt forgiveness (the debts were never repaid) in both its incidence across countries (which is relatively well known) and its scale, or orders of magnitude of default, in comparison to the debtor countries' GDP, as well as to what it collectively amounted to from the U.S. creditor perspective.
The paper also illustrates the continuing depth of the debt overhang problem, which remains an overarching obstacle to faster recovery. Research shows that a debt overhang of this size is typically associated with a sustained period of sub-par growth, lasting two decades or more (Reinhart, Reinhart, and Rogoff, 2012, which includes a review of the scholarly literature; and World Economic Outlook, October 2012 and April 2013). In light of this dim prospect, the paper reviews the possible options, concluding that the endgame to the global financial crisis is likely to require some combination of financial repression (an opaque tax on savers), outright restructuring of public and private debt, conversions, somewhat higher inflation, and a variety of capital controls under the umbrella of macroprudential regulation. |4| Although austerity in varying degrees is necessary, in many cases it is not sufficient to cope with the sheer magnitude of public and private debt overhangs. All these options, understandably anathema to the current generation of advanced country policymakers, are more familiar to their economies than is commonly recognized. This paper highlights four basic lessons from the historical track record, as well as those lessons economists, financial market participants, and policymakers seem to have collectively forgotten.
II. Financial Liberalization, Financial Crises, and Crisis Prevention Lesson 1: On prevention versus crisis management. We have done better at the latter than the former. It is doubtful that this will change as memories of the crisis fade and financial market participants and their regulators become complacent.
Although economists' understanding of financial crises has deepened in recent years, periods of huge financial sector growth and development (often accompanied by steeply rising private indebtedness) will probably always generate waves of financial crises. As the late Diaz-Alejandro famously titled his 1985 paper "Good-bye Financial Repression, Hello Financial Crash," many crises are the result of financial liberalization gone amok. Diaz-Alejandro was writing about an emerging market (Chile in the early 1980s), but he could have said very much the same thing for advanced countries today.
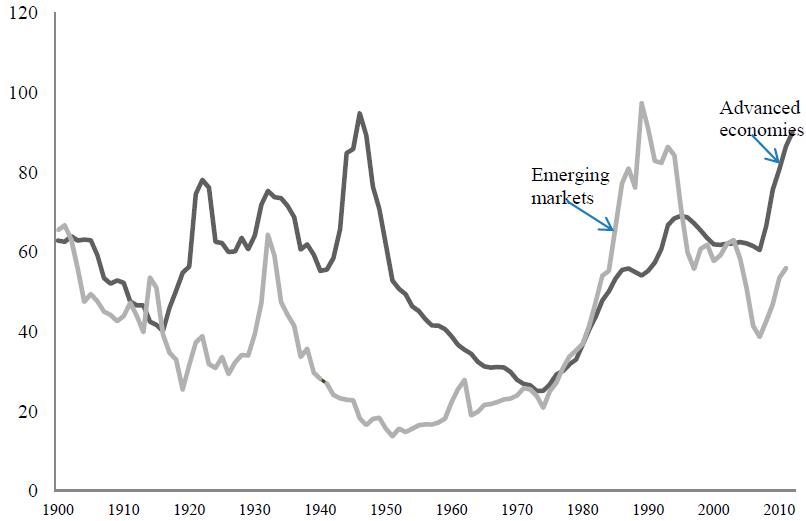
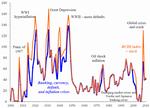
Figure 1 presents a composite index of banking, currency, sovereign default, and inflation crises, and stock market crashes. Countries are weighted by their share of world income, so advanced countries carry proportionately higher weights. The figure, and the longer analysis of crises in Reinhart and Rogoff (2009), show that the "financial repression" period, 1945-1979 in particular, has markedly fewer crises than earlier or subsequently.
Figure 1. Varieties of Crises: World Aggregate, 1900-2010 A composite index of banking, currency, sovereign default, and inflation crises, and stock market crashes (weighted by their share of world income)
Click to enlargeSource: Authors' calculation.
Notes: The banking, currency, default (domestic and external), and inflation composite (BCDI index) can take a value between 0 and 5 (for any country in any given year) depending on the varieties of crises taking place in that year. (For instance, in 1998 the index took on a value of 5 for the Russian Federation, because there was a currency crash, a banking and inflation crisis, and a sovereign default on both domestic and foreign debt obligations.) The index is then weighted by the country's share in world income. This index is calculated annually for the 66 countries in the sample for 1800-2010 (shown in the figure for 1900-onwards). The borderline banking cases identified in Laeven and Valencia (2010) for the period 2007-2010 have been added. In addition, the Barro and Ursua (2009) definition of a stock market crash has been used for the 25 countries in their sample (a subset of the 66-country sample, except for Switzerland) for the period 1864-2006; their crash definition was also updated through June 2010, to compile the BCDI+ index. For the United States, for example, the index posts a reading of 2 (banking crisis and stock market crash) in 2008; for Australia and Mexico it also posts a reading of 2 (currency and stock market crash). For each country the reading of the BCDI + index can range from zero crises per year to a maximum of six (banking, currency, inflation, domestic debt crisis, external debt crisis, and equity market crash). As there are 66 countries in the sample, the aggregate world reading can, in principle, reach a maximum value of 396 crises."Financial repression" includes directed lending to government by captive domestic audiences (such as pension funds), explicit or implicit caps on interest rates, regulation of cross-border capital movements, and generally a tighter connection between government and banks. It often masks a subtle type of debt restructuring. Recent work on monetary policy discussed in Brunnermeier and Sannikov (2012) suggests that even in "normal" times, redistribution of wealth between savers and borrowers may be one of the central channels through which monetary policy operates. Periods of monetary tightening and high real interest rates benefit savers, and periods of loose monetary policy benefit borrowers (usually including governments). This redistributive channel, all too often neglected in standard macroeconomic analyses, can become a central one in periods in which governments restrict savers' choices and opportunities. Financial repression is a form of taxation that, like any form of taxation, leads to distortions. However, perhaps because financial repression generally discourages financial excess, it is often associated with reduced frequency of crises, as Figure 1 illustrates. It is precisely for this reason that the dividing line between prudential regulation and financial repression is not always a sharp one.
III. Today's Multifaceted Debt Overhang Lesson 2: On diagnosing and understanding the scope and depth of the risks and magnitudes of the debt. What is public and what is private? Domestic and external debt are not created equal. And debt is usually MUCH bigger than what meets the eye.
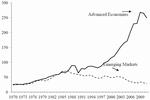
The magnitude of the overall debt problem facing advanced economies today is difficult to overstate. The mix of an aging society, an expanding social welfare state, and stagnant population growth would be difficult in the best of circumstances. This burden has been significantly compounded by huge increases in government debt in the wake of the crisis, illustrated in Figure 2. The figure shows gross central government debt as a percentage of GDP for both advanced countries and emerging markets from 1900 through 2011. As the figure illustrates, the emerging markets actually deleveraged in the decade before the financial crisis, whereas advanced economies hit a peak not seen since the end of World War II. In fact, going back to 1800, the current level of central government debt in advanced economies is approaching a two-century high-water mark.
Broader debt measures that include state and local liabilities are unfortunately not available across a long historical period for many countries (Reinhart and Rogoff, 2009), but including them would almost surely make the present public debt burden seem even larger. Similarly, gross government debt is used instead of net government debt because, again, net debt data are not available for nearly as long a period or as broad a range of countries. Another reason, however, is that net debt subtracts government old-age trust fund holdings of government debt. Including the liability side of old-age pensions and medical benefits would only make the overall debt picture much worse today relative to earlier periods.
Figure 2. Gross Central Government Debt as a Percentage of GDP: Advanced and Emerging Market Economies, 1900-2011 (unweighted average)
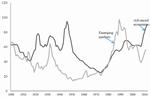
Click to enlargeSources: Reinhart, Reinhart, and Rogoff, 2012, and sources cited therein.
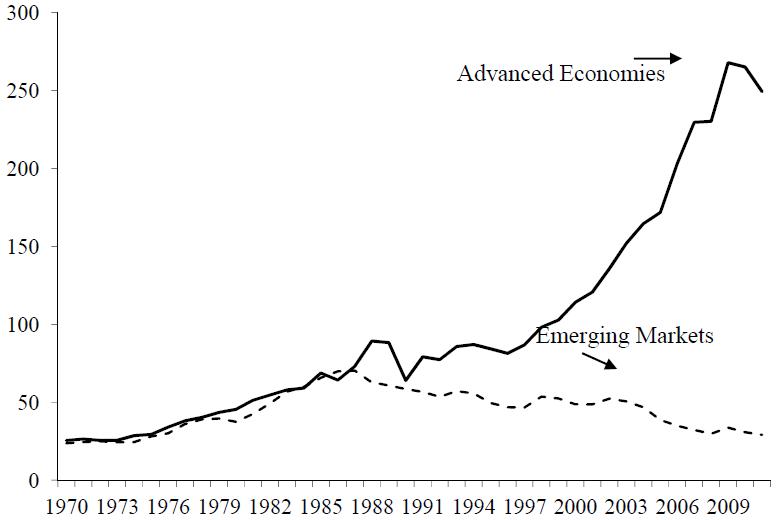
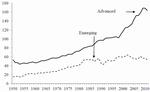
External debt is another important marker of overall vulnerability. Figure 3 illustrates the level of total external debt, including both public and private, relative to GDP. Again, a picture of deleveraging in emerging markets is clear, as is a dramatic increase in external debt for the advanced countries. Reinhart and Rogoff (2009, 2011) argue that total external debt is an important indicator because the boundaries between public and private debt can become blurred in a crisis. External private debt (particularly but not exclusively that of banks) is one of the forms of "hidden debt" that emerge out of the woodwork in a crisis. Just as bank balance sheets before the 2007-09 financial crisis did not reflect the true economic risk these institutions faced, official measures of public debt are typically a significant understatement of vulnerability.
Admittedly, a major driving force behind the rise in advanced country external debt involved the growth in intra-European debt. As the euro area is painfully learning, the lines between national debt and common currency area-wide debt can also become blurred in a financial crisis.
Figure 3. Gross Total (Public plus Private) External Debt as a Percentage of GDP: 22 advanced and 25 Emerging Market Economies, 1970-2011
Click to enlargeSources: Lane and Milesi-Ferretti, 2007; Reinhart and Rogoff, 2009; Reinhart, Reinhart, and Rogoff, 2012, and sources cited therein; World Bank Quarterly External Debt Statistics, various years; World Bank Global Development Finance, various years.
The distinction between external debt and domestic debt can be quite important. Domestic debt issued in domestic currency typically offers a far wider range of partial default options than does foreign currency-denominated external debt. Financial repression has already been mentioned; governments can stuff debt into local pension funds and insurance companies, forcing them through regulation to accept far lower rates of return than they might otherwise demand. But domestic debt can also be reduced through inflation. As Reinhart and Sbrancia (2011) show, a mix of financial repression and inflation can be a particularly potent way of reducing domestic-currency debt. The array of options is much narrower for foreign-currency debt.
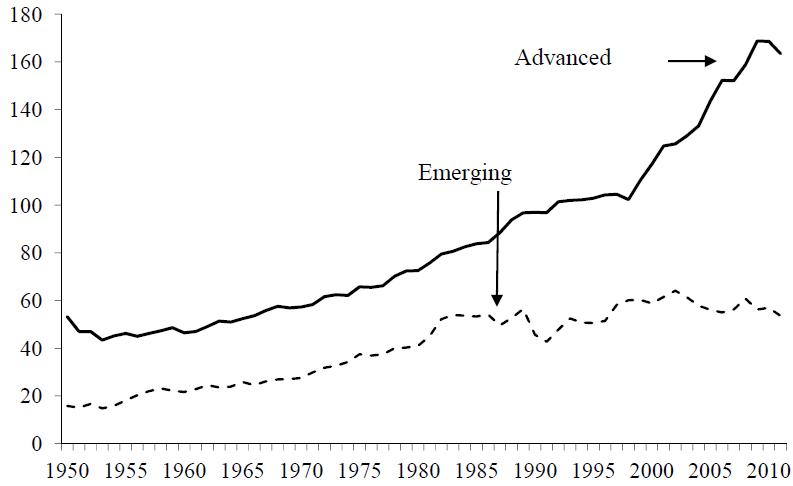
Finally, Figure 4 illustrates the explosion of private sector debt before the financial crisis. Unlike central government debt, for which the series are remarkably stationary over a two-century period, private sector debt shows a marked upward trend due to financial innovation and globalization, punctuated by volatility caused by periods of financial repression and financial liberalization. As the figure shows, the degree of deleveraging after the financial crisis has been limited. In essence, the advanced countries have exercised the government's capacity to borrow, even after a crisis, to prop up the system. This strategy likely made the initial post-crisis phase less acute. But it also implies that it may take longer to deleverage.
Figure 4. Private Domestic Credit as a Percentage of GDP, 1950-2011 (22 Advanced and 28 E merging Market Economies)
Click to enlargeSources: IMF, International Financial Statistics, and World Economic Outlook, various issues; Reinhart, Reinhart, and Rogoff, 2012, and sources cited therein.
IV. How Will the Debt Be Reduced? Lesson 3: Crisis resolution. How different are advanced economies and emerging markets? Not as different as is widely believed.
There are essentially five ways to reduce large debt-to-GDP ratios (Box1). Most historical episodes have involved some combination of these.
Box 1. The Elements of Debt Reduction1. Economic growth
2. Fiscal adjustment-austerity
3. Explicit (de jure) default or restructuring
4. Inflation surprise
5. A steady dose of financial repression accompanied by a steady dose of inflation.The first on the list is relatively rare and the rest are difficult and unpopular. |5| Recent policy discussion has tended to forget options (3) and (5), arguing that advanced countries do not behave that way. In fact, option (5) was used extensively by advanced countries to deal with post-World War II debt (Reinhart and Sbrancia, 2011) and option (3) was common enough before World War II. Given the magnitude of today's debt and the likelihood of a sustained period of sub-par average growth, it is doubtful that fiscal austerity will be sufficient, even combined with financial repression. Rather, the size of the problem suggests that restructurings will be needed, particularly, for example, in the periphery of Europe, far beyond anything discussed in public to this point. Of course, mutualization of euro country debt effectively uses northern country taxpayer resources to bail out the periphery and reduces the need for restructuring. But the size of the overall problem is such that mutualization could potentially result in continuing slow growth or even recession in the core countries, magnifying their own already challenging sustainability problems for debt and old-age benefit programs.
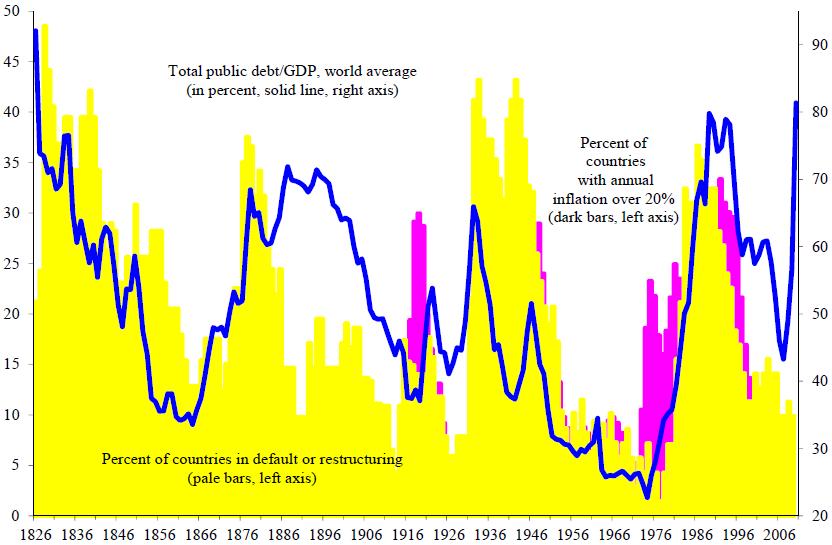
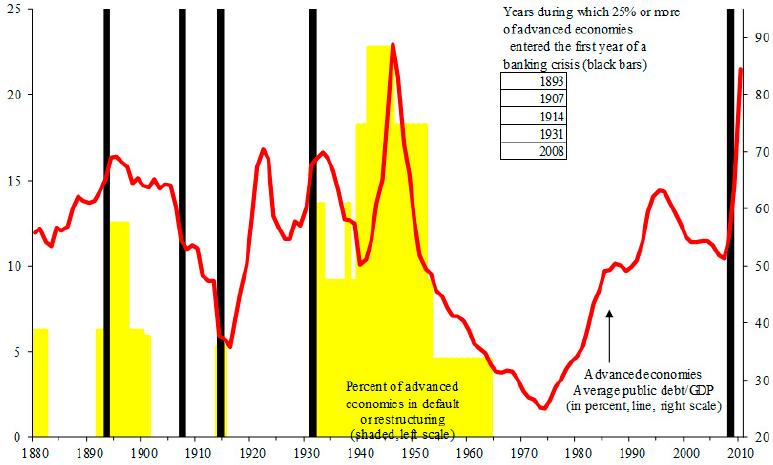
Historically, periods of high government debt such as the current one have led to marked increases in debt restructurings, as Figure 5 illustrates. The figure plots GDP-weighted central government debt against the percentage of countries experiencing inflation higher than 20 percent as well as the share of countries engaged in debt restructuring, from 1826 through 2010. The correlation is strongly statistically significant, and also holds at a more granular level, for example, when dividing the world into regions. Figure 6 illustrates the pattern of waves of sovereign defaults and restructurings that typically follow within a few years of an international wave of banking crises, again a relationship that can be demonstrated statistically, and one that also appears clearly in the individual country histories. The debt restructurings in Figures 5 and 6 do not include the numerous less-than-voluntary conversions, in which domestic debtors were forced to accept inferior terms, or in which the financial repression tax was used to reduce debt burdens.
Although the connection between indebtedness and default at the aggregate level depicted in Figures 5 and 6 for both advanced and emerging economies is highly informative, Table 1 presents a selective chronology of domestic and external credit events from the 1920s through the 1960s for the advanced economies. The term "selected" is used not because familiar events are excluded but because, as noted in Reinhart and Rogoff (2009), domestic defaults, restructurings, or conversions are particularly difficult to document and can sometimes be disguised as "voluntary." A broader definition of partial default could include financial repression and inflation, as opaque mechanisms for reducing debt via restrictive regulations and taxes.
Figure 5. Sovereign Default, Total (domestic plus external) Public Debt, and Inflation Crises: World Aggregates, 1826-2010 (debt as a percentage of GDP)
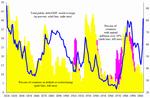
Click to enlargeSource: Reinhart and Rogoff, 2011.
Figure 6 Sovereign Default, Total (domestic plus external) Public Debt, and Systemic Banking Crises: Advanced Economies, 1880-2010 (debt as a percentage of DP)
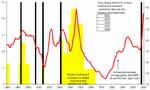
Click to enlargeSource: Reinhart and Rogoff, 2011
As Table 1 documents 13 of 21 advanced economies had at least one credit event involving the sovereign. A number of countries had multiple debt crises and an even larger number than those listed in Table 1 had, especially during the 1930s, wholesale private defaults, as evidenced by bank failures and nonfinancial corporate bankruptcies (Reinhart and Rogoff, 2009).
In many of the episodes listed in Table 1, it is difficult to document the magnitude of the debt reduction achieved by the credit event in question because of the opaque nature of the default, restructuring, and renegotiation process; the imprecision of estimated recovery rates; the lack of data; or a combination. The problem is less severe for external default episodes for which the data are better, but even so it is a challenge. Exceptions, of course, are the hyperinflation or very high inflation episodes in which all or nearly all of the existing debt stocks were liquidated (Reinhart and Rogoff, 2009).
An interesting and exceptional episode for which the magnitude of the debt relief provided by default and ultimate debt forgiveness can be estimated with some degree of precision is the World War I debt to the United States (including large-scale borrowing in the immediate aftermath of the war). These defaults, documented in Reinhart (2013) came in the summer of 1934, following the end of President Hoover's temporary moratorium on debt payments. Of the 17 countries listed in Table 2 as having borrowed from the United States during or right after the war, only Finland repaid its debt. (It is notable that Finland's debt was only 0.2 percent of Finnish GDP compared with burdens two orders of magnitude larger for France and the United Kingdom.) The remaining countries received what in today's language is now called debt forgiveness of the type usually associated only with highly indebted poor countries.
Table 2 presents the amounts of public debt to the United States that was defaulted on and presents information, where nominal GDP data are available, of the magnitude of the default or debt reduction as a percentage of the country's GDP. The magnitude of debt relief is considerable. Perhaps not surprisingly, it is largest for France and the United Kingdom, who enjoyed debt-to-GDP reductions of 20-25 percent. As shown in Reinhart (2013), this magnitude is comparable to a number of the emerging market defaults in the post-World War II era, once eventual recovery rates are taken into account. That is, although some emerging market debt burdens ultimately reached 60-100 percent of GDP, creditors typically received significant compensation with recovery rates often in excess of 50 percent, even in cases of dramatic default. By contrast, the defaults on World War I debt to the United States were near total. These estimates in Table 2 are conservative, being based on debt levels that do not include interest on arrears, so the effective defaults are in fact even larger. |6|
Table 1. Selected Episodes of Domestic or External Debt Default, Restructuring, or Conversions: Advanced Economies, 1920s-1960s
Country Dates Commentary Australia 1931-32 Domestic debt Conversion Agreement Act in 1931/32 appears to have done something similar to the later New Zealand-induced conversion. See New Zealand entry. |1| Austria 1920-22
1932-33
1934
1938
1940-52
1945 (domestic default)Hyperinflation erodes domestic debt.
Depression, external default.
World War I debt (see Table 2); not repaid.
External debt was ultimately settled in 1952.
Domestic default. Restoration of schilling (limit of 150 per person). Remainder placed in blocked accounts. In December 1947, large amounts of previously blocked schillings were invalidated and rendered worthless. Temporary blockage of 50 percent of deposits.Belgium 1934 World War I debt (see Table.2); not repaid. *Canada (Alberta) April 1935 The only province to default--the default lasted for about 10 years. France 1934 World War I debt (see Table.2); not repaid. Germany 1922-23
1932-53
June 20, 1948Hyperinflation liquidates domestic currency debt.
External debt. Largest Depression-time default.
Monetary reform setting limit of 40 Deutschmark per person. Partial cancellation and blocking of all accounts.Greece 1932 Interest on domestic debt was reduced by 75 percent beginning in 1932. Domestic debt was about one-quarter of total public debt. 1932-64
1934
1941-44External arrears not resolved until 1964.
World War I debt (see Table 2); not repaid.
Hyperinflation eroded what little domestic debt there was.Italy 1920
1924
1926Conversions of domestic debt in the 1920s; multiple attempts to reduce the high level of floating rate debt. Unclear how "voluntary" these conversions were; not counted as sovereign defaults. 1934
1944
1940-1946World War I debt (see Table.2); not repaid.
Inflation of 500 percent wipes out domestic debt.
External debt in default.Japan 1942-52 External debt in default. 1945-47 Inflation of 150-600 percent wipes out domestic debt. March 2, 1946-52 After inflation, exchange of all bank notes for new issue (1 to 1) limited to 100 yen per person. Remaining balances were deposited in blocked accounts. New Zealand 1933 In March 1933, the New Zealand Debt Conversion Act was passed providing for voluntary conversion of internal debt amounting to 113 million pounds to a basis of 4 % for ordinary debt and 3 % for tax-free debt. Holders had the option of dissenting but interest in the dissented portion was made subject to an interest tax of 33.3%. |1| Spain October 1936-April 1939 Interest payments on external debt were suspended; arrears on domestic debt service. United States 1933 Abrogation of the gold clause in conjunction with a 40 percent reduction in the gold content of the U.S. dollar. United Kingdom 1934 Most of the outstanding World War I debt was consolidated into a 3.5 percent perpetual annuity. This domestic debt conversion was apparently voluntary.
World War I debt to the United States defaulted on following the end of the Hoover 1931 moratorium.
See Table 2.Sources: Bailey (1950), Dornbusch and Draghi (1990), League of Nations, various issues, Lindert and Morton (1989), New York Times (1934), Pick and Sedillot (1971), Reddell (2012), Reinhart and Rogoff (2009), United Nations (1948).
1. See Reddell (2012), Schedvin (1970) and Lloyd Prichard (1970), for accounts of the Australian and New Zealand conversions, respectively, during the Depression. Michael Reddell kindly alerted the authors to these episodes and references.
Table 2. Defaults on World War I Debt to the United States in the 1930s: Timing and Magnitude (US$ and percent of GDP)
Wartime Debt Postwar Debt Total Debt (ex. arrears) As a % of GDP Armenia 0 11,959,917.49 11,959,917.49 n.a Austria 0 24,055,708.92 24,055,708.92 1.7 Belgium 171,780,000.00 207,307,200.43 379,087,200.43 3.3 Czechoslovakia 0 91,879,671.03 91,879,671.03 n.a Estonia 0 13,999,145.60 13,999,145.60 n.a Finland 0 8,281,926.17 8,281,926.17 0.2 France 1,970,000,000.00 1,434,818,945.01 3,404,818,945.01 24.2 Greece 0 27,167,000.00 27,167,000.00 8.9 Hungary 0 1,685,835.61 1,685,835.61 n.a Italy 1,031,000,000.00 617,034,050.90 1,648,034,050.90 19.1 Latvia 0 5,132,287.14 5,132,287.14 n.a Lithuania 0 4,981,628.03 4,981,628.03 n.a Poland 0 159,666,972.39 159,666,972.39 n.a Romania 0 37,911,152.92 37,911,152.92 n.a Russia 187,729,750.00 4,871,547.37 192,601,297.37 n.a United Kingdom 3,696,000,000.00 581,000,000.00 4,277,000,000.00 22.2 Yugoslavia 10,605,000.00 41,153,486.55 51,758,486.55 n.a total (ex. Arrears) 7,067,114,750.00 3,272,906,475.56 10,340,021,225.56 n.a as a % of US GDP 15.7 Memorandum item: Total (including arrears) according to NY Times June 15, 1934. 11,628,311,614.94 as a % of US GDP 16.9 Sources: New York Times, June 1934; Reinhart (2013) and sources cited therein.
Additional Sources: Debt amounts are taken from Bailey (1950, p. 701). See http://www.u-s-history.com/pages/h1358.html. Exchange rates are from Historical Statistics of the United States; and Nominal GDP for 1934 are as follows:
U.S. and U.K. from MeasuringWorth, http://www.measuringworth.com/datasets/usgdp/result.php France from Smits et al. (2009) , Historical National Accounts Database (HNAD), 1815-1938, http://www.rug.nl/research/ggdc/data/historical-national-accounts
Italy: Francese and Pace (2008 1861-2006; Belgium: 1835-2005, BNB, Centre d'etudes economiques de la KUL; Greece: Kostelenos (2007), 1830-1939; Finland GDP: Smits et al. (2009) Historical National Accounts Database (HNAD), 1860-2001, http://www.rug.nl/research/ggdc/data/historical-national-accounts.
Note: n.a. denotes not available.From the U.S. creditor vantage point, the collective default of World War I debt owed by foreign countries amounted to 15-16 percent of U.S. GDP. In this connection, it must be added that the United States had already defaulted on its sovereign debt in April 1933 to domestic and external creditors alike. The abrogation of the gold clause in conjunction with a subsequent 40 percent reduction in the gold content of the U.S. dollar (January 1934) also amounted to a debt haircut amounting to about 16 percent of GDP. |7| The magnitude and incidence of post-World War I default worldwide is also understated by not considering in this exercise war debts owed by countries (other than the United States) to the United Kingdom. For the most part, these debts were also defaulted on and never repaid.
As unpleasant as these credit events were, it is clear that they played a substantive role in reducing the debt overhang from both World War I and the Great Depression. |8| In light of the historic public and private debt levels discussed above, it is difficult to envision a resolution to the current five-year-old crisis that does not involve a greater role for explicit restructuring.
V. The Return of Financial Repression Lesson 4: On international financial architecture after global crises--the return of financial repression.
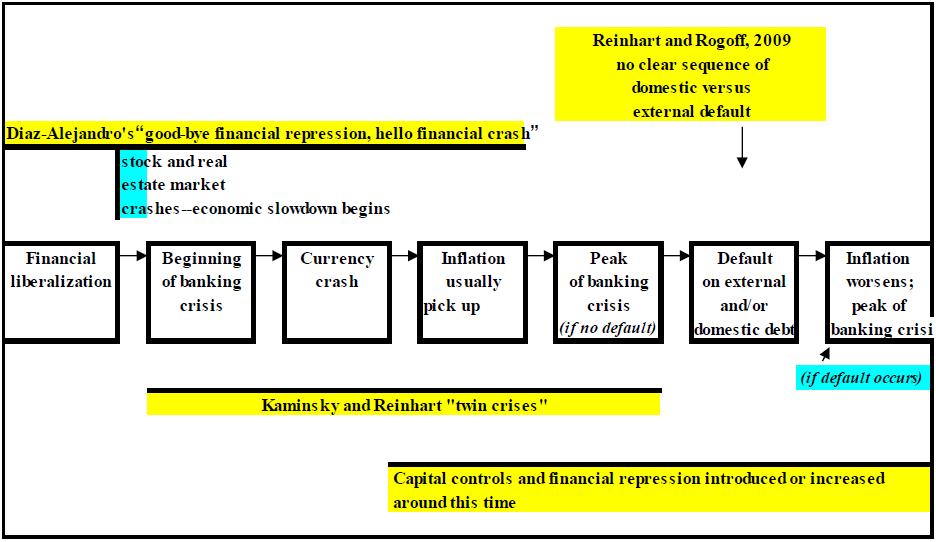
Figure 7, which extends the schematic in Reinhart and Rogoff (2009), highlights a "prototype" sequence of events after a financial crisis. In the typical sequence, the current stage often ends with some combination of capital controls, financial repression, inflation, and default. This turn of the pendulum from liberalization back to more heavy-handed regulation stems from both the greater aversion to risk that usually accompanies severe financial crises, including the desire to prevent new ones from emerging, as well as from the desire to maintain interest rates as low as possible to facilitate debt financing. Reinhart and Sbrancia (2011) document how, following World War II (when explicit defaults were limited to the losing side), financial repression via negative real interest rates reduced debt to the tune of 2 to 4 percent a year for the United States, and for the United Kingdom for the years with negative real interest rates. |9| For Italy and Australia, with their higher inflation rates, debt reduction from the financial repression "tax" was on a larger scale and closer to 5 percent per year. As documented in Reinhart (2012), financial repression is well under way in the current post-crisis experience.
Figure 7. The Sequencing of Crises: The Big Picture
Source: Authors' illustration based on prototype sequencing pattern.
VI. Final Thoughts Of course, if policymakers are fortunate, economic growth will provide a soft exit, reducing or eliminating the need for painful restructuring, repression, or inflation. But the evidence on debt overhangs is not heartening. Looking just at the public debt overhang, and not taking into account old-age support programs, the picture is not encouraging. Reinhart, Reinhart, and Rogoff (2012) consider 26 episodes in which advanced country debt exceeded 90 percent of GDP, encompassing most or all of the episodes since World War II. (They tabulate the small number of cases in which the debt overhang lasted less than five years, but do not include these in their overhang calculations.) They find that debt overhang episodes averaged 1.2 percent lower growth than individual country averages for non-overhang periods. Moreover, the average duration of the overhang episodes is 23 years. Of course, there are many other factors that determine longer-term GDP growth, including especially the rate of productivity growth. But given that official public debt is only one piece of the larger debt overhang issue, it is clear that governments should be careful in their assumption that growth alone will be able to end the crisis. Instead, today's advanced country governments may have to look increasingly to the approaches that have long been associated with emerging markets, and that advanced countries themselves once practiced not so long ago.
[Source: Prepared by Carmen M. Reinhart and Kenneth S. Rogoff, IMF Research Department, Washington D.C., Dec13]
Bailey, Thomas A., 1950, "A Diplomatic History of the American People," New York: Appleton- Century-Crofts, Inc. Barro, Robert, and Jose Ursua, 2009, "Stock-Market Crashes and Depressions," NBER Working Paper No. 14760 (Cambridge, Massachusetts: National Bureau of Economic Research). Brunnermeier, Markus K., and Yuliy Sannikov, 2012, "Redistributive Monetary Policy," paper prepared for the Federal Reserve Bank of Kansas City's Economic Policy Symposium, Jackson Hole, Wyoming (August 30-September 1). Diaz-Alejandro, Carlos, 1985, "Good-bye Financial Repression, Hello Financial Crash," Journal of Development Economics, Vol. 19, No. 1-2, pp. 1-24. Dornbusch, Rudiger, and Mario Draghi, 1990, "Public Debt Management: Theory and History," (Cambridge: Cambridge University Press). Francese, Maura, and Angelo Pace, 2008, "Il Debito Pubblico Italiano Dall'Unita a Oggi. Una Ricostruzione Della Serie Storica," Banca d'Italia, Occasional paper No. 31, Roma. Frankel, Jeffrey A., and Jesse Schreger. 2013, "Over-optimistic Official Forecasts and Fiscal Rules in the Eurozone," Review of World Economics (published online, February 14). Historical National Accounts Database (HNAD), 1860-2001, http://www.rug.nl/research/ggdc/data/historical-national-accounts International Monetary Fund, 2012 and 2013, World Economic Outlook, IMF, Washington, D.C. Kaminsky, Graciela L., and Carmen M. Reinhart, 1999, "The Twin Crises: The Causes of Banking and Balance of Payments Problems," American Economic Review, Vol. 89 (June), pp. 473-500. Kostelenos, George, and Socrates Petmezas et al. 2007, "Gross Domestic Product 18301939," Sources of Economic History of Modern Greece, Historical Archives of the National Bank of Greece. Laeven, Luc, and Fabian Valencia, 2010, "Resolution of Banking Crises: The Good, the Bad, and the Ugly," IMF Working Paper 10/146. Forthcoming in Stijn Claessens, M. Ayhan Kose, Luc Laeven, and Fabian Valencia (eds.), Financial Crises: Causes, Consequences, and Policy Responses (Washington, D.C.: International Monetary Fund.) Lane, Philip, and Gian Maria Milesi-Ferretti, 2007, "The External Wealth of Nations Mark II: Revised and Extended Estimates of Foreign Assets and Liabilities, 1970-2004," Journal of International Economics, Vol. 73, pp. 223-50. League of Nations, various years, World Economic Survey: 1926-1944. All issues. (Geneva: League of Nations). Lindert, Peter H., and Peter J. Morton, 1989, "How Sovereign Debt Has Worked," in Jeffrey Sachs (ed.), Developing Country Debt and Economic Performance, Vol. 1 (University of Chicago Press), pp. 39-106. Lloyd Prichard, Muriel, 1970, "An Economic History of New Zealand to 1939" (Auckland & London, Collins). MeasuringWorth, http://www.measuringworth.com/datasets/usgdp/result.php New York Times, 1934, "All Debtors to US Excepting Finland Default Today" (June 15). New York Times, 1934, "Debts Dead, a View in Paris" (June 15). Pick, Franz, and Rene Sedillot, 1971, All the Monies of the World: A Chronicle of Currency Values (New York: Pick Publishing Corporation). Reddell, Michael, 2012, "The New Zealand Debt Conversion Act 1933: A Case Study in Coercive Domestic Public Debt Restructuring," Reserve Bank of New Zealand Bulletin, Vol. 75, pp. 38-45. Reinhart, Carmen M., 2013, "A Distant Mirror of Debt, Default, and Relief," Harvard University, October. Reinhart, Carmen M., and Vincent R. Reinhart, and Kenneth S. Rogoff, 2012, "Public Debt Overhangs: Advanced-Economy Episodes since 1800," Journal of Economic Perspectives, Vol. 26, No. 3, pp. 69-86. Reinhart, Carmen M., and Kenneth S. Rogoff, 2013, "Banking Crises: An Equal Opportunity Menace," Journal of Banking & Finance Vol. 37, November, pp. 4557-573. ----- , 2011, "From Financial Crash to Debt Crisis," American Economic Review, Vol. 101, No. 5, pp. 1676-706. ----- , 2009, "This Time Is Different: Eight Centuries of Financial Folly," Princeton, New Jersey: Princeton University Press. Reinhart, Carmen M., Kenneth S. Rogoff, and Miguel A. Savastano, 2003, "Debt Intolerance," Brookings Papers on Economic Activity 1 (Spring), pp. 1-74. Reinhart, Carmen M., and M. Belen Sbrancia, 2011, "The Liquidation of Government Debt," NBER Working Paper No. 16893, Cambridge, Massachusetts: National Bureau of Economic Research, forthcoming in Economic Policy. Schedvin, C. B., 1970, "Australia and the Great Depression," Sydney: Sydney University Press. Smits, J.P., P.J. Woltjer, and D. Ma, 2009, "A Dataset on Comparative Historical National Accounts, ca. 1870-1950: A Time-Series Perspective," Groningen Growth and Development Centre Research Memorandum GD-107, Groningen: University of Groningen. Sturzenegger, Federico, and Jeromin Zettlemeyer, 2006, "Debt Defaults and Lessons from a Decade of Crises," Cambridge, Massachusetts: MIT Press. United Nations, 1948, Department of Economic Affairs, Public Debt, 1914-1946 (New York: United Nations).
Notes:
1. This paper was written for the IMF conference on"Financial Crises: Causes, Consequences, and Policy Responses," September 14, 2012. A version is forthcoming in S. Claessens, M. A. Kose, L. Laeven, and F.Valencia (eds.), Financial Crises: Causes, Consequences, and Policy Responses, IMF. We are grateful to National Science Foundation Grant No. 0849224 for financial support. [Back]
2. Reinhart and Rogoff (2009 and 2013) present evidence to the contrary. Since the early 1800s, the incidence of banking crises is similar for advanced and emerging economies--the post-World War II period is the era when crises visited the wealthy economies with less frequency. [Back]
3. See Frankel and Schreger (2013) on the chronic over-optimism in Eurozone forecasts and the underlying motivation. [Back]
4. Reinhart, Rogoff, and Savastano (2003) document how emerging market external debt overhangs were usually resolved through a combination of t hese options. [Back]
5. See Reinhart, Rogoff, and Savastano (2003) on the post-World War II experience and Sturzenegger and Zettlemeyer (2006) on the more recent emerging market experiences. [Back]
6. See memorandum item in Table 2. [Back]
7. See Reinhart (2013). [Back]
8. "Debts Dead, a View in Paris" (New York Times, June 15, 1934). [Back]
9. Negative real interest rates are a tax on bondholders and effect a transfer or redistribution from savers to borrowers. [Back]
 | This document has been published on 23Jan14 by the Equipo Nizkor and Derechos Human Rights. In accordance with Title 17 U.S.C. Section 107, this material is distributed without profit to those who have expressed a prior interest in receiving the included information for research and educational purposes. |